Uncategorized
Stocks, Gold, & Crypto Soar In Q1 Despite Rout In Rate-Cut Expectations
Stocks, Gold, & Crypto Soar In Q1 Despite Rout In Rate-Cut Expectations
Q1 macro was characterized by a vast divergence between ‘soft’…
Share this:

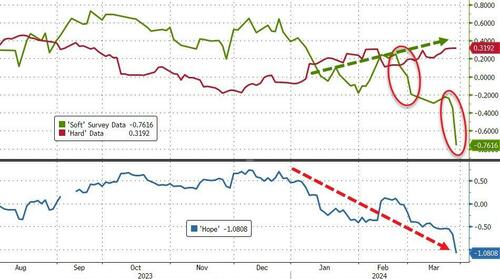
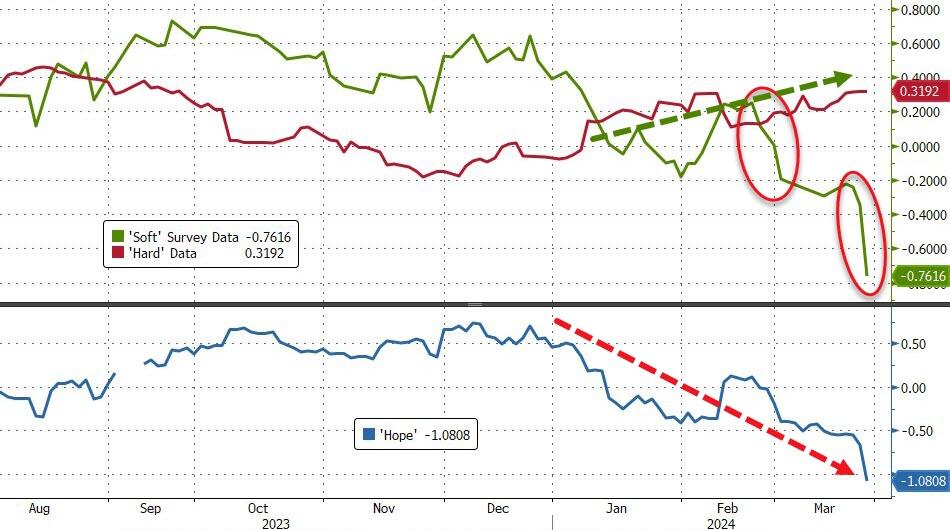
Q1 macro was characterized by a vast divergence between 'soft' surveys crashing as 'hard' data drifting higher...
Source: Bloomberg
The strong 'hard' data - and sticky inflation - along with endless jawboning, drove rate-hike expectations drastically lower in Q1. 2024 expectations for The Fed crashed from almost seven cuts to less than three...
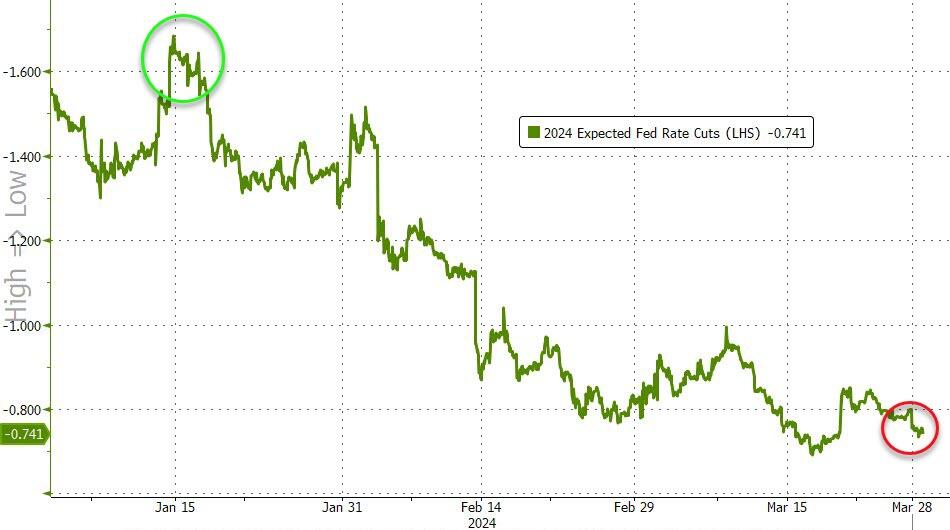
Source: Bloomberg
...and stocks did not even blink!
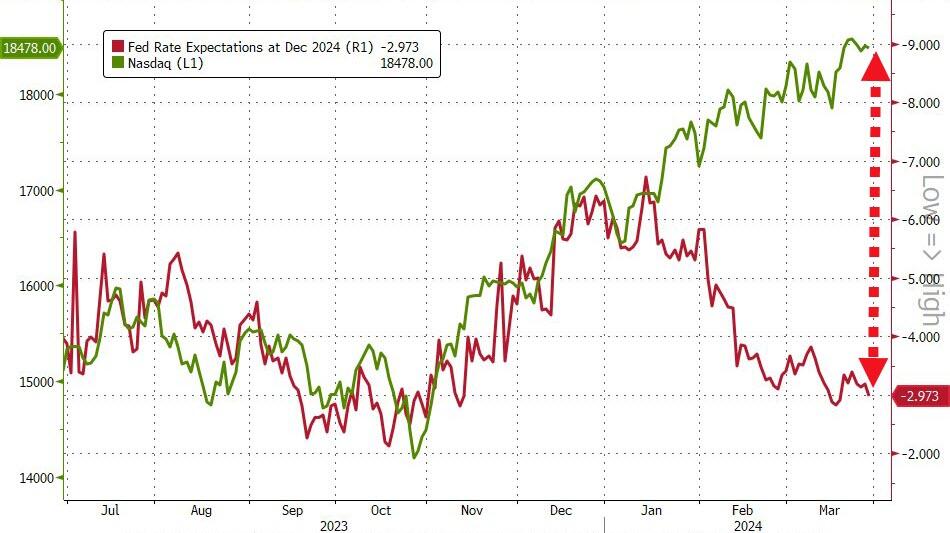
Source: Bloomberg
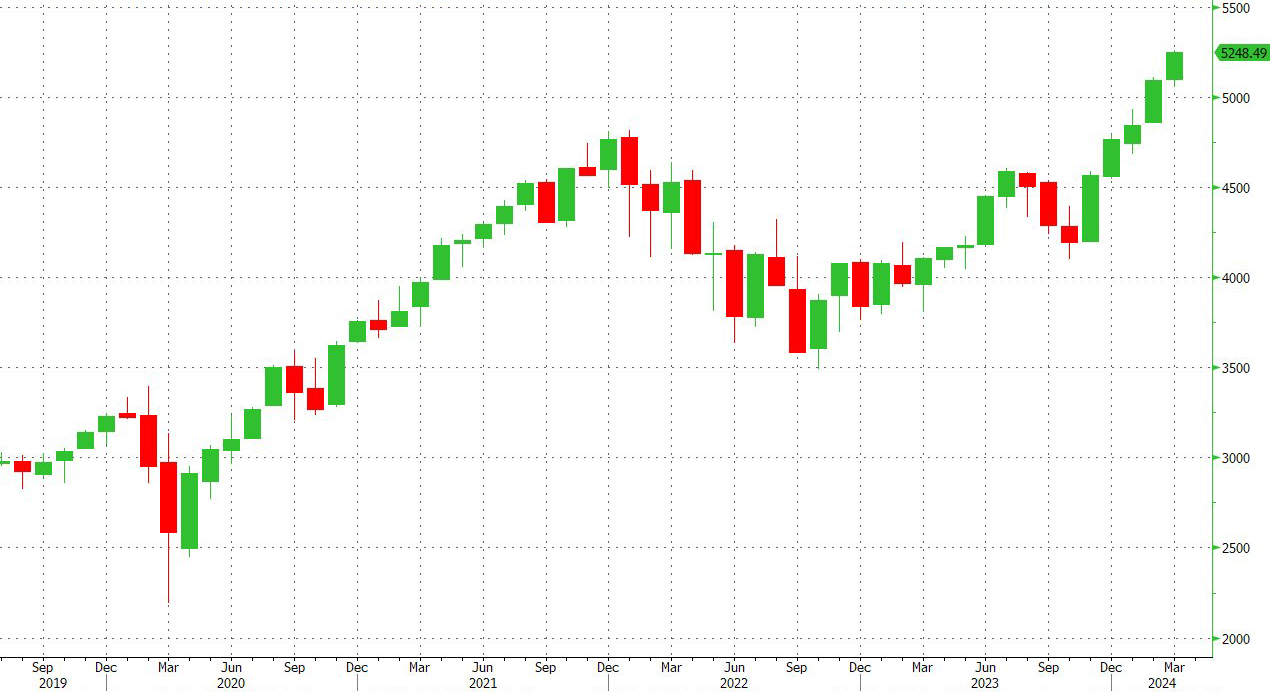
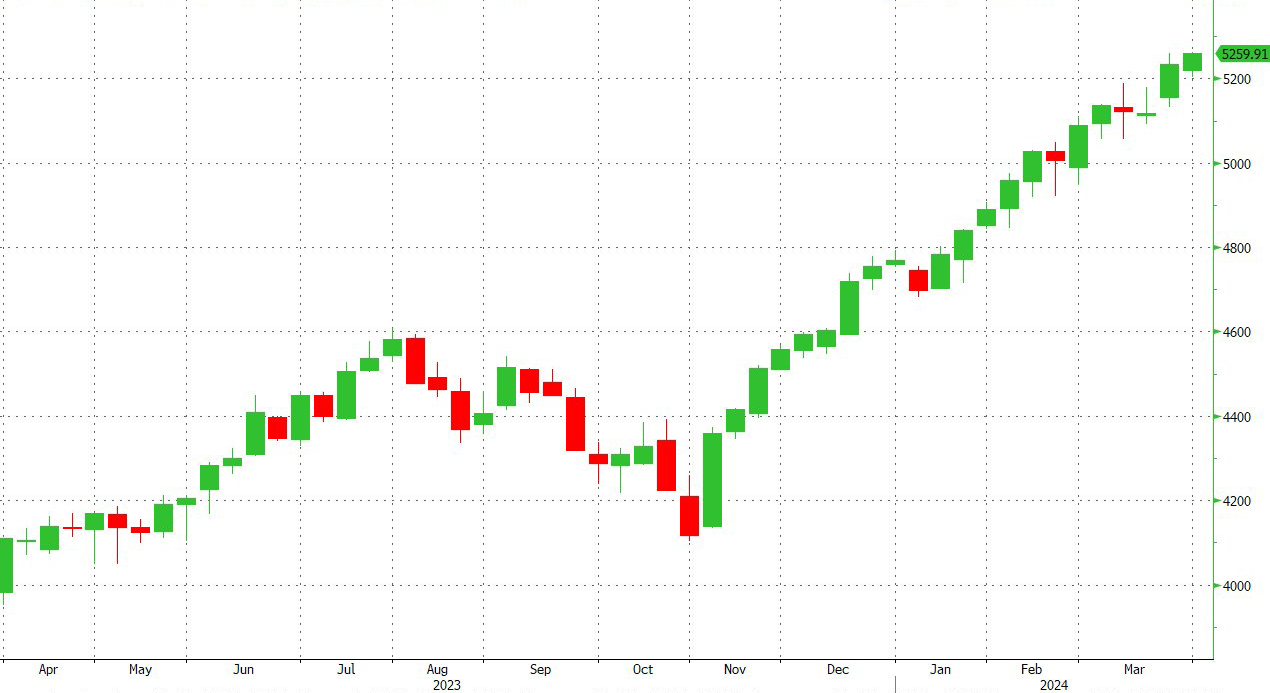
With the S&P 500 surging to its best start to a year since 2019 (outperforming Nasdaq)...
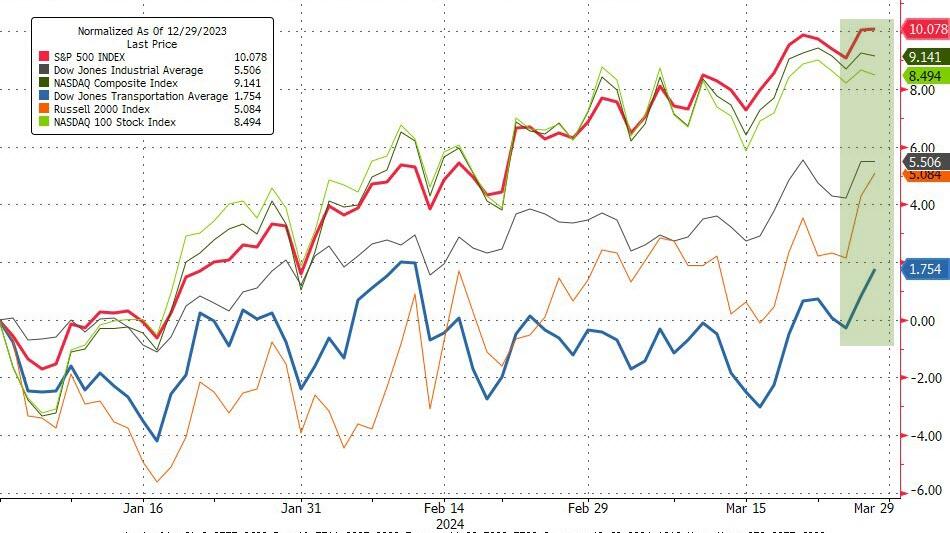
Source: Bloomberg
That's the 5th green month in a row...
Source: Bloomberg
And stocks are up for 18 of the last 22 weeks (it hasn't done more than that since 1989)...
Source: Bloomberg
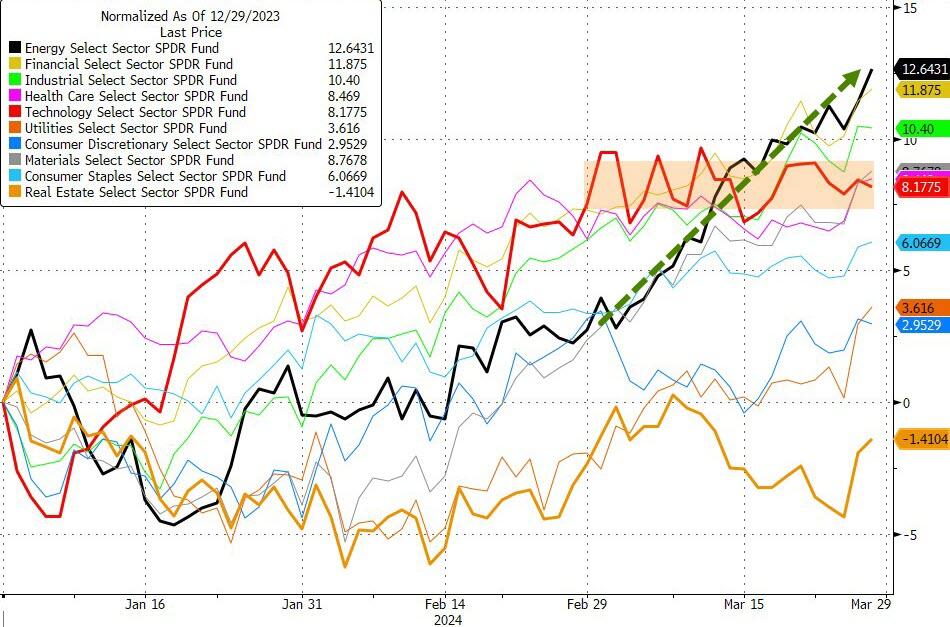
Notably, and perhaps surprisingly, Q1's best performing sector was not tech... it was Energy (with Real Estate the only sector red in Q1). In fact in March, Energy stocks are up 10% while Tech is unchanged...
Source: Bloomberg
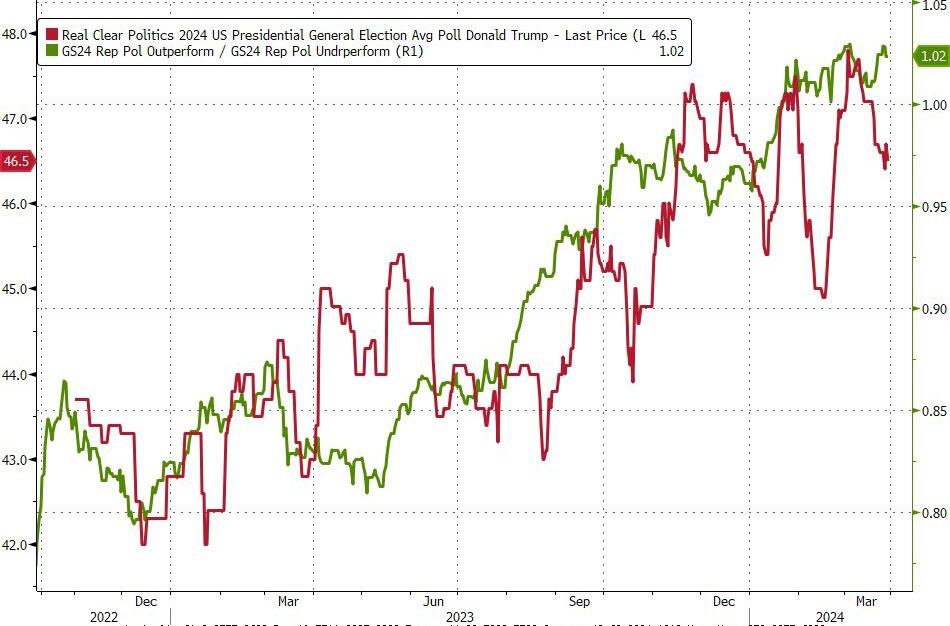
Some have argued that Q1's market strength reflects a growing belief that Republicans will win in November...
Source: Bloomberg
And don't let anyone tell you this has not been a multiple expansion - tech is now back at over 28x - its post-dot-com bust highs...
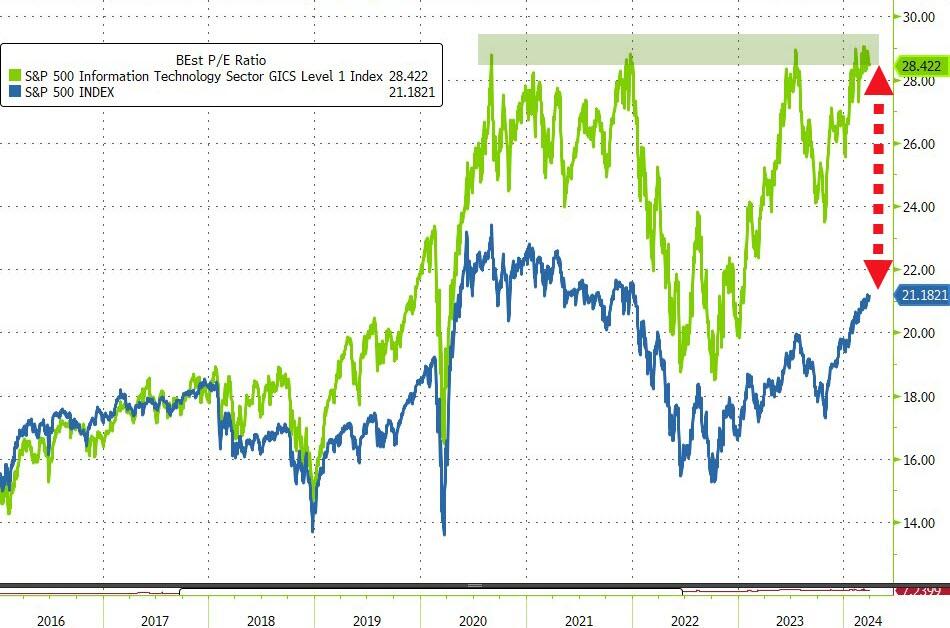
Source: Bloomberg
MTUM (momentum) saw its best start to a year... ever....
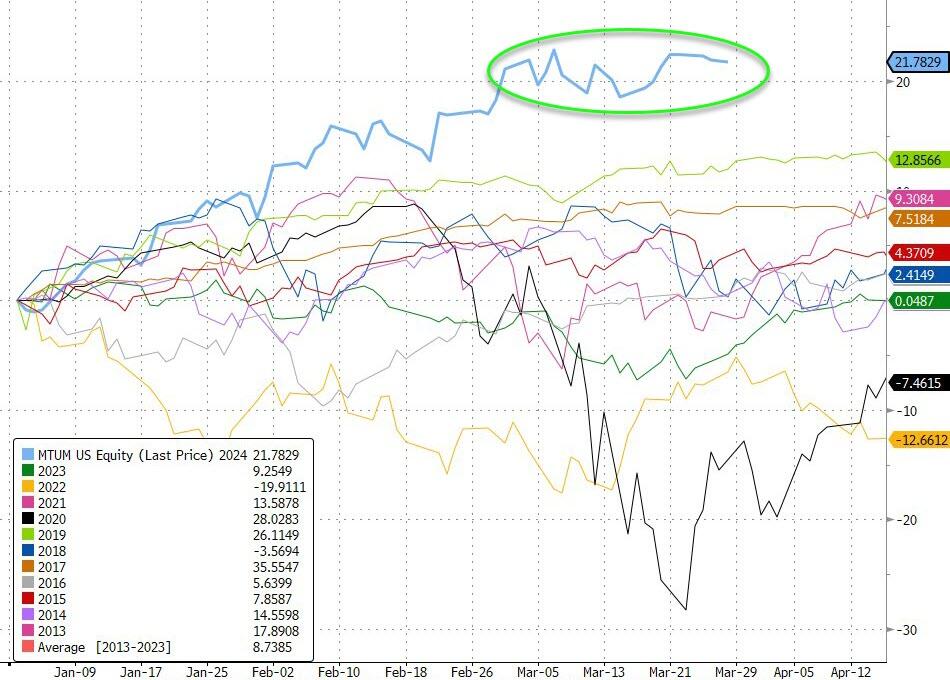
Source: Bloomberg
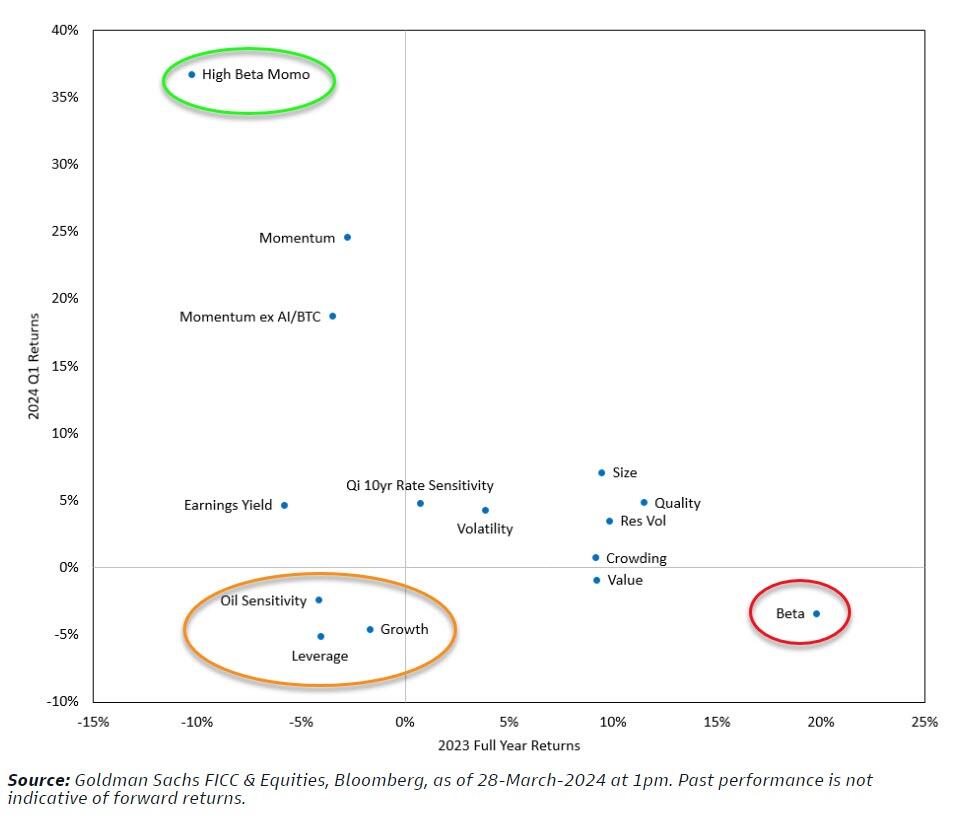
In fact, as Goldman shows in the chart below, High Beta Momo - the big Q1 outperformer - reversed its laggard performance in 2023...
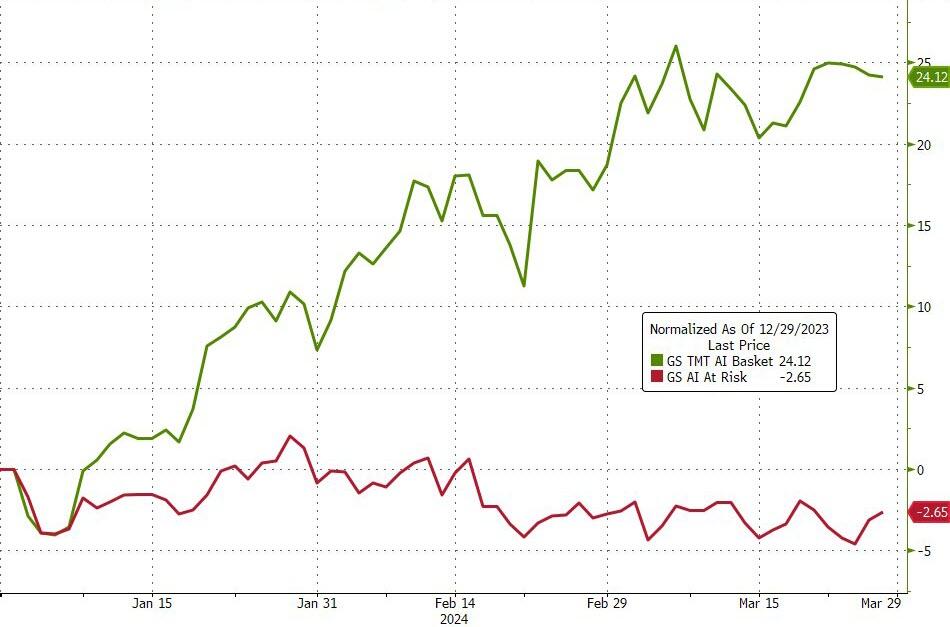
Thematically, Bitcoin-Sensitive stocks, AI stocks, and anti-obesity drug stocks all outperformed in Q1, continuing the trend of 2023 gains...
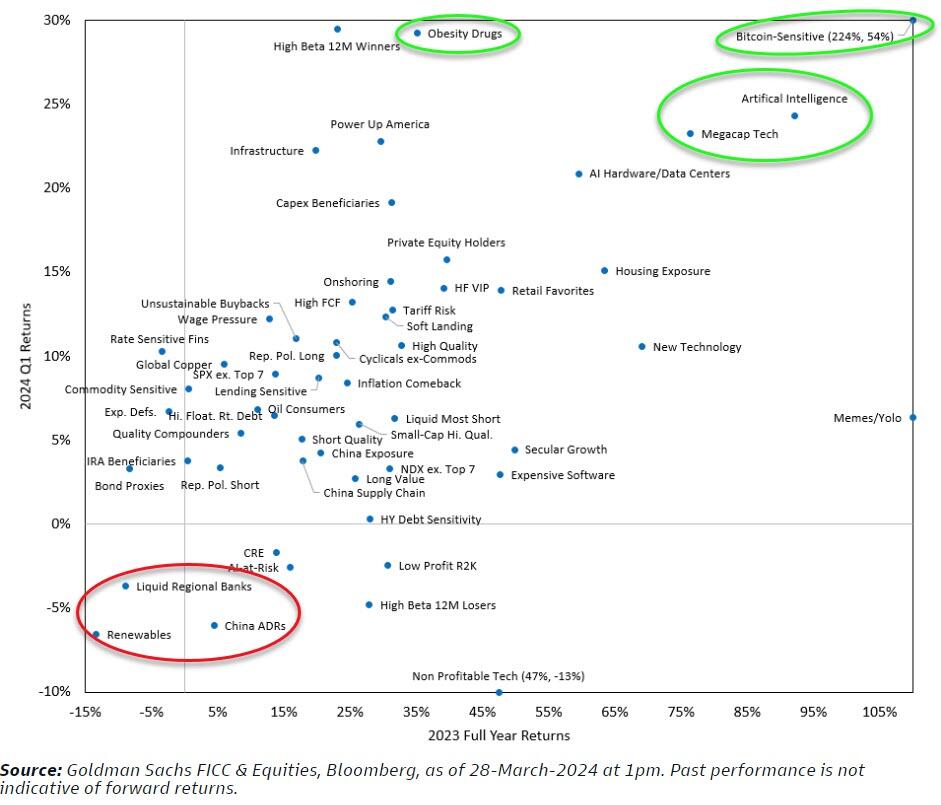
AI-related stocks soared 24% in Q1 while stocks at risk from AI fell around 3% in Q1...
Source: Bloomberg
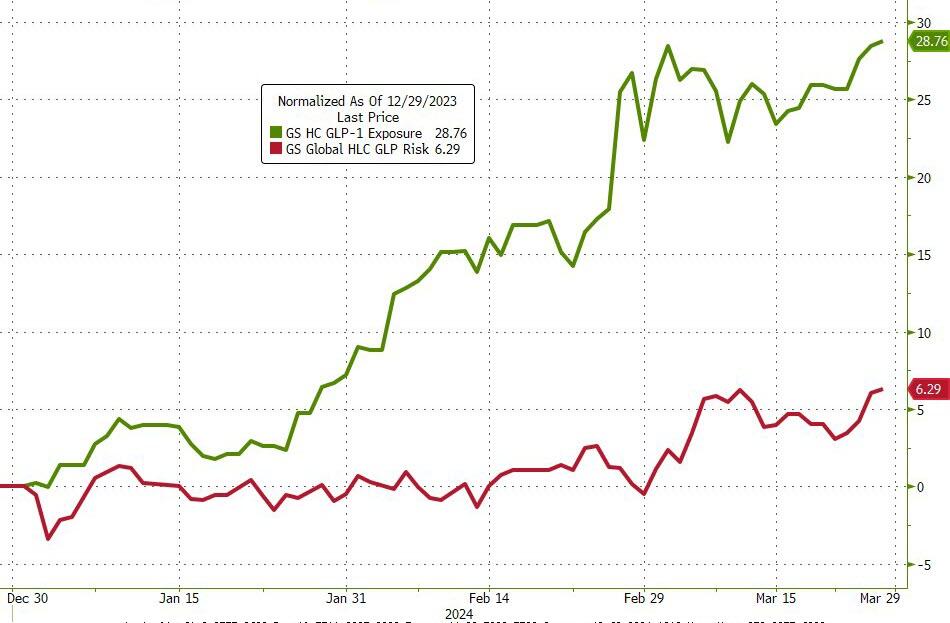
Anti-Obesity stocks soared in Q1, actually outperforming AI stocks and even GLP-1-at-risk stocks (e.g. WW) managed gains in Q1...
Source: Bloomberg
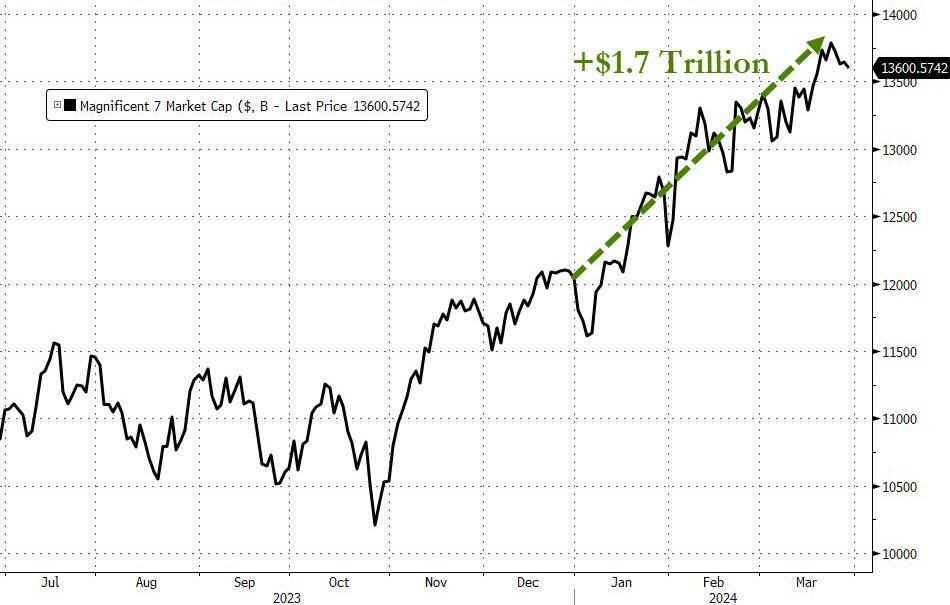
'Magnificent 7' stocks added a stunning $1.7 trillion in market cap in Q1...
Source: Bloomberg
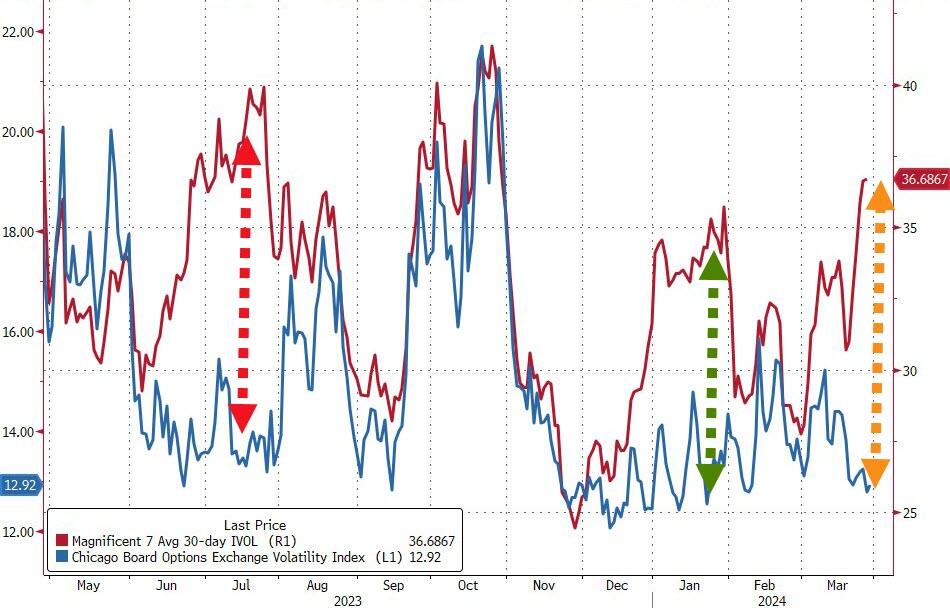
Notably, the implied vol of the Mag7 is once again very elevated relative to the implied vol of the S&P 500. In July of last year, this signaled a big reversal (demand for hedges). In Jan of this year, it was a signal of chasers buying levered bets on the upside. What does it mean this time?
Source: Bloomberg
The strength in stocks and credit has dominated any rise in yields and crushed financial conditions to their loosest since before The Fed started their rate-hiking cycle...
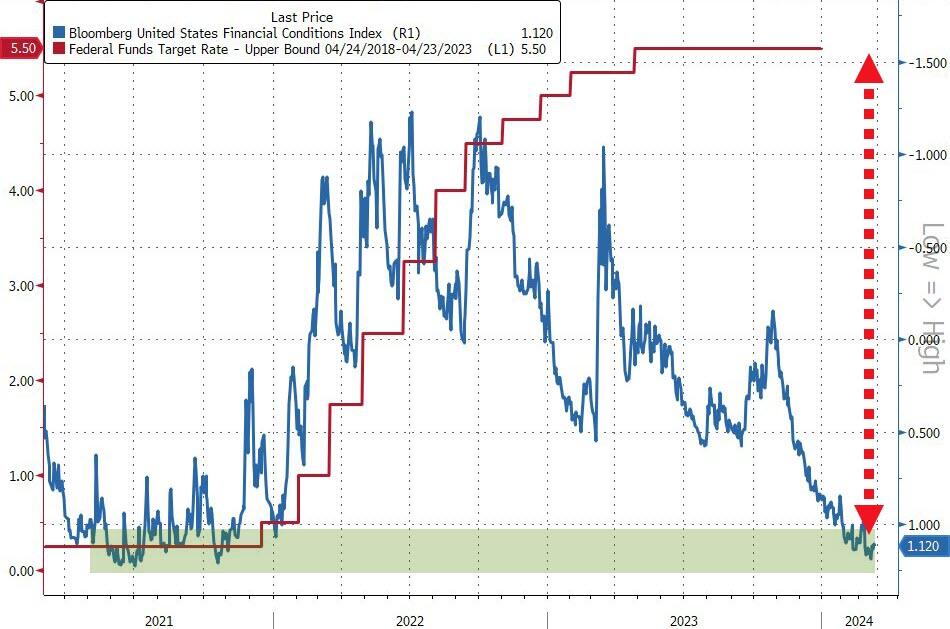
Source: Bloomberg
US Treasuries were dumped in Q1 as rate-cut expectations plunged with the short-end modestly underperforming...
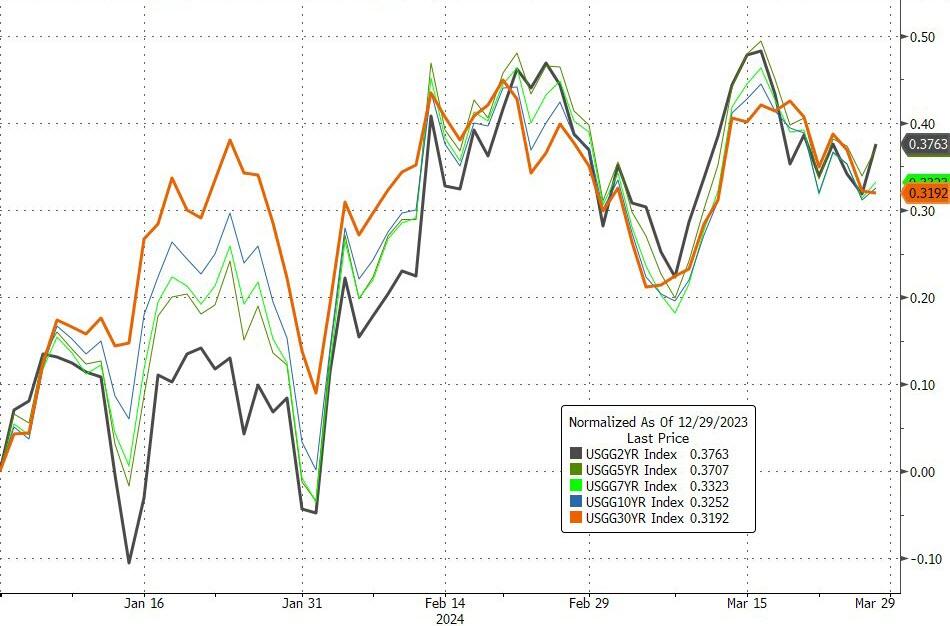
Source: Bloomberg
And while survey-based inflation expectations (UMich) are sliding, the market's expectation for inflation is anything but...
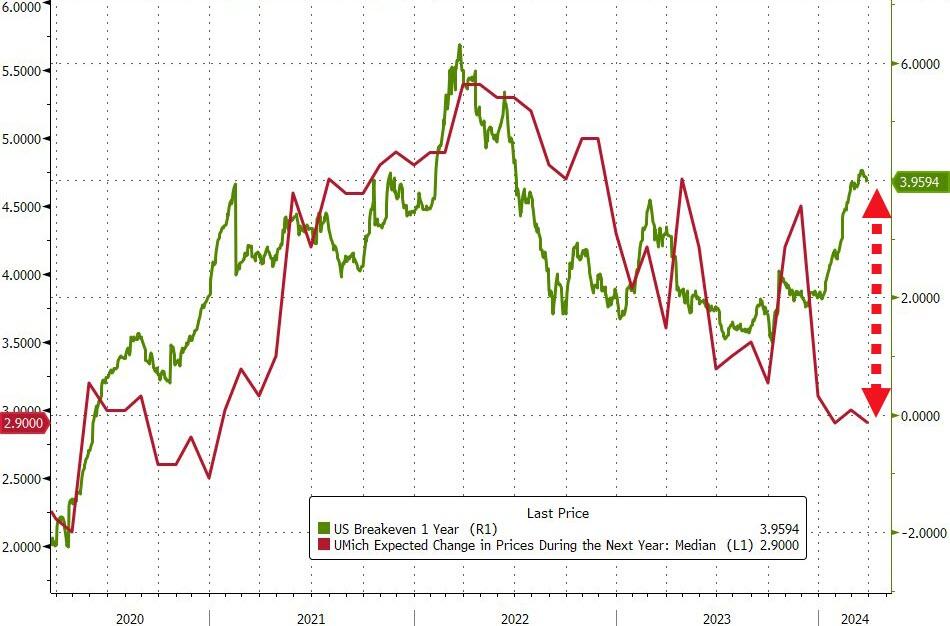
Source: Bloomberg
The dollar rallied in Q1, erasing around half of the Q4 losses...
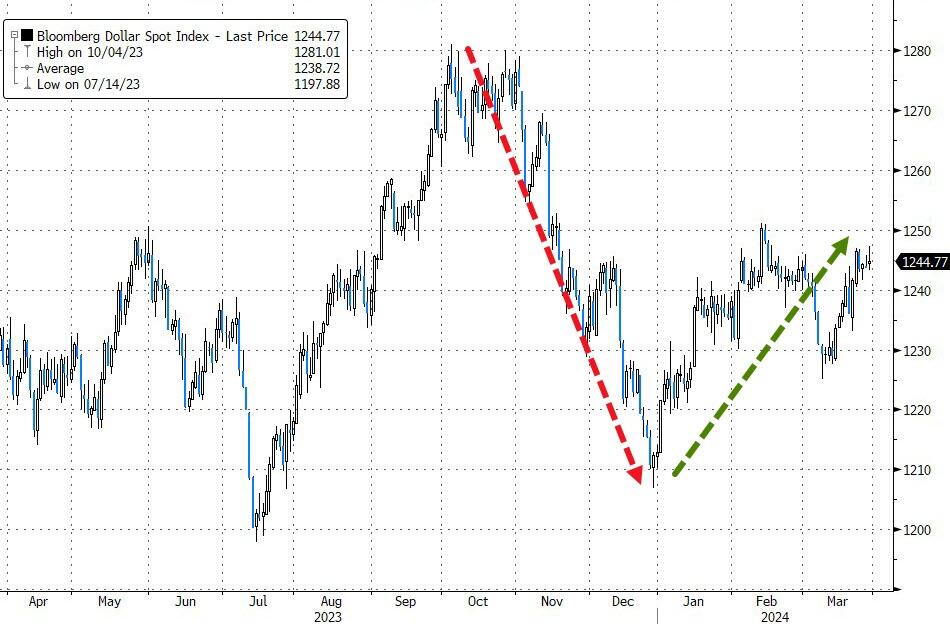
Source: Bloomberg
The dollar's strength was supported by yen weakness as the Japanese currency plunged to its weakest since 1990...
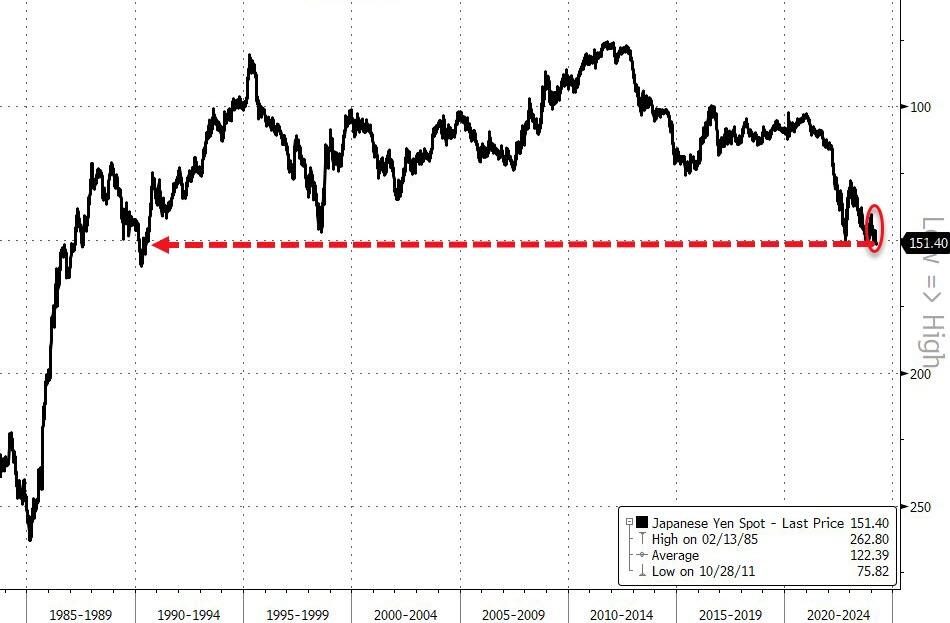
Source: Bloomberg
Not to be outdone, the yuan also tumbled in Q1...
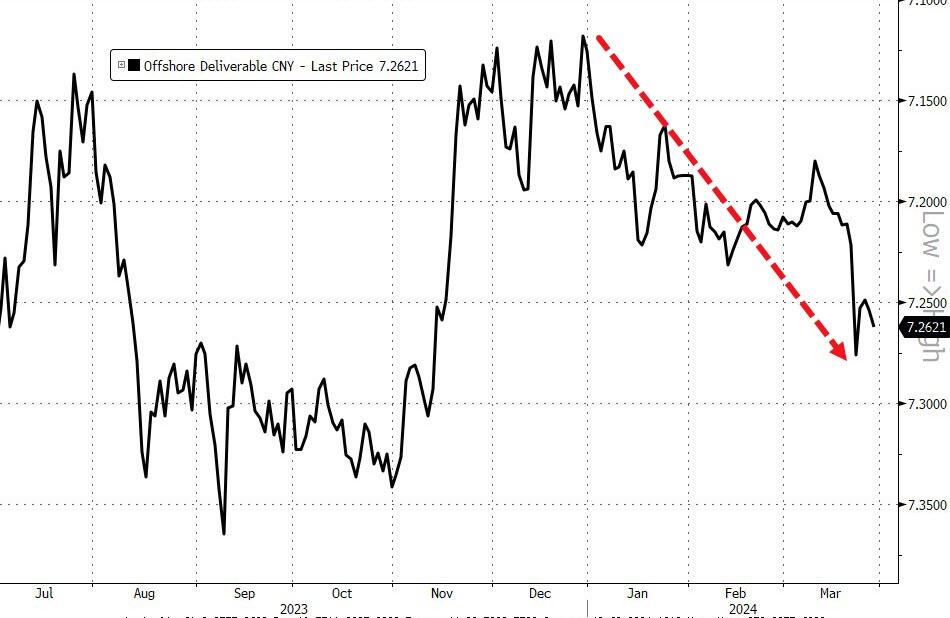
Source: Bloomberg
Q1 was dominated by bitcoin headlines - as the newly minted ETFs saw unprecedented inflows...
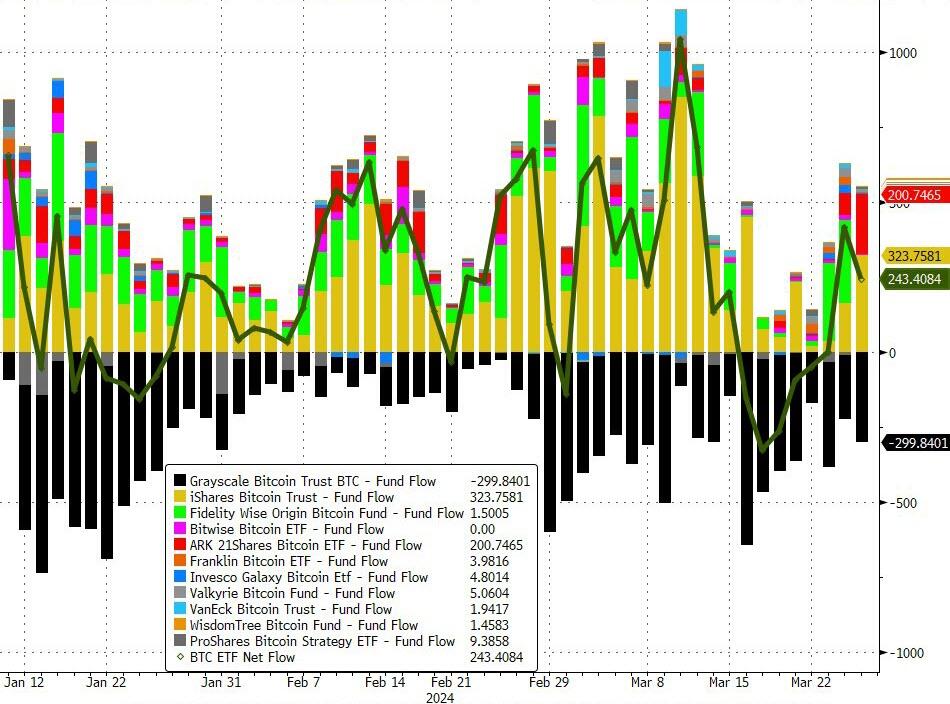
Source: Bloomberg
Which helped push Bitcoin to a new record high (in USD)...
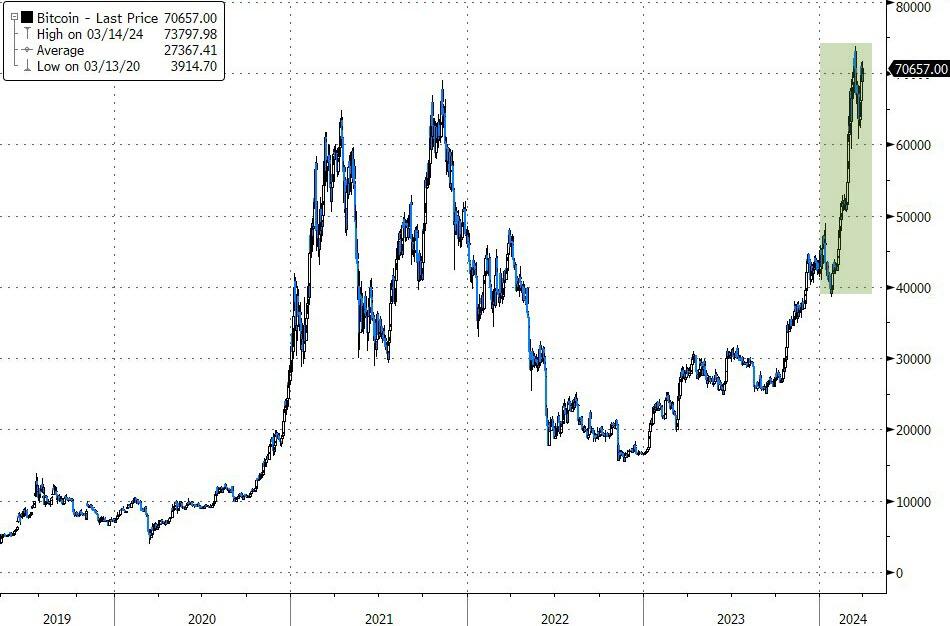
Source: Bloomberg
Ethereum also soared in Q1 (up 55%) but Solana outperformed...
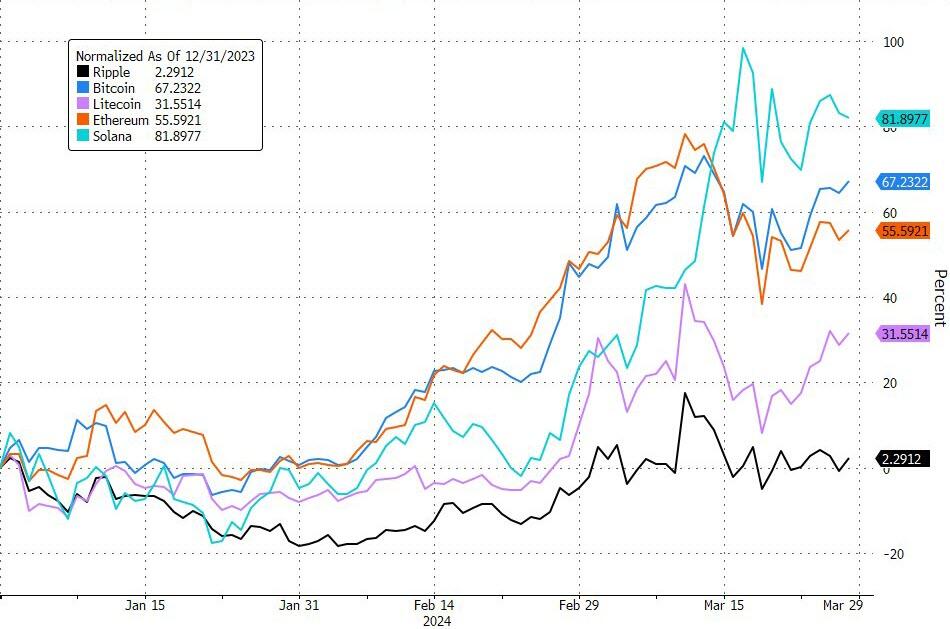
Source: Bloomberg
Another alternate currency - gold - also soared to a new record high in Q1...
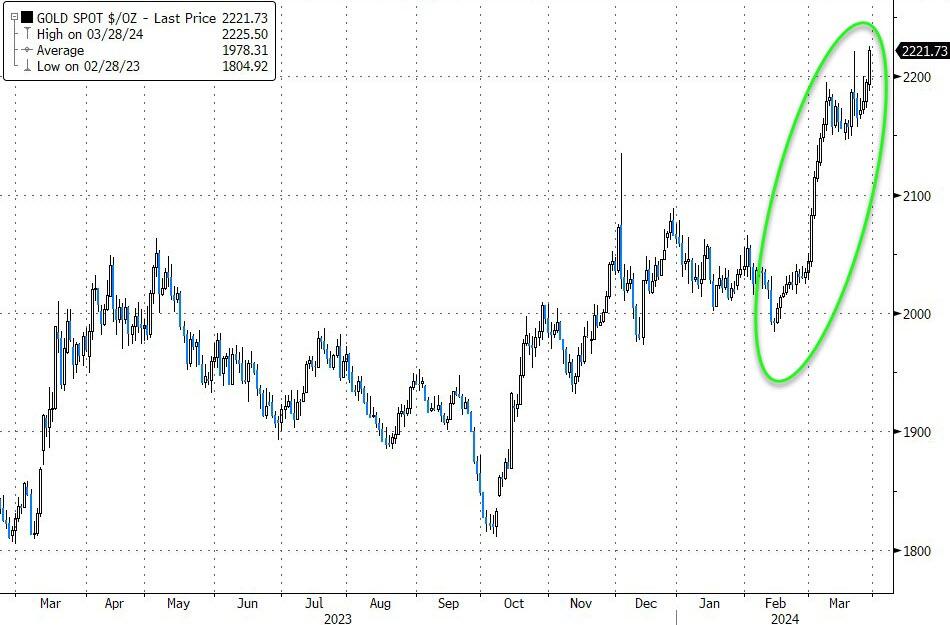
Source: Bloomberg
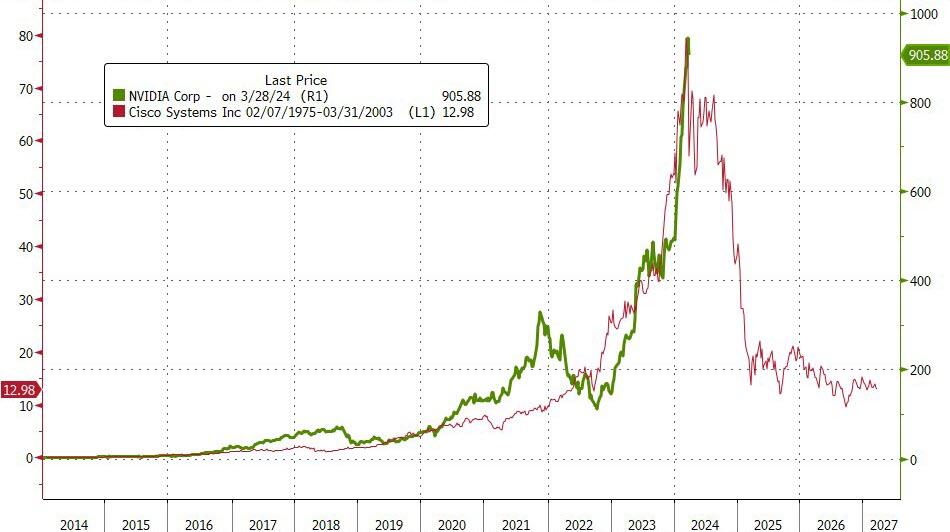
And just when you thought NVDA was the big winner, Cocoa hyperinflates in Q1, up 135% YTD!
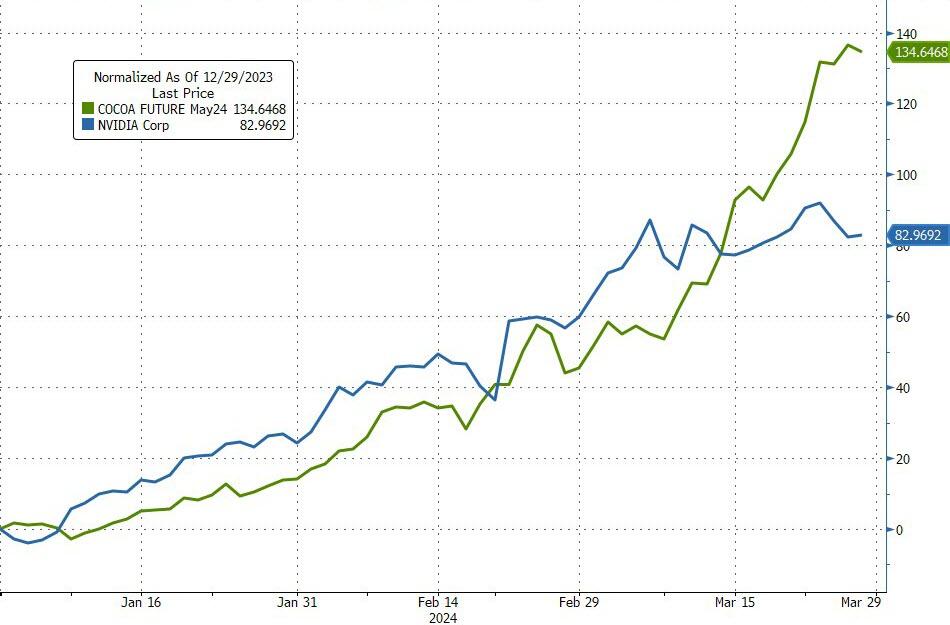
Source: Bloomberg
Oil, wholesale gasoline, and pump-prices all ripped higher in Q1 (especially March)...
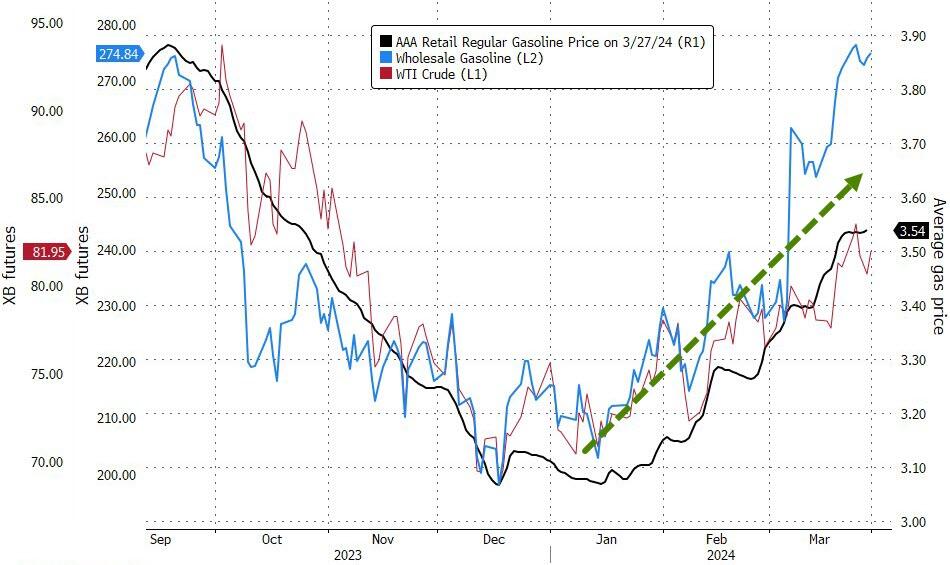
Source: Bloomberg
Finally, as Goldman's Chris Hussey notes, it's times like these – when 'everything is awesome' – when it is best to assess the risks that swirl around the investment landscape. Here are a few to consider:
-
A strong economic landing becomes a hard landing;
-
Inflation is sticky, not transitory, and the Fed pushes back;
-
The pandemic stimulus surge turns out not to be 'cost-less';
-
Concentration raises 'key company' risk;
-
Elections and geo-political risks.
And as a reminder, we've seen these 'everything is awesome' moments before...
Source: Bloomberg
And they never end well.
Uncategorized
The divided state of Australia’s property market
In this week’s video insight, I explore the divided state of Australia’s property market, highlighted by the latest Australian Bureau of Statistics…
Share this:


In this week’s video insight, I explore the divided state of Australia’s property market, highlighted by the latest Australian Bureau of Statistics (ABS) figures. With new home lending showing an unexpected decline, the market seems to be at a crossroads between tightening credit conditions and rising investor interest.
Transcript:
Depending on how you read the stats, the property market is going very well indeed… or not very well at all.
As you can see on this first chart, Australian Bureau of Statistics (ABS) figures released in the last week or so reveal new home lending fell 3.9 per cent in January from December, contrasting with analyst expectations for an increase and suggesting the screws are sufficiently tight to put a lid on house price gains this year.
Those ABS stats revealed that the value of new home loan commitments fell to $25.1 billion from $26.1 billion in December. This was the second consecutive monthly contraction among first-time home buyers, older owner-occupiers, and even investors.
New home lending obviously leads to purchases and turnover. A drop in lending today means a drop in buyers buying later.
But not everyone is feeling down. Certainly not real estate agents – are they ever? They’re promoting a different picture revealed by the ABS data release. Looking at December rather than January ABS data, they note lending to property investors reached a six-year high as a share of total home lending.
According to the ABS, 36 per cent of all housing finance in December went to investors. This is the highest level since 2017 and way up from the circa 23 per cent share held in the COVID-19 slump of 2020.
While some real estate agents believe we are off to the races again, including one Sydney Lower North Shore agent who told clients, “… it’s game on, folks!” the reality is that while investor share is back up to 36 per cent, it was more than 40 per cent in early 2017 and over 45 per cent in 2015.
The fact remains that while the share of investor loans has increased, the pie itself is shrinking.
The ABS’s most recent data reveals that both total loan ‘volumes’ and ‘values’ declined.
New loan commitments to property investors fell 2.6 per cent from December to $9.2 billion, and over the 12 months to January, the $105.2 billion in new loan commitments to investor buyers was down 8.1 per cent from the same period a year earlier.
Typically, this should result in the brakes being put on house price increases. Remember, the single biggest driver of property prices is simply ‘access to credit’. If fewer people are accessing credit, pricing tends not to soar.
As can be seen in this chart from PropTrack (which, by the way, is not tracking house prices, but the rate of change of house prices over time), house prices are still rising on an annual basis, but with the exception of Canberra and Adelaide, the pace of increase has steadied or is declining slightly. This also happens to be consistent with recent transaction volume and auction clearance data.
It is simply the case that the slower rates of home price increases reflect the restrained mortgage activity trends.
It is, however, also the case that investors are now driving a larger share of lending activity. And that might have something to do with all those tight rental market stories we’ve been hearing about.
Sharp rental increases reported by tenants through the media will influence buyers to invest and attract them into the market.
Meanwhile, according to CoreLogic, residential vendors averaged $310,000 in gross profits during the December quarter, which was 6.9 per cent higher than the previous three months.
It seems to me we have entered a bit of a holding pattern. Property owners and Investors will look forward to interest rate cuts, which, unfortunately, could push house prices even further out of reach for many.
real estate covid-19Uncategorized
Profits Are Still Rising, Why Is the Fed Worried About Wage Growth?
I was more than a bit surprised to see the profit data this morning. I really did believe that the profit surge during the pandemic was a one-off, associated…
Share this:

I was more than a bit surprised to see the profit data this morning. I really did believe that the profit surge during the pandemic was a one-off, associated with supply-chain issues.
We can argue about how much of this increase was a predictable story, where profits rise due to shortages, and how much was about companies exploiting market power to jack up prices, but the fact that profit shares increased is not disputable. In any case, it was reasonable to expect that profits would return to their pre-pandemic shares after supply chains returned to normal.
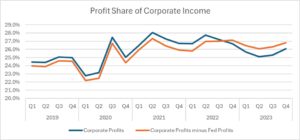
That doesn’t look like what is happening, as shown below.
Source: BEA and author’s calculations, see text.
The profit share of corporate income rose to 26.8 percent in the fourth quarter from 26.3 percent in the third quarter. That is down only 0.5 percentage points from its pandemic peak of 27.3 percent in the second quarter of 2021 and well above the 24.3 percent average for 2019.[1]
This rise in profit shares really should have the Fed rethinking its inflation-fighting strategy. It is certainly true that the 6.0 percent rate of wage growth at the end of 2021 and start of 2022 was inconsistent with the Fed’s 2.0 percent inflation target. However, the current rate of roughly 4.0 percent is obviously consistent with the Fed’s target, if it is allowing companies to increase their profit share. This implies that we should actually want to see a somewhat more rapid pace of wage growth, unless we think profit shares need to be increasing indefinitely.
There are a couple of important qualifications here. First, we saw extraordinary productivity growth in 2023. Clearly corporations were the main beneficiaries of this growth. If this uptick was an aberration and we revert to something closer to the pre-pandemic growth rate, then profit shares may not continue to rise with a 4.0 percent pace of wage growth and could even edge back somewhat.
The other big qualification is that there is a large and unusual discrepancy between GDP measured on the income side and GDP measured on the output side. In principle these sums should be identical, but in a $28 trillion economy, they never come out exactly the same.
In recent decades, the income side has generally been about 0.5 percentage points higher than the output side. In the fourth quarter, the income side was 2.0 percentage points lower. We usually assume that the true figure lies somewhere between the two measures.
This would imply that the true sum of wages and profits is 1.0 to 2.0 percentage points higher than what is now reported. If that gap ends up being disproportionately wages or profits it could change the picture somewhat, but even if the full 2.0 percentage points all ended up being wage income it would not change the fact that the profit share is still far above its pre-pandemic level.
The upshot is that it really is time for the Fed to declare “Mission Accomplished” and take its foot off the brake. If profit shares are rising, there is no reason for it to be trying to slow wage growth.
[1] These figures take Line 8 (net operating surplus) from NIPA Table 1.14, minus Line 11 (Federal Reserve Bank profits) from Table 6.16D divided by Line 8 plus Line 4 (labor compensation) from Table 1.14.
The post Profits Are Still Rising, Why Is the Fed Worried About Wage Growth? appeared first on Center for Economic and Policy Research.
fed federal reserve pandemic gdpUncategorized
Home Depot agrees to make its largest acquisition ever
The more than $18 billion deal is a massive bet on growing a key base.
Share this:


One of the silver linings of the past several years has been having a little extra time on our hands.
During the lockdowns of the early 2020s, many of us were under stay-at-home or shelter-in-place orders, which gave us time to look around the house and face the projects we'd been putting off.
Related: Sephora is suddenly abandoning a major market
And thanks to a shortage of labor and a gummed-up supply chain, hiring professional contractors was harder to come by. So many Americans tried their hand at doing projects themselves.
Perhaps they were minor projects, like adding a fresh coat of paint to the powder room or changing out the hardware on the kitchen cabinets. But many folks went far deeper into the DIY space, replacing flooring, adding new decks to their outdoor spaces, or doing an entire kitchen remodel.
Part of what made this process so accessible was the stimulus checks that went out to millions of Americans, so they had a little extra spending cash for these projects. Another was the proximity and convenience of home-improvement stores like Home Depot (HD) .
With more than 2,300 stores across the U.S., Home Depot saw extreme growth during the pandemic. After the pandemic waned, the housing market boomed and professional labor got back to work, though. And the chain benefited from this surge, too. Home Depot's stock has about doubled since the early 2020s.
Home Depot focuses on a growing base
A robust consumer base is great when times are good, but when inflation hits and individuals look to ease up on their expenses, a company can be more exposed to downside risk, like dwindling sales.
This is partly why Home Depot has made a concerted effort in recent quarters to pivot its focus to professionals. Contractors, home improvement professionals, businesses, remodelers and designers have always been a part of Home Depot's core business, but they tend to be less cyclical than individual customers and tend to contribute more routine business.
In March, Home Depot announced it would be opening up distribution centers across several key areas in the U.S. specifically for home improvement professionals.
These centers are to focus more on bigger projects and will be about five times larger than the average Home Depot store, making it easier for professionals to navigate the centers and pick up more supplies.
And on Thursday, Home Depot said it was making its largest acquisition yet to further its foothold in the contracting arena.
Home Depot agreed to acquire SRS Distribution of McKinney, Texas, for $18.25 billion. SRS Distribution provides goods and materials for home-improvement contractors, like landscaping tools, roofing supplies, lumber, and pool materials.
SRS Distribution employs about 11,000 people and operates 760 branches across 47 states. The acquisition is expected to close in January 2025.
“Growing our share of wallet with the pro will fuel Home Depot’s next great growth chapter. SRS will help us better sell the whole project and capture a new customer we haven’t traditionally served,” a Home Depot spokesperson said.
Home Depot's Q4 sales were down 3% from a year earlier as individual shoppers pulled back on their expenses, so focusing on a steadier growth trajectory is likely to bolster the retailer's sales in the coming years.
"After three years of exceptional growth for our business, 2023 was a year of moderation. It was also a year of opportunity," Home Depot Chief Executive Ted Decker said on the earnings call in February.
stimulus pandemic housing market stimulus

A detailed look at manufacturing, and an update on frieght


Whiskey Rich: Luxury Liquor Trumps Stocks & Art Over Past Decade


Home Depot agrees to make its largest acquisition ever


Profits Are Still Rising, Why Is the Fed Worried About Wage Growth?


Accelerating CAR T cell therapy: Lipid nanoparticles speed up manufacturing


The divided state of Australia’s property market


Initial claims remain somnolent, while continuing claims pop slightly


COVID-19 antibody discovery could explain long COVID


Philly Fed: State Coincident Indexes Increased in 49 States in January (3-Month Basis)


Unlocking how to use mRNA to target Alzheimer’s disease
-

 Spread & Containment2 weeks ago
IFM’s Hat Trick and Reflections On Option-To-Buy M&A
-

 International6 days ago
Parexel CEO to retire; CAR-T maker AffyImmune promotes business leader to chief executive
-

 Uncategorized1 month ago
All Of The Elements Are In Place For An Economic Crisis Of Staggering Proportions
-

 International3 weeks ago
EyePoint poaches medical chief from Apellis; Sandoz CFO, longtime BioNTech exec to retire
-

 Uncategorized1 month ago
Apparel Retailer Express Moving Toward Bankruptcy
-

 International3 weeks ago
Walmart launches clever answer to Target’s new membership program
-

 Uncategorized1 month ago
Key Events This Week: All Eyes On Core PCE Amid Deluge Of Fed Speakers
-

 Uncategorized1 month ago
A Blue State Exodus: Who Can Afford To Be A Liberal