Uncategorized
A detailed look at manufacturing, and an update on frieght
– by New Deal democratAs I wrote on Monday, the big question for this year is whether the recessionary effects of the Fed rate hikes have just been…
Share this:

- by New Deal democrat
As I wrote on Monday, the big question for this year is whether the recessionary effects of the Fed rate hikes have just been delayed, or whether, because the rate hikes have stopped, so has the headwind they normally produce. Watching manufacturing and construction, especially housing construction, is what I expect to supply the answer.


Uncategorized
Argentinians Buy Bitcoin to Combat Inflation, Pass Friendly Legislation
Argentina’s plummeting economy has seen citizens turn to Bitcoin as a store of value. The legislature passes friendly laws as the pro-Bitcoin president…
Share this:


The below is an excerpt from a recent edition of Bitcoin Magazine Pro, Bitcoin Magazine's premium markets newsletter. To be among the first to receive these insights and other on-chain bitcoin market analysis straight to your inbox, subscribe now.
As the Argentine economy is racked by record inflation, its people are turning to Bitcoin as a way to protect their economic security.
The Argentine Republic is currently experiencing the worst inflation rates in the world. The nation’s economy has experienced low levels of inflation, somewhere around 25%, for decades; yet the pandemic sharpened a downward trend to devastating effect. The inflation rate hit 70% in 2022 and reached 100% the following February, but 2023 proved to be an absolutely murderous year for Argentina's economy. Inflation rates crossed the 200% point around the time that Bitcoin-friendly president Javier Milei first took office in December, and the rate currently sits at a mind-boggling 274%. With figures like this, ordinary citizens’ wages and life savings have evaporated practically overnight, and people are looking towards more radical solutions to get their lives on track.

In a particularly encouraging development, ordinary citizens are turning to Bitcoin in record numbers for its classic use-case as a store of value. Already a nation with a high rate of Bitcoin acceptance, Argentina has doubled down on the decentralized currency as the most popular local exchange reports 20-month highs in trading volume. Lemon Cash, the exchange in question, claimed that Bitcoin transactions in the first full week of March 2024 were more than double the average rate throughout 2023. Belo, another prominent exchange based in the country, reported year-to-year increases that were closer to tenfold. A particularly interesting wrinkle in the development is that Bitcoin is not only replacing dollars, but also dollar-backed stablecoins which saw trading volumes decrease by 60-70%. Belo’s CEO Manuel Beaudroit stated that “The user decides to buy Bitcoin when they see the news that the currency is going up, while stablecoin is more pragmatic and many times used for transactional purposes, as a vehicle to make payments abroad”.
Ironically, Bloomberg claims, some of President Milei’s economic positions have actually influenced the switch from the dollar to Bitcoin, but through some unexpected and indirect means. The radical libertarian has begun his administration with a series of broad-reaching reforms to try and control the situation, reducing spending and attempting to dismantle or privatize a variety of state-owned businesses. A particular goal of his administration to date has been to build a budget surplus for the federal government, for a variety of reasons: using these funds more deliberately, reaching targets based on agreements with the International Monetary Fund (IMF) and of course beginning a positive trend in Argentina’s economic statistics. A component of this surplus policy has been to build a similar reserve of American greenbacks, reducing their circulation within the country. The exchange rate of pesos to dollars took a serious hit, and the once-popular store of value became less attractive than the skyrocketing Bitcoin.
Reports from Chainalysis put some hard numbers onto these general trends: Argentina leads all of Latin America in transaction volume, and is second place overall in terms of grassroots adoption. Representatives from Lemon Cash estimated in this report that the number of Argentinians using Bitcoin or other digital currencies is around 5M, out of a population of 45M! Such impressive figures are not merely the result of a brief period of economic misfortune, but should instead be considered as a sort of tipping point: Bitcoin acceptance has been quietly growing for years, and now the crisis is providing the jump for it to become a fully mainstream fiat alternative. The rate of growth has been so prodigious that an unexpected “cousin” of the industry has even been developing, with crypto-related scam and phishing activity increasing fivefold. Clearly, the market is full of people new to Bitcoin’s chaotic ecosystem.
Relevant to the rise of unsavory activity targeting new Bitcoin users, Argentina is beginning to pass some new regulations over the industry. The Senate unanimously passed a new law in March, opening up a new set of standards that virtual asset service providers must adhere to. The standards are generally related to various consumer protection and anti-fraud precautions, with the country’s main securities agency set to enforce these new standards. The existing Bitcoin community has reacted to these new laws with consternation, fearing that this legislation will lead to market consolidation. Large operations, after all, would have the resources to comply with these new requirements immediately, while smaller startups may find themselves swamped. Still, legislators are also working on a series of tax exemptions for digital asset holders, that may hopefully help smooth over some of this animosity.
Curiously absent from these proceedings, however, is President Milei. The man espoused some pro-Bitcoin views on the campaign trail, and has a general economic philosophy that aligns with some of Bitcoin’s core fundamentals, but nevertheless he has held little public presence in many of Bitcoin’s developments. Even the incidental rise of Bitcoin fueled by his own policies have not led him to make public statements on the situation. Still, Milei has had his hands full from a far-reaching series of economic reforms and austerity policies, balancing the confidence of global markets with a concerning rise in poverty across several metrics. Milei has managed to slow the ballooning inflation somewhat, but at great cost: reduced government spending is pushing more citizens over the brink. As Reuters reported, the crisis is far from over, with sales, activity and production all on a downward slope.
In other words, it seems likely that Milei personally has Bitcoin on the back burner, as he has a much greater priority in getting the economy under control and tempering the possibility of social unrest. His general popularity is holding up despite these adversities, but a contentious issue like bitcoinization may simply be a battle he is unwilling to start. Once things calm down, we may look forward to his endorsement of Bitcoin once again, but nothing is truly certain. Still, despite his lack of direct Bitcoin-friendly initiatives, the legislature is still making positive moves in its own right. It seems very unlikely that Argentina will turn actively hostile to Bitcoin in the face of this inflation, such as with Nigeria’s crackdown amidst a lagging currency.
Ultimately, the future of Bitcoin in Argentina is up to the Bitcoiners themselves. Economic crisis has presented the community with record highs in adoption, and Bitcoin is well past a household name. Will this trend continue as the economy recovers? Will a fledgling community of Bitcoin-related businesses and developers end up transformed into a dynamic and profitable industry? There are too many variables to say for certain. Nevertheless, Bitcoin is a chaotic market that was itself founded in the wake of the United States’ own economic woes of the 2008 collapse. The worldwide community has displayed an innovative and enterprising spirit that can lead to success in even the most marginal situations. Bitcoin has been on the rise globally, in other words, and there’s no reason to doubt that it won’t keep rising in Argentina too.
bitcoin pandemic currencies cryptoUncategorized
Long Volatility Trade May Be A Widow-Maker No More
Long Volatility Trade May Be A Widow-Maker No More
Authored by Simon White, Bloomberg macro strategist,
An unusual combination of divergences…
Share this:


Authored by Simon White, Bloomberg macro strategist,
An unusual combination of divergences in the stock-market volatility space suggests the VIX is at elevated risk of pricing higher, and this may even happen with rising rather than falling equity prices. Volatility of volatility is near 10-year lows making call options on the VIX cheap.
Buying the VIX is the quintessential widow-maker trade. It is rare for the gauge to rise, with most of such instances over the last 20 years episodic and occurring when the market was falling. Most of the time, the market rises and volatility falls - there is an entire sub-industry devoted to exploiting and perpetuating this, which has swollen further in size in recent years with the boom in zero-days-to-expiry (0DTE) trading.
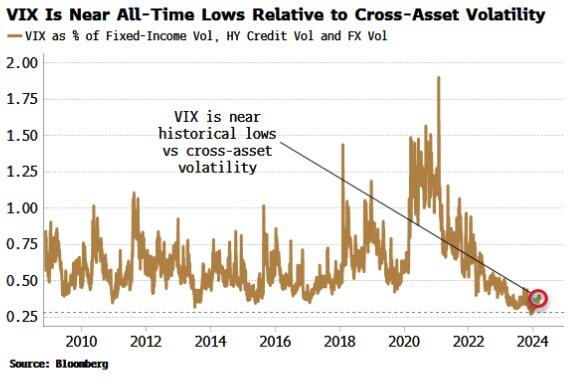
Not only is the VIX near its post-pandemic lows, it has also never been more out of step with cross-asset volatility – FX, fixed-income and credit (which is saying something as FX and credit vol are themselves near historic lows).
Markets are interlinked: rates impact stock valuations, high-yield credit sits just above equity in the capital structure, and so on. The question is how long can equity volatility remain the relative outlier?
There’s always a risk of becoming the next widow, but there are enough factors in play to suggest a heightened risk of a rise in the VIX.
Three trends suggest that a turning point in equity volatility is near:
-
Divergence between the VIX and skew structure;
-
Implied and realized correlation nearing their effective lower bound; and
-
Stresses in state-by-state US unemployment.
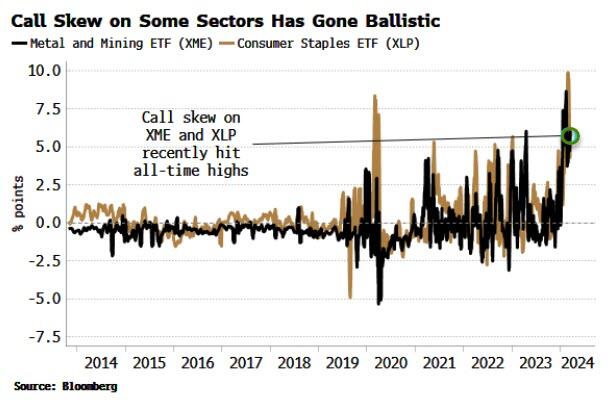
The market has become increasingly bullish in recent months, especially so after making new highs. That’s led to leveraged market chasing – call buying – and reduced hedging activity, i.e. less put buying. The rally chasing spurred some truly epic moves in the call skew of certain sectors. The metals and mining and staples sectors saw the biggest rises in their call skews, with both hitting series highs.
However, since 2020, it’s the relationship between call and put skew that’s tracked the VIX almost perfectly, with the index typically falling when call skew is outpacing put skew. In other words, when there is more leveraged activity in calls relative to puts, the VIX tends to be repressed (the VIX is a weighted-average of implied volatility in the S&P across all strikes).
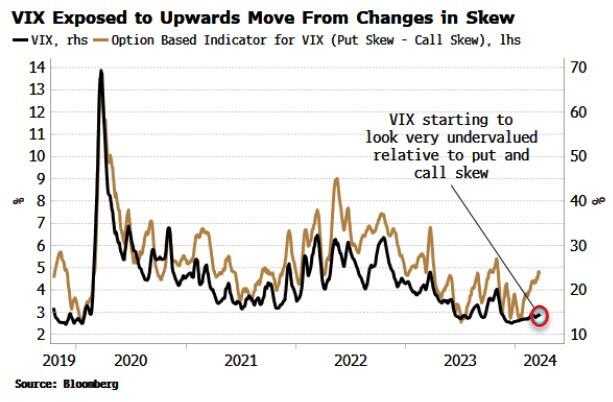
Now, though, put skew is outperforming call skew. As the chart above shows, that typically coincides with a rising VIX.
At the same time, the realized and implied correlation of the S&P is very depressed. Realized correlation is close to going below 10%, a level it rarely breaches, and when it does it is typically followed by a sharp move higher. Moreover, implied correlation - so called as it is implied from the Markowitz portfolio model - has never been lower.
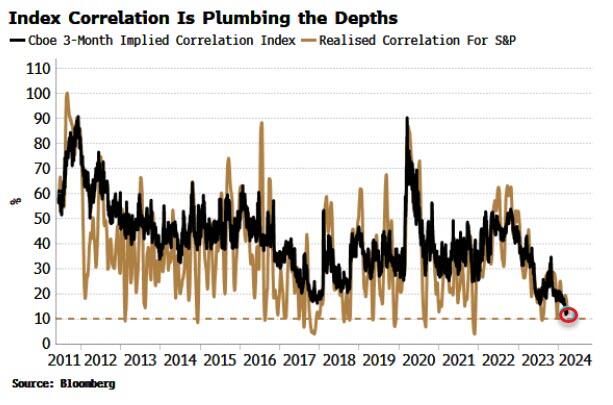
Correlation is being driven lower by the dominance of the largest stocks and by dispersion selling. The latter involves selling volatility on the index versus buying vol on individual stocks. As the Magnificent Seven - or whatever your favored cohort of AI-related stocks is - drive higher, the dispersion selling has the effect of pinning the index. The biggest stocks go up, while the rest are impaired by how much they can move, pushing correlation down.
In theory, index correlation could go negative, but it has never happened. The reason is that stocks are not completely random and are driven by common macro-based factors, such as interest rates. Correlation is thus so low today that it can only really go one way, and when it does, history shows the move is likely to be abrupt. Something has to give.
It’s not only the market sounding a warning about stock-market vol, but the economy too. A fairly reliable indication of rising equity volatility has been when we see a number of US states experiencing stress in their employment markets at the same time.
The chart below shows the percentage of US states whose unemployment rate is higher over the past year. As we can see, while increases in equity vol don’t always coincide with rising state unemployment, almost all the spikes higher in the percentage of states experiencing worsening unemployment coincide with episodes of higher VIX.
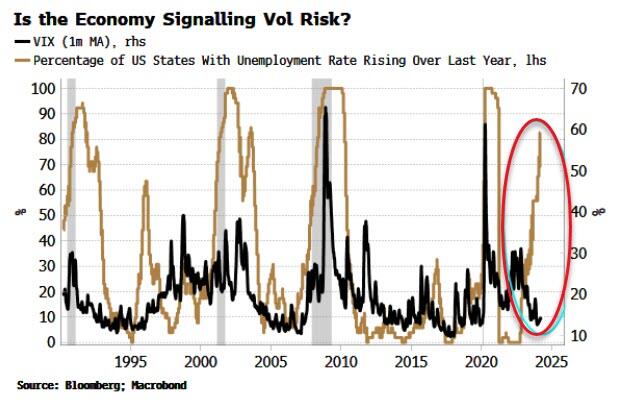
Today is - so far, along with the mid 1990s - an outlier, with more than half of US states seeing rising unemployment while the VIX remains near its lows.
There is a proviso here. The household survey, from which the unemployment rate is derived, may be under-reporting employment growth due to underestimating immigration. A recent Brookings paper suggests that the household survey is using too low an estimate for the civilian population, which could well explain its divergence from the establishment survey (payrolls). It might also bias state unemployment rates too high if estimates of the size of the workforce are too low.
Nonetheless, this measure bears close scrutiny, especially in confluence with the endogenous market-based signs of higher equity vol mentioned above.
Being long volatility is rarely comfortable. Given the structure of the market, the path of least resistance is down. This also means the volatility curve is typically steep – as it is today – meaning an investor wears negative carry to hold the position. One way to mitigate this is through call options on the VIX. These are relatively cheap, with the VVIX – the vol of vol – near 10-year lows.
The reflex is to expect higher equity vol to come with lower stock prices. But the two had a positive correlation for much of the second half of the 1990s. The current backdrop of still-supportive liquidity, a non-recessionary economy and investor call buying could lead to a situation of rising volatility and higher equity prices. That might make long volatility trades a less likely money-losing proposition.
Uncategorized
Repeat home sales price declined slightly in January; expect deceleration in the CPI measures of shelter to continue
– by New Deal democratAs I noted again yesterday, house prices lag home sales, which in turn lag mortgage rates. Yesterday we got the final February…
Share this:

- by New Deal democrat
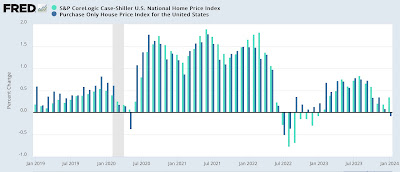
As I noted again yesterday, house prices lag home sales, which in turn lag mortgage rates. Yesterday we got the final February reading on sales. This morning we got the final January read on prices, for repeat sales of existing homes.
Last week’s report on existing home sales showed a sharp increase in February, a repeat of the seasonally adjusted sharp increase last February, which was almost completely taken back over the next two months. YoY sales remained down by over 3%, but the median price of an existing home remained higher by 5.7% - very much *unlike* new homes, where sales have firmed, but price remain almost 20% down from their peak.


Long Volatility Trade May Be A Widow-Maker No More


Argentinians Buy Bitcoin to Combat Inflation, Pass Friendly Legislation


Repeat home sales price declined slightly in January; expect deceleration in the CPI measures of shelter to continue


Not having job flexibility or security can leave workers feeling depressed, anxious and hopeless


A detailed look at manufacturing, and an update on frieght


AstraZeneca advances Fasenra’s marketing with new campaign that’s on TikTok for first time


As mortgage rates remain rangebound, so do new home sales


Common household chemicals pose new threat to brain health


Measuring Fed Inflation Credibility
-

 Spread & Containment2 weeks ago
IFM’s Hat Trick and Reflections On Option-To-Buy M&A
-

 Uncategorized1 month ago
All Of The Elements Are In Place For An Economic Crisis Of Staggering Proportions
-

 International3 weeks ago
EyePoint poaches medical chief from Apellis; Sandoz CFO, longtime BioNTech exec to retire
-

 International5 days ago
Parexel CEO to retire; CAR-T maker AffyImmune promotes business leader to chief executive
-

 Uncategorized1 month ago
Apparel Retailer Express Moving Toward Bankruptcy
-

 International3 weeks ago
Walmart launches clever answer to Target’s new membership program
-

 Uncategorized1 month ago
Key Events This Week: All Eyes On Core PCE Amid Deluge Of Fed Speakers
-

 Uncategorized1 month ago
A Blue State Exodus: Who Can Afford To Be A Liberal