Connect with us

Uncategorized

Measuring Fed Inflation Credibility

What do households (not economists) think inflation will be in three years? I use the deviation of forecast from target as a proxy measure for credibility…

Published

on

What do households (not economists) think inflation will be in three years? I use the deviation of forecast from target as a proxy measure for credibility regarding inflation.

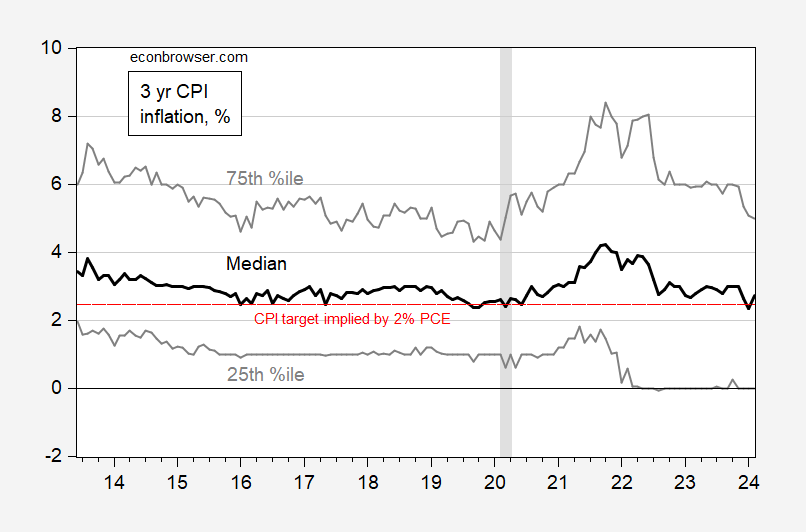
Figure 1: Median 3 year CPI inflation forecast (black), 25th, 75th percentile (gray), in %. CPI inflation consistent with 2% PCE inflation target (red dashed line). NBER defined peak-to-trough recession dates shaded gray. Source: NY Fed, NBER, and author’s calculations.

As of February 2024, the inflation rate expected 3 years out is lower than it was in January 2021. While expected CPI inflation has declined, dispersion of forecasts has increased slightly.

Figure 2: Median 3 year CPI inflation forecast deviation from  CPI inflation consistent with 2% PCE inflation target (black), interquartile range (sky bule), in %.. NBER defined peak-to-trough recession dates shaded gray. Source: NY Fed, NBER, and author’s calculations.

Maximal uncertainty, as measured by the interquartile range in 3 year inflation was reached in mid-2022. It’s now dropped to to rates last seen at the exit from the pandemic-induced recession.

Note that some have questioned the use of the earlier framework,  pre-New Monetary Strategy laid out in August 2020 (see here for one reader’s critique). I’ll note that as far as I can tell, market commentators are still using the target in the old sense of the word (a sense that seems buttressed by Papell and Prodan-Boul’s recent examination of the various vintages of the SEP), rather than FAIT with, say, a 3 year window, as that would imply we should be seeing an implied target rate of deflation at about 0.8% per annum.


Read More

Continue Reading

Uncategorized

Common household chemicals pose new threat to brain health

CLEVELAND—A team of researchers from the Case Western Reserve University School of Medicine has provided fresh insight into the dangers some common…

Published

on

CLEVELAND—A team of researchers from the Case Western Reserve University School of Medicine has provided fresh insight into the dangers some common household chemicals pose to brain health. They suggest that chemicals found in a wide range of items, from furniture to hair products, may be linked to neurological diseases like multiple sclerosis and autism spectrum disorders.

Credit: Case Western Reserve University

CLEVELAND—A team of researchers from the Case Western Reserve University School of Medicine has provided fresh insight into the dangers some common household chemicals pose to brain health. They suggest that chemicals found in a wide range of items, from furniture to hair products, may be linked to neurological diseases like multiple sclerosis and autism spectrum disorders.

Neurological problems impact millions of people, but only a fraction of cases can be attributed to genetics alone, indicating that unknown environmental factors are important contributors to neurological disease.

The new study published today in the journal Nature Neuroscience, discovered that some common home chemicals specifically affect the brain’s oligodendrocytes, a specialized cell type that generates the protective insulation around nerve cells.

“Loss of oligodendrocytes underlies multiple sclerosis and other neurological diseases,” said the study’s principal investigator, Paul Tesar, the Dr. Donald and Ruth Weber Goodman Professor of Innovative Therapeutics and director of the Institute for Glial Sciences at the School of Medicine. “We now show that specific chemicals in consumer products can directly harm oligodendrocytes, representing a previously unrecognized risk factor for neurological disease.” 

On the premise that not enough thorough research has been done on the impact of chemicals on brain health, the researchers analyzed over 1,800 chemicals that may be exposed to humans. They identified chemicals that selectively damaged oligodendrocytes belong to two classes: organophosphate flame retardants and quaternary ammonium compounds. Since quaternary ammonium compounds are present in many personal-care products and disinfectants, which are being used more frequently since the COVID-19 pandemic began, humans are regularly exposed to these chemicals. And many electronics and furniture include organophosphate flame retardants.

The researchers used cellular and organoid systems in the laboratory to show that quaternary ammonium compounds cause oligodendrocytes to die, while organophosphate flame retardants prevented the maturation of oligodendrocytes. 

They demonstrated how the same chemicals damage oligodendrocytes in the developing brains of mice. The researchers also linked exposure to one of the chemicals to poor neurological outcomes in children nationally.

“We found that oligodendrocytes—but not other brain cells—are surprisingly vulnerable to quaternary ammonium compounds and organophosphate flame retardants,” said Erin Cohn, lead author and graduate student in the School of Medicine’s Medical Scientist Training Program. “Understanding human exposure to these chemicals may help explain a missing link in how some neurological diseases arise.” 

The association between human exposure to these chemicals and effects on brain health requires further investigation, the experts warned. Future research must track the chemical levels in the brains of adults and children to determine the amount and length of exposure needed to cause or worsen disease.

“Our findings suggest that more comprehensive scrutiny of the impacts of these common household chemicals on brain health is necessary,” Tesar said. “We hope our work will contribute to informed decisions regarding regulatory measures or behavioral interventions to minimize chemical exposure and protect human health.”

Additional contributing researchers from Case Western Reserve School of Medicine and from the U.S. Environmental Protection Agency included Benjamin Clayton, Mayur Madhavan, Kristin Lee, Sara Yacoub, Yuriy Fedorov, Marissa Scavuzzo, Katie Paul Friedman and Timothy Shafer. 

The research was supported by grants from the National Institutes of Health, National Multiple Sclerosis Society, Howard Hughes Medical Institute and New York Stem Cell Foundation, and philanthropic support by sTF5 Care and the Long, Walter, Peterson, Goodman and Geller families.

###

Case Western Reserve University is one of the country’s leading private research institutions. Located in Cleveland, we offer a unique combination of forward-thinking educational opportunities in an inspiring cultural setting. Our leading-edge faculty engage in teaching and research in a collaborative, hands-on environment. Our nationally recognized programs include arts and sciences, dental medicine, engineering, law, management, medicine, nursing and social work. About 6,000 undergraduate and 6,300 graduate students comprise our student body. Visit case.edu to see how Case Western Reserve thinks beyond the possible.


Read More

Continue Reading

Uncategorized

As mortgage rates remain rangebound, so do new home sales

  – by New Deal democratLet’s begin this post by putting why I am watching new home sales in context.The economy was kept out of recession last year,…

Published

on


 - by New Deal democrat


Let’s begin this post by putting why I am watching new home sales in context.

The economy was kept out of recession last year, despite aggressive Fed rate hikes, in large part by commodity price deflation, much or most of which was triggered by the un-kinking of supply chains after the pandemic. That gale force economic tailwind is gone, but the Fed rate hikes remain. So the big question for this year is whether the effects of the Fed rate hikes have just been delayed, or whether, because the rate hikes have stopped, so has the headwind they normally produce. Watching manufacturing and construction, especially housing construction, is what I expect to supply the answer.

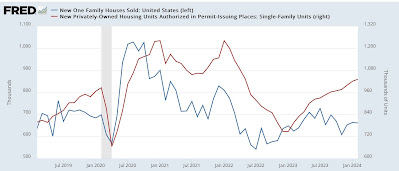
So, to the data, starting with my usual caveat: while new home sales (blue in the graphs below) are the most leading of the housing metrics, they are noisy and heavily revised. There was little this month, as January was only revised higher by 3,000 to 664,000. February gave back -2,000 of that, coming in at 662,000 annualized. In the below graph I also show th slightly less leading but much less noisy single family permits (red, right scale):


Before I discuss this graph a little further, let’s compare sales with the even more leading metric of mortgage rates. Both are shown YoY (rates inverted, and *100 for scale):


Except for the distortion created by the pandemic shutdowns in spring 2020 and the YoY comparisons in spring 2021, we see that new home sales have almost simultaneously followed the trajectory of mortgage rates: the higher the mortgage rate YoY, the lower new home sales YoY. Because mortgage rates remain slightly elevated compared with one year ago, the progress YoY in new home sales has almost completely stopped. As a result, I expect single family permits to follow the more noisy downward trend in month over month comparisons in sales in the immediate future.

In other words, so long as mortgage rates remain in the 6%-7% range, I expect new housing sales and construction to stall out as well, but not to decline significantly either.

Finally, as I always reiterate, prices lag sales. So here’s the YoY update on median prices (red), which are not seasonally adjusted (red) compared with YoY sales:


Again, aside from the spring 2020 and 2021 YoY distortions due to the pandemic lockdowns, we see that prices followed sales higher, and then in 2023 followed sales lower. We will probably continue see negative YoY comparisons in prices for a few months more before they follow sales back higher YoY probably by late this year.

But the big takeaway remains that, generally speaking, I am not expecting much in the way of big moves in new home sales or prices until there is a significant change in mortgage rates.

Read More

Continue Reading

Uncategorized

New Home Sales at 662,000 Annual Rate in February

The Census Bureau reports New Home Sales in February were at a seasonally adjusted annual rate (SAAR) of 662 thousand.

The previous three months were revised up slightly.

Sales of new single‐family houses in February 2024 were at a seasonally adjuste…

Published

on

The Census Bureau reports New Home Sales in February were at a seasonally adjusted annual rate (SAAR) of 662 thousand.

The previous three months were revised up slightly.
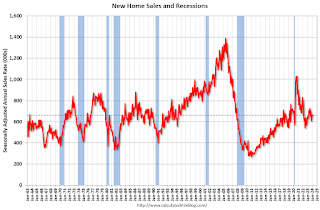
Sales of new single‐family houses in February 2024 were at a seasonally adjusted annual rate of 662,000, according to estimates released jointly today by the U.S. Census Bureau and the Department of Housing and Urban Development. This is 0.3 percent below the revised January rate of 664,000, but is 5.9 percent above the February 2023 estimate of 625,000.
emphasis added
Click on graph for larger image.

The first graph shows New Home Sales vs. recessions since 1963. The dashed line is the current sales rate.

New home sales were close to pre-pandemic levels.

The second graph shows New Home Months of Supply.

New Home Sales, Months of SupplyThe months of supply increased in February to 8.4 months from 8.3 months in January.

The all-time record high was 12.2 months of supply in January 2009. The all-time record low was 3.3 months in August 2020.

This is well above the top of the normal range (about 4 to 6 months of supply is normal).
"The seasonally‐adjusted estimate of new houses for sale at the end of February was 463,000. This represents a supply of 8.4 months at the current sales rate."
Sales were below expectations of 673 thousand SAAR, however, sales for the three previous months were revised up slightly. I'll have more later today.

Read More

Continue Reading

Trending