Uncategorized
Key Events This Week: All Eyes On Core PCE Amid Deluge Of Fed Speakers
Key Events This Week: All Eyes On Core PCE Amid Deluge Of Fed Speakers
After a relatively quiet week on the data front, things start to pick…
Share this:

After a relatively quiet week on the data front, things start to pick up again even as earnings season comes to a close.
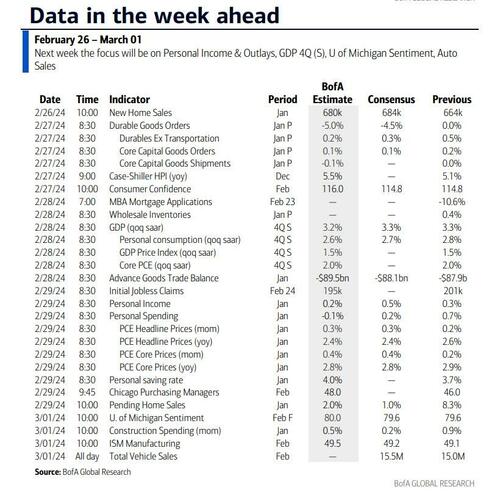
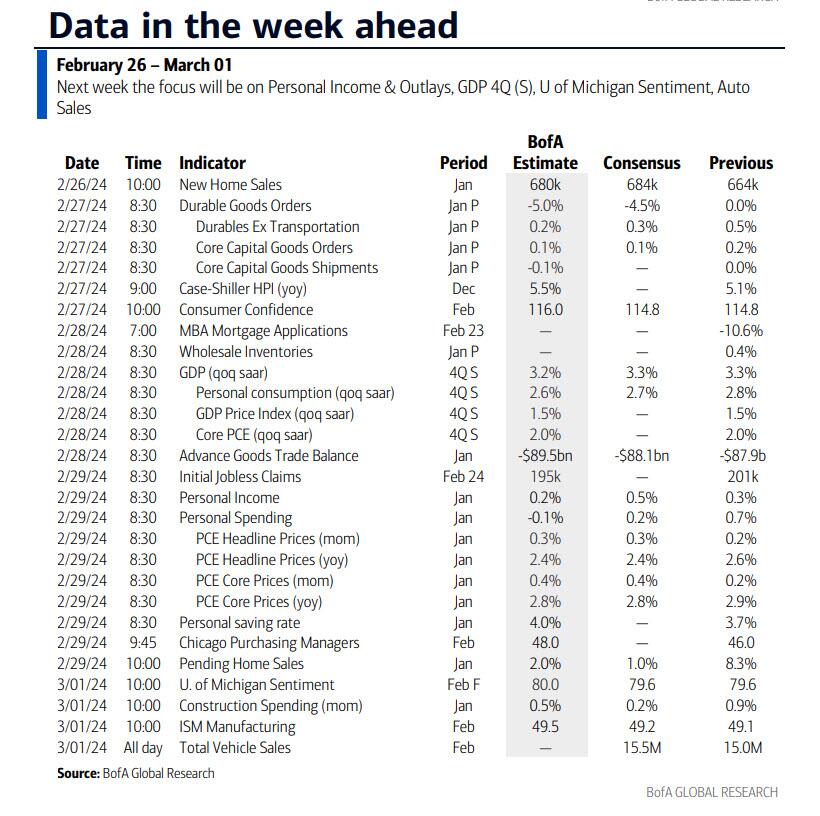
In terms of key events, DB's Jim Reid writes that it’s hard to look too far beyond the latest core PCE print on Thursday after the recent strong CPI report and the strong relevant sub-components in the PPI. DB economists believe the MoM core print will be at 0.36% vs. 0.17% last time. This would make it the highest since last January. The fact that last January was 0.51% means that rolling out base effects should help the YoY rate edge down a tenth to 2.8%. However it's the monthly print that will be all important. Staying with inflation, preliminary CPI prints are also due from Germany and France (Thursday) and for the Eurozone (Friday).
Back to the US, we have new (today) and pending (Thursday) home sales with the focus on whether higher mortgage rates and bad weather in January has had a big impact. Then we have durable goods and consumer confidence (tomorrow), the second reading of Q4 GDP on Wednesday, the personal income and spending data (Thursday), and the ISM manufacturing data as well as unit auto sales as we close out the week by welcoming in a new month on Friday.
Friday is also the day that we could see a partial government shutdown if Congress fails to pass the 2024 budget that has already been agreed to. DB's economists think that it's possible we get a short-term continuing resolution for an extra week which would push it past the "Super Tuesday" primaries on the 5th and coincide with the deadline for the second tranche annual funding bills.
There is also a fair degree of Fed speak which you can see in the calendar at the end as usual alongside all the other data. Chinese PMIs on Friday might be the most interesting non-US data, and should include the lunar new year holidays in the sample period, so one to watch.
Courtesy of DB, here is a day-by-day calendar of events
Monday February 26
- Data: US January new home sales, February Dallas Fed manufacturing activity, Japan January national CPI
- Central banks: ECB's Stournaras and Vujcic speak, BoE's Breeden and Pill speak
- Earnings: Workday, Zoom
- Auctions: US 2-y Notes ($63bn), 5-y Notes ($64bn)
Tuesday February 27
- Data: US January durable goods orders, February Conference Board consumer confidence, Richmond Fed manufacturing index, business conditions, Dallas fed services activity, Q4 house price purchase index, December FHFA house price index, Germany March GfK consumer confidence, France February consumer confidence, Eurozone January M3
- Central banks: Fed's Schmid and Barr speak, BoE's Ramsden speaks
- Earnings: Lowe's, American Tower, AutoZone, Ferrovial, Puma, Macy's
- Auctions: US 7-y Notes ($42bn)
Wednesday February 28
- Data: US January retail inventories, advance goods trade balance, Japan January industrial production, retail sales, Italy February manufacturing confidence, economic sentiment, consumer confidence, Eurozone February services, industrial, economic confidence, Canada Q4 current account balance
- Central banks: Fed's Bostic, Collins and Williams speak, ECB's Muller speaks, BoE's Mann speaks
- Earnings: Salesforce, Snowflake, Universal Music Group, Holcim, Baidu, Okta, SQM, Endeavor Group, Paramount Global
Thursday February 29
- Data: US January PCE, personal income and spending, pending home sales, February MNI Chicago PMI, Kansas City Fed manufacturing activity, initial jobless claims, UK January net consumer credit, mortgage approvals, M4, February Lloyds business barometer, Japan January job-to-applicant ratio, jobless rate, housing starts, Italy December industrial sales, Germany February unemployment claims rate, CPI, France February CPI, January PPI, consumer spending, Canada Q4 GDP
- Central banks: Fed's Bostic, Goolsbee and Mester speak, BoJ's Takata speaks
- Earnings: AB InBev, Dell, Autodesk, Haleon, Leonardo, Covestro
Friday March 1
- Data: US February ISM manufacturing index, Kansas City Fed services activity, total vehicle sales, January construction spending, China February official PMIs, Caixin manufacturing PMI, Japan February consumer confidence, Italy January unemployment rate, February CPI, manufacturing PMI, budget balance, new car registrations, 2023 GDP, Eurozone February CPI, January unemployment rate, Canada February manufacturing PMI
- Central banks: Fed's Williams, Waller, Bostic, Daly and Kugler speak, ECB's Holzmann speaks, BoE's Pill speaks
* * *
The key economic data releases this week are the durable goods report on Tuesday, the core PCE report on Thursday, and the ISM manufacturing report on Friday. There are many speaking engagements from Fed officials this week, including governors Barr, Waller, and Kugler, as well as presidents Schmid, Bostic, Collins, Williams, Goolsbee, Mester, and Daly.
Monday, February 26
- 10:00 AM New home sales, January (GS +3.5%, consensus +3.0%, last +8.0%)
- 10:30 AM Dallas Fed manufacturing activity, February (consensus -14.0, last -27.4)
- 07:40 PM Kansas City Fed President Schmid (FOMC non-voter) speaks: Kansas City Fed President Jeff Schmid will give a speech on the economic and monetary policy outlook at an event in Oklahoma City, OK. Text, Q&A, and livestream are expected.
Tuesday, February 27
- 08:30 AM Durable goods orders, January preliminary (GS -6.0%, consensus -5.0%, last flat); Durable goods orders ex-transportation, January preliminary (GS flat, consensus +0.2%, last +0.5%); Core capital goods orders, January preliminary (GS -0.1%, consensus +0.1%, last +0.2%) ;Core capital goods shipments, January preliminary (GS +0.1%, consensus +0.2%, last flat): We estimate that durable goods orders fell 6.0% in the preliminary January report (mom sa), reflecting a lull in commercial aircraft orders that more than offsets a rebound in the defense category. We forecast soft details as well, including a 0.1% decline in core capital goods orders reflecting an end-of-year lull in global manufacturing activity and scope for order cancellations at the start of the year.
- 09:00 AM FHFA house price index, December (consensus +0.3%, last +0.3%)
- 09:00 AM S&P Case-Shiller 20-city home price index, December (GS +0.1%, consensus +0.2%, last +0.15%)
- 09:05 AM Federal Reserve Vice Chair for Supervision Barr speaks: Federal Reserve Vice Chair for Supervision Michael Barr speaks at the Conference on Counterparty Credit Risk Management. Speech text and livestream are expected. On February 14, Barr said, “As Chair Powell indicated in his most recent press conference, my FOMC colleagues and I are confident we are on a path to 2% inflation, but we need to see continued good data before we can begin the process of reducing the federal funds rate. I fully support what he called a careful approach to considering policy normalization given current conditions…Given the limited historical experience with the growth and inflation dynamics we currently face, and no modern experience of emerging from a global pandemic, we have yet another reason to proceed carefully, as we have been doing.”
- 10:00 AM Conference Board consumer confidence, February (GS 114.6, consensus 115.0, last 114.8)
- 10:00 AM Richmond Fed manufacturing index, February (consensus -8, last -15)
Wednesday, February 28
- 08:30 AM GDP, Q4 second release (GS +3.4%, consensus +3.3%, last +3.3%); Personal consumption, Q4 second release (GS +2.8%, consensus +2.7%, last +2.8%): We estimate a 0.1pp upward revision to Q4 GDP growth to +3.4% (qoq ar), reflecting upward revisions to government spending and healthcare consumption, partially offset by downward revisions to inventory investment, consumer goods spending, and recreation categories.
- 08:30 AM Advance goods trade balance, January (GS -$86.0bn, consensus -$88.3bn, last -$87.9bn)
- 08:30 AM Wholesale inventories, January preliminary (consensus +0.2%, last +0.4%)
- 12:00 PM Atlanta Fed President Bostic (FOMC voter) speaks: Atlanta Fed President Raphael Bostic will answer questions on the economic outlook and monetary policy at a fireside chat in Roswell, GA. Q&A is expected. On February 16, when discussing when to begin cutting the fed funds rate, Bostic said, “A year ago, six months ago, I was in the fourth quarter. So, we’ve seen tremendous progress, and I’m hopeful that that continues. If that continues, I’ll be willing to pull it forward even further.” He added that he could “for sure” see three cuts instead of the two he anticipated in the latest Summary of Economic Projections. On February 15, Bostic said, “The evidence from data, our surveys, and our outreach says that victory is not clearly in hand and leaves me not yet comfortable that inflation is inexorably declining to our 2% objective. That may be true for some time, even if the January CPI report turns out to be an aberration…I require more confidence before declaring victory in this fight for price stability...My expectation is that the rate of inflation will continue to decline, but more slowly than the pace implied by where the markets signal monetary policy should be…Right now, a strong labor market and macroeconomy offer the chance to execute these policy decisions without oppressive urgency.”
- 12:15 PM Boston Fed President Collins (FOMC non-voter) speaks: Boston Fed President Susan Collins will give remarks, participate in a fireside chat, and take audience questions in an event hosted by the Center for Business, Government & Society. Speech text, Q&A, and livestream are expected. On February 7, Collins said, “Seeing sustained, broadening signs of progress should provide the necessary confidence I would need to begin a methodical adjustment to our policy stance…it will likely become appropriate to begin easing policy restraint later this year…a methodical, forward-looking strategy that eases policy gradually will provide the flexibility to manage risks, while promoting stable prices and maximum employment.”
- 12:45 PM New York Fed President Williams (FOMC voter) speaks: New York Fed President John Williams will deliver keynote remarks at the Long Island Association Regional Economic Briefing. Speech text, Q&A with media, and livestream are expected. On February 23, Williams said, “At some point, I think it will be appropriate to pull back on restrictive monetary policy, likely later this year. But it’s really about reading that data and looking for consistent signs that inflation is not only coming down but is moving towards that 2% longer-run goal.” He added, “Rate hikes are not my base case. But clearly, if fundamentally the economic outlook changes in a material, significant way — either with inflation not showing signs of moving toward the 2% longer-run goal on a sustained basis or other indicators that monetary policy is not having the needed or desired effects in order to achieve that goal — then you have to rethink that.”
Thursday, February 29
- 08:30 AM Personal income, January (GS +0.5%, consensus +0.4%, last +0.3%); Personal spending, January (GS -0.1%, consensus +0.2%, last +0.7%); PCE price index (mom), January (GS +0.36%, consensus +0.3%, last +0.2%); PCE price index (yoy), January (GS +2.39%, consensus +2.4%, last +2.6%); Core PCE price index (mom), January (GS +0.43%, consensus +0.4%, last +0.2%); Core PCE price index (yoy), January (GS +2.85%, consensus +2.8%, last +2.9%): We estimate that personal spending declined 0.1% and that personal income increased 0.5% in January. We estimate that the core PCE price index rose 0.43% in January, corresponding to a year-over-year rate of +2.85%. Additionally, we expect that the headline PCE price index rose 0.36%, or +2.39% from a year earlier. Our forecast is consistent with a 0.22% increase in our trimmed core PCE measure for January (vs. 0.20% in December and 0.12% in November).
- 08:30 AM Initial jobless claims, week ended February 24 (GS 200k, consensus 210k, last 201k); Continuing jobless claims, week ended February 17 (GS 1,860k, consensus 1,874k, last 1,862k)
- 10:00 AM Pending home sales, January (GS +1.0%, consensus +1.1%, last +8.3%)
- 10:50 AM Atlanta Fed President Bostic (FOMC voter) speaks: Atlanta Fed President Raphael Bostic will participate in a fireside chat at the 2024 Banking Outlook Conference on the economic outlook, monetary policy, and state of the banking industry. Q&A and Livestream are expected.
- 11:00 AM Kansas City Fed manufacturing index, February (last -9)
- 11:00 AM Chicago Fed President Goolsbee (FOMC non-voter) speaks: Chicago Fed President Austan Goolsbee will join a virtual event for remarks on “Monetary Policy at an Unusual Time.” Q&A and livestream are expected. On February 14, Goolsbee said, “Let’s not get amped up on one month of CPI that was higher than it was expected to be…If you see inflation go up a little bit that doesn't mean that we're not on the target to get to 2%. We can still be on the path even if we have some increases and some ups and downs…so let's not get too flipped out." On February 5, Goolsbee said, “We’ve had seven months of really quite good inflation reports, right around or even below the Fed’s target. So if we just keep getting more data like what we have gotten, I believe that we should well be on the path to normalization.”
- 01:15 PM Cleveland Fed President Mester (FOMC voter) speaks: Cleveland Fed President Loretta Mester will speak at the Columbia University School of International and Public Affairs and Bank Policy Institute's 2024 Bank Regulation Research Conference. Text and Q&A are expected. On February 6, Mester said, “It would be a mistake to move rates down too soon or too quickly without sufficient evidence that inflation was on a sustainable and timely path back to 2%. If the economy evolves as expected, I think we will gain that confidence later this year, and then we can begin moving rates down.”
- 08:10 PM New York Fed President Williams (FOMC voter) speaks: New York Fed President John Williams will participate in a moderated discussion at an event hosted by the Citizens Budget Commission. Q&A and livestream are expected.
Friday, March 1
- 09:45 AM S&P Global US manufacturing PMI, February final (consensus 51.5, last 51.5)
- 10:00 AM Construction spending, January (GS +0.6%, consensus +0.2%, last +0.9%)
- 10:00 AM University of Michigan consumer sentiment, February final (GS 79.2, consensus 79.6, last 79.6); University of Michigan 5-10-year inflation expectations, February final (GS 2.9%, consensus 2.9%, last 2.9%): We estimate the University of Michigan consumer sentiment index declined to 79.2 in the final February reading and estimate the report's measure of long-term inflation expectations will be unrevised at 2.9%.
- 10:00 AM ISM manufacturing index, February (GS 49.1, consensus 49.5, last 49.1): We estimate the ISM manufacturing index was unchanged at 49.1 in February, as negative residual seasonality offsets a rebound in global manufacturing activity and in other business surveys. Our GS manufacturing tracker rose 4.2pt to 50.4.
- 10:15 AM Fed Governor Waller and Dallas Fed President Logan (FOMC non-voter) speak: Fed Governor Christopher Waller and Dallas Fed President Lorie Logan will each respond to a paper titled "Quantitative Tightening Around the Globe: What Have We Learned?" at the 2024 US Monetary Policy Forum in New York. Speech text and Q&A are expected. On February 22, Waller said, “The strength of the economy and the recent data we have received on inflation mean it is appropriate to be patient, careful, methodical, deliberative – pick your favorite synonym. Whatever word you pick, they all translate to one idea: What’s the rush?” He added, “I am going to need to see a couple more months of inflation data to be sure that January was a fluke and that we are still on track to price stability…My conjecture is that, in the absence of a major economic shock, delaying rate cuts by a few months should not have a substantial impact on the real economy in the near term. And I think I have shown that acting too soon could squander our progress in inflation and risk considerable harm to the economy.” On January 6, Logan said, “If we don’t maintain sufficiently tight financial conditions, there is a risk that inflation will pick back up and reverse the progress we’ve made…In light of the easing in financial conditions in recent months, we shouldn’t take the possibility of another rate increase off the table just yet.”
- 12:15 PM Atlanta Fed President Bostic (FOMC voter) speaks: Atlanta Fed President Raphael Bostic will speak in a moderated conversation on topics including the economic outlook and real estate trends at a conference in Orlando. Q&A is expected.
- 01:30 PM San Francisco Fed President Daly (FOMC voter) speaks: San Francisco Fed President Mary Daly will participate in a panel discussion on "AI & the Labor Market" at the 2024 US Monetary Policy Forum, moderated by Kansas City Fed President Jeffrey Schmid. Text and Q&A are expected. On February 16, Daly said, “To finish the job will take fortitude. We will need to resist the temptation to act quickly when patience is needed and be prepared to respond agilely as the economy evolves…Price stability is within sight. But there is more work to do.” Daly added that three 25bps cuts to the fed funds rate was a “reasonable baseline.”
- 03:30 PM Fed Governor Kugler speaks: Fed Governor Adriana Kugler will speak about pursuing the dual mandate at the 2024 Stanford Institute for Economic Policy Research Economic Summit. Speech text, Q&A, and livestream are expected. On February 7, Kugler said, “At some point, the continued cooling of inflation and labor markets may make it appropriate to reduce the target range for the federal funds rate. On the other hand, if progress on disinflation stalls, it may be appropriate to hold the target range steady at its current level for longer to ensure continued progress on our dual mandate.”
- 05:00 PM Lightweight motor vehicle sales, February (GS 15.3mn, consensus 15.4mn, last 15.0mn)
Source: DB, BofA, Goldman
Uncategorized
Mortgage rates fall as labor market normalizes
Jobless claims show an expanding economy. We will only be in a recession once jobless claims exceed 323,000 on a four-week moving average.
Share this:


Everyone was waiting to see if this week’s jobs report would send mortgage rates higher, which is what happened last month. Instead, the 10-year yield had a muted response after the headline number beat estimates, but we have negative job revisions from previous months. The Federal Reserve’s fear of wage growth spiraling out of control hasn’t materialized for over two years now and the unemployment rate ticked up to 3.9%. For now, we can say the labor market isn’t tight anymore, but it’s also not breaking.
The key labor data line in this expansion is the weekly jobless claims report. Jobless claims show an expanding economy that has not lost jobs yet. We will only be in a recession once jobless claims exceed 323,000 on a four-week moving average.
From the Fed: In the week ended March 2, initial claims for unemployment insurance benefits were flat, at 217,000. The four-week moving average declined slightly by 750, to 212,250
Below is an explanation of how we got here with the labor market, which all started during COVID-19.
1. I wrote the COVID-19 recovery model on April 7, 2020, and retired it on Dec. 9, 2020. By that time, the upfront recovery phase was done, and I needed to model out when we would get the jobs lost back.
2. Early in the labor market recovery, when we saw weaker job reports, I doubled and tripled down on my assertion that job openings would get to 10 million in this recovery. Job openings rose as high as to 12 million and are currently over 9 million. Even with the massive miss on a job report in May 2021, I didn’t waver.
Currently, the jobs openings, quit percentage and hires data are below pre-COVID-19 levels, which means the labor market isn’t as tight as it once was, and this is why the employment cost index has been slowing data to move along the quits percentage.

3. I wrote that we should get back all the jobs lost to COVID-19 by September of 2022. At the time this would be a speedy labor market recovery, and it happened on schedule, too
Total employment data
4. This is the key one for right now: If COVID-19 hadn’t happened, we would have between 157 million and 159 million jobs today, which would have been in line with the job growth rate in February 2020. Today, we are at 157,808,000. This is important because job growth should be cooling down now. We are more in line with where the labor market should be when averaging 140K-165K monthly. So for now, the fact that we aren’t trending between 140K-165K means we still have a bit more recovery kick left before we get down to those levels.

From BLS: Total nonfarm payroll employment rose by 275,000 in February, and the unemployment rate increased to 3.9 percent, the U.S. Bureau of Labor Statistics reported today. Job gains occurred in health care, in government, in food services and drinking places, in social assistance, and in transportation and warehousing.
Here are the jobs that were created and lost in the previous month:

In this jobs report, the unemployment rate for education levels looks like this:
- Less than a high school diploma: 6.1%
- High school graduate and no college: 4.2%
- Some college or associate degree: 3.1%
- Bachelor’s degree or higher: 2.2%

Today’s report has continued the trend of the labor data beating my expectations, only because I am looking for the jobs data to slow down to a level of 140K-165K, which hasn’t happened yet. I wouldn’t categorize the labor market as being tight anymore because of the quits ratio and the hires data in the job openings report. This also shows itself in the employment cost index as well. These are key data lines for the Fed and the reason we are going to see three rate cuts this year.
recession unemployment covid-19 fed federal reserve mortgage rates recession recovery unemploymentUncategorized
Inside The Most Ridiculous Jobs Report In History: Record 1.2 Million Immigrant Jobs Added In One Month
Inside The Most Ridiculous Jobs Report In History: Record 1.2 Million Immigrant Jobs Added In One Month
Last month we though that the January…
Share this:


Last month we though that the January jobs report was the "most ridiculous in recent history" but, boy, were we wrong because this morning the Biden department of goalseeked propaganda (aka BLS) published the February jobs report, and holy crap was that something else. Even Goebbels would blush.
What happened? Let's take a closer look.
On the surface, it was (almost) another blockbuster jobs report, certainly one which nobody expected, or rather just one bank out of 76 expected. Starting at the top, the BLS reported that in February the US unexpectedly added 275K jobs, with just one research analyst (from Dai-Ichi Research) expecting a higher number.
Some context: after last month's record 4-sigma beat, today's print was "only" 3 sigma higher than estimates. Needless to say, two multiple sigma beats in a row used to only happen in the USSR... and now in the US, apparently.

Before we go any further, a quick note on what last month we said was "the most ridiculous jobs report in recent history": it appears the BLS read our comments and decided to stop beclowing itself. It did that by slashing last month's ridiculous print by over a third, and revising what was originally reported as a massive 353K beat to just 229K, a 124K revision, which was the biggest one-month negative revision in two years!

Of course, that does not mean that this month's jobs print won't be revised lower: it will be, and not just that month but every other month until the November election because that's the only tool left in the Biden admin's box: pretend the economic and jobs are strong, then revise them sharply lower the next month, something we pointed out first last summer and which has not failed to disappoint once.
In the past month the Biden department of goalseeking stuff higher before revising it lower, has revised the following data sharply lower:
— zerohedge (@zerohedge) August 30, 2023
- Jobs
- JOLTS
- New Home sales
- Housing Starts and Permits
- Industrial Production
- PCE and core PCE
To be fair, not every aspect of the jobs report was stellar (after all, the BLS had to give it some vague credibility). Take the unemployment rate, after flatlining between 3.4% and 3.8% for two years - and thus denying expectations from Sahm's Rule that a recession may have already started - in February the unemployment rate unexpectedly jumped to 3.9%, the highest since February 2022 (with Black unemployment spiking by 0.3% to 5.6%, an indicator which the Biden admin will quickly slam as widespread economic racism or something).

And then there were average hourly earnings, which after surging 0.6% MoM in January (since revised to 0.5%) and spooking markets that wage growth is so hot, the Fed will have no choice but to delay cuts, in February the number tumbled to just 0.1%, the lowest in two years...

... for one simple reason: last month's average wage surge had nothing to do with actual wages, and everything to do with the BLS estimate of hours worked (which is the denominator in the average wage calculation) which last month tumbled to just 34.1 (we were led to believe) the lowest since the covid pandemic...

... but has since been revised higher while the February print rose even more, to 34.3, hence why the latest average wage data was once again a product not of wages going up, but of how long Americans worked in any weekly period, in this case higher from 34.1 to 34.3, an increase which has a major impact on the average calculation.

While the above data points were examples of some latent weakness in the latest report, perhaps meant to give it a sheen of veracity, it was everything else in the report that was a problem starting with the BLS's latest choice of seasonal adjustments (after last month's wholesale revision), which have gone from merely laughable to full clownshow, as the following comparison between the monthly change in BLS and ADP payrolls shows. The trend is clear: the Biden admin numbers are now clearly rising even as the impartial ADP (which directly logs employment numbers at the company level and is far more accurate), shows an accelerating slowdown.

But it's more than just the Biden admin hanging its "success" on seasonal adjustments: when one digs deeper inside the jobs report, all sorts of ugly things emerge... such as the growing unprecedented divergence between the Establishment (payrolls) survey and much more accurate Household (actual employment) survey. To wit, while in January the BLS claims 275K payrolls were added, the Household survey found that the number of actually employed workers dropped for the third straight month (and 4 in the past 5), this time by 184K (from 161.152K to 160.968K).

This means that while the Payrolls series hits new all time highs every month since December 2020 (when according to the BLS the US had its last month of payrolls losses), the level of Employment has not budged in the past year. Worse, as shown in the chart below, such a gaping divergence has opened between the two series in the past 4 years, that the number of Employed workers would need to soar by 9 million (!) to catch up to what Payrolls claims is the employment situation.

There's more: shifting from a quantitative to a qualitative assessment, reveals just how ugly the composition of "new jobs" has been. Consider this: the BLS reports that in February 2024, the US had 132.9 million full-time jobs and 27.9 million part-time jobs. Well, that's great... until you look back one year and find that in February 2023 the US had 133.2 million full-time jobs, or more than it does one year later! And yes, all the job growth since then has been in part-time jobs, which have increased by 921K since February 2023 (from 27.020 million to 27.941 million).

Here is a summary of the labor composition in the past year: all the new jobs have been part-time jobs!

But wait there's even more, because now that the primary season is over and we enter the heart of election season and political talking points will be thrown around left and right, especially in the context of the immigration crisis created intentionally by the Biden administration which is hoping to import millions of new Democratic voters (maybe the US can hold the presidential election in Honduras or Guatemala, after all it is their citizens that will be illegally casting the key votes in November), what we find is that in February, the number of native-born workers tumbled again, sliding by a massive 560K to just 129.807 million. Add to this the December data, and we get a near-record 2.4 million plunge in native-born workers in just the past 3 months (only the covid crash was worse)!

The offset? A record 1.2 million foreign-born (read immigrants, both legal and illegal but mostly illegal) workers added in February!

Said otherwise, not only has all job creation in the past 6 years has been exclusively for foreign-born workers...

... but there has been zero job-creation for native born workers since June 2018!

This is a huge issue - especially at a time of an illegal alien flood at the southwest border...

... and is about to become a huge political scandal, because once the inevitable recession finally hits, there will be millions of furious unemployed Americans demanding a more accurate explanation for what happened - i.e., the illegal immigration floodgates that were opened by the Biden admin.
Which is also why Biden's handlers will do everything in their power to insure there is no official recession before November... and why after the election is over, all economic hell will finally break loose. Until then, however, expect the jobs numbers to get even more ridiculous.
Uncategorized
Economic Earthquake Ahead? The Cracks Are Spreading Fast
Economic Earthquake Ahead? The Cracks Are Spreading Fast
Authored by Brandon Smith via Alt-Market.us,
One of my favorite false narratives…
Share this:


Authored by Brandon Smith via Alt-Market.us,
One of my favorite false narratives floating around corporate media platforms has been the argument that the American people “just don’t seem to understand how good the economy really is right now.” If only they would look at the stats, they would realize that we are in the middle of a financial renaissance, right? It must be that people have been brainwashed by negative press from conservative sources…
I have to laugh at this notion because it’s a very common one throughout history – it’s an assertion made by almost every single political regime right before a major collapse. These people always say the same things, and when you study economics as long as I have you can’t help but throw up your hands and marvel at their dedication to the propaganda.
One example that comes to mind immediately is the delusional optimism of the “roaring” 1920s and the lead up to the Great Depression. At the time around 60% of the U.S. population was living in poverty conditions (according to the metrics of the decade) earning less than $2000 a year. However, in the years after WWI ravaged Europe, America’s economic power was considered unrivaled.
The 1920s was an era of mass production and rampant consumerism but it was all fueled by easy access to debt, a condition which had not really existed before in America. It was this illusion of prosperity created by the unchecked application of credit that eventually led to the massive stock market bubble and the crash of 1929. This implosion, along with the Federal Reserve’s policy of raising interest rates into economic weakness, created a black hole in the U.S. financial system for over a decade.
There are two primary tools that various failing regimes will often use to distort the true conditions of the economy: Debt and inflation. In the case of America today, we are experiencing BOTH problems simultaneously and this has made certain economic indicators appear healthy when they are, in fact, highly unstable. The average American knows this is the case because they see the effects everyday. They see the damage to their wallets, to their buying power, in the jobs market and in their quality of life. This is why public faith in the economy has been stuck in the dregs since 2021.
The establishment can flash out-of-context stats in people’s faces, but they can’t force the populace to see a recovery that simply does not exist. Let’s go through a short list of the most faulty indicators and the real reasons why the fiscal picture is not a rosy as the media would like us to believe…
The “miracle” labor market recovery
In the case of the U.S. labor market, we have a clear example of distortion through inflation. The $8 trillion+ dropped on the economy in the first 18 months of the pandemic response sent the system over the edge into stagflation land. Helicopter money has a habit of doing two things very well: Blowing up a bubble in stock markets and blowing up a bubble in retail. Hence, the massive rush by Americans to go out and buy, followed by the sudden labor shortage and the race to hire (mostly for low wage part-time jobs).
The problem with this “miracle” is that inflation leads to price explosions, which we have already experienced. The average American is spending around 30% more for goods, services and housing compared to what they were spending in 2020. This is what happens when you have too much money chasing too few goods and limited production.
The jobs market looks great on paper, but the majority of jobs generated in the past few years are jobs that returned after the covid lockdowns ended. The rest are jobs created through monetary stimulus and the artificial retail rush. Part time low wage service sector jobs are not going to keep the country rolling for very long in a stagflation environment. The question is, what happens now that the stimulus punch bowl has been removed?
Just as we witnessed in the 1920s, Americans have turned to debt to make up for higher prices and stagnant wages by maxing out their credit cards. With the central bank keeping interest rates high, the credit safety net will soon falter. This condition also goes for businesses; the same businesses that will jump headlong into mass layoffs when they realize the party is over. It happened during the Great Depression and it will happen again today.
Cracks in the foundation
We saw cracks in the narrative of the financial structure in 2023 with the banking crisis, and without the Federal Reserve backstop policy many more small and medium banks would have dropped dead. The weakness of U.S. banks is offset by the relative strength of the U.S. dollar, which lures in foreign investors hoping to protect their wealth using dollar denominated assets.
But something is amiss. Gold and bitcoin have rocketed higher along with economically sensitive assets and the dollar. This is the opposite of what’s supposed to happen. Gold and BTC are supposed to be hedges against a weak dollar and a weak economy, right? If global faith in the dollar and in the U.S. economy is so high, why are investors diving into protective assets like gold?
Again, as noted above, inflation distorts everything.
Tens of trillions of extra dollars printed by the Fed are floating around and it’s no surprise that much of that cash is flooding into the economy which simply pushes higher right along with prices on the shelf. But, gold and bitcoin are telling us a more honest story about what’s really happening.
Right now, the U.S. government is adding around $600 billion per month to the national debt as the Fed holds rates higher to fight inflation. This debt is going to crush America’s financial standing for global investors who will eventually ask HOW the U.S. is going to handle that growing millstone? As I predicted years ago, the Fed has created a perfect Catch-22 scenario in which the U.S. must either return to rampant inflation, or, face a debt crisis. In either case, U.S. dollar-denominated assets will lose their appeal and their prices will plummet.
“Healthy” GDP is a complete farce
GDP is the most common out-of-context stat used by governments to convince the citizenry that all is well. It is yet another stat that is entirely manipulated by inflation. It is also manipulated by the way in which modern governments define “economic activity.”
GDP is primarily driven by spending. Meaning, the higher inflation goes, the higher prices go, and the higher GDP climbs (to a point). Eventually prices go too high, credit cards tap out and spending ceases. But, for a short time inflation makes GDP (as well as retail sales) look good.
Another factor that creates a bubble is the fact that government spending is actually included in the calculation of GDP. That’s right, every dollar of your tax money that the government wastes helps the establishment by propping up GDP numbers. This is why government spending increases will never stop – It’s too valuable for them to spend as a way to make the economy appear healthier than it is.
The REAL economy is eclipsing the fake economy
The bottom line is that Americans used to be able to ignore the warning signs because their bank accounts were not being directly affected. This is over. Now, every person in the country is dealing with a massive decline in buying power and higher prices across the board on everything – from food and fuel to housing and financial assets alike. Even the wealthy are seeing a compression to their profit and many are struggling to keep their businesses in the black.
The unfortunate truth is that the elections of 2024 will probably be the turning point at which the whole edifice comes tumbling down. Even if the public votes for change, the system is already broken and cannot be repaired without a complete overhaul.
We have consistently avoided taking our medicine and our disease has gotten worse and worse.
People have lost faith in the economy because they have not faced this kind of uncertainty since the 1930s. Even the stagflation crisis of the 1970s will likely pale in comparison to what is about to happen. On the bright side, at least a large number of Americans are aware of the threat, as opposed to the 1920s when the vast majority of people were utterly conned by the government, the banks and the media into thinking all was well. Knowing is the first step to preparing.
The second step is securing your own financial future – that’s where physical precious metals can play a role. Diversifying your savings with inflation-resistant, uninflatable assets whose intrinsic value doesn’t rely on a counterparty’s promise to pay adds resilience to your savings. That’s the main reason physical gold and silver have been the safe haven store-of-value assets of choice for centuries (among both the elite and the everyday citizen).
* * *
As the world moves away from dollars and toward Central Bank Digital Currencies (CBDCs), is your 401(k) or IRA really safe? A smart and conservative move is to diversify into a physical gold IRA. That way your savings will be in something solid and enduring. Get your FREE info kit on Gold IRAs from Birch Gold Group. No strings attached, just peace of mind. Click here to secure your future today.


Wendy’s has a new deal for daylight savings time haters


Watch Live: President Biden Reminds Americans Just How Good They’ve Got It Thanks To Him


Watch: President Biden Delivers The “Darkest, Most Un-American Speech Given By A President”


These Are The 5 Charts The FDIC Does Not Want You Paying Attention To


Interest rates, the best it gets. It’s time to deploy cash


Is the biotech market rally real? Data suggest comeback in private, public markets


People Who Received Ivermectin Were Better Off, Study Finds


Stock Market’s Top Will Outlast Your Disbelief


COVID-19 May Lead To Persistent Cognitive Impairment, Brain Fog, And Lower IQ Scores


Normalise the underlying conditions when “rating” a company’s share price
-

 Uncategorized2 weeks ago
All Of The Elements Are In Place For An Economic Crisis Of Staggering Proportions
-

 Uncategorized1 month ago
Cathie Wood sells a major tech stock (again)
-

 Uncategorized3 weeks ago
California Counties Could Be Forced To Pay $300 Million To Cover COVID-Era Program
-

 Uncategorized2 weeks ago
Apparel Retailer Express Moving Toward Bankruptcy
-

 Uncategorized3 weeks ago
Industrial Production Decreased 0.1% in January
-

 International12 hours ago
Walmart launches clever answer to Target’s new membership program
-

 Uncategorized3 weeks ago
RFK Jr: The Wuhan Cover-Up & The Rise Of The Biowarfare-Industrial Complex
-

 Uncategorized3 weeks ago
GOP Efforts To Shore Up Election Security In Swing States Face Challenges