Uncategorized
Stock Market’s Top Will Outlast Your Disbelief
Stock Market’s Top Will Outlast Your Disbelief
Authored by Simon White, Bloomberg macro strategist,
The stock market is entering its topping…
Share this:

Authored by Simon White, Bloomberg macro strategist,
The stock market is entering its topping phase. That’s not necessarily a reason, however, to hit the sell button as market tops typically persist long after fundamentals have ceased to support them, making them fraught with risks. The current market has yet to display the majority features present at previous tops, suggesting it can keep grinding higher — perhaps even culminating in a blow-off in prices — despite growing skepticism in the rally.
Markets exhibit asymmetric behavior at tops and bottoms. The latter are points in time, but tops are a process, often lasting many months. The most recent ones: the pandemic in 2021, the subprime crisis in 2007, the 2000 tech bubble and the savings and loan crisis in 1990 lasted many months – with the exception of the pandemic – and endured mounting disbelief before they finally gave way.
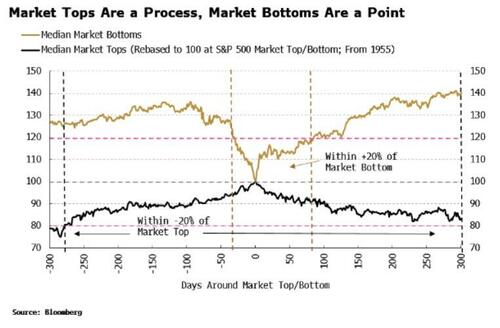
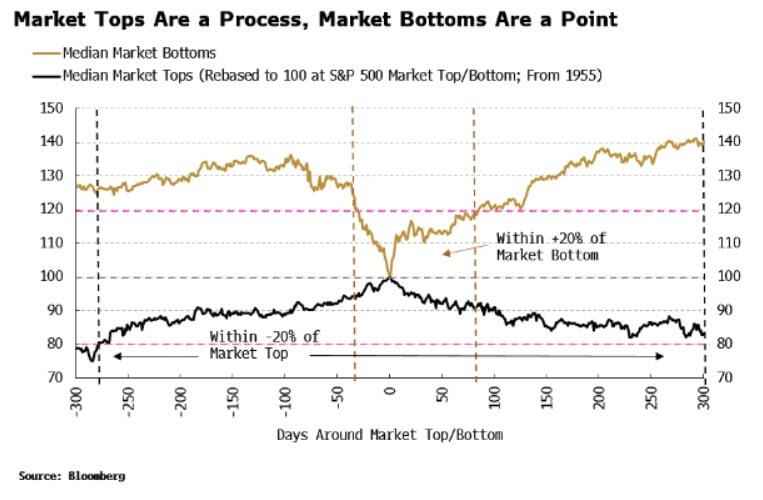
The stark difference between market tops and bottoms can be seen in the following chart. It shows the median bull market and the median bear market of the last 70 years. We can see clearly that market tops take many months to build, forming an inverted U-shape, and spending a significant amount of time within 20% of their peak price.
Markets bottoms on the other hand are V-shaped and are much more sudden affairs. They sell off abruptly but also recover rapidly, and spend considerably less time within 20% of their low price.
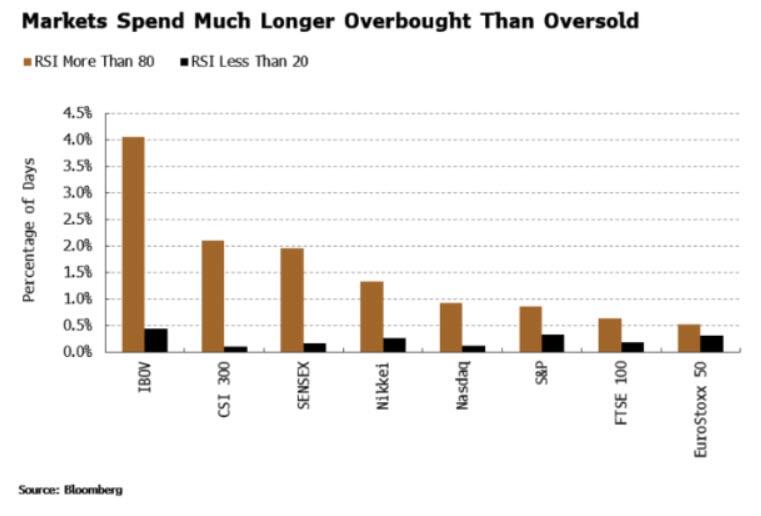
This is not just a US phenomenon. Stock markets globally spend more time being overbought than oversold. The percentage of days indexes spend with their 14-day RSI above 80 (an estimate of overboughtness) is much higher than the percentage of days when it is below 20 (for oversoldness) across global equity markets, with the effect more pronounced in EM, such as Brazil and China.
Market tops obey a variation of the Anna Karenina principle, in that every one is alike, but they all end in their own way. Each typically displays many of the following features at their climactic point:
-
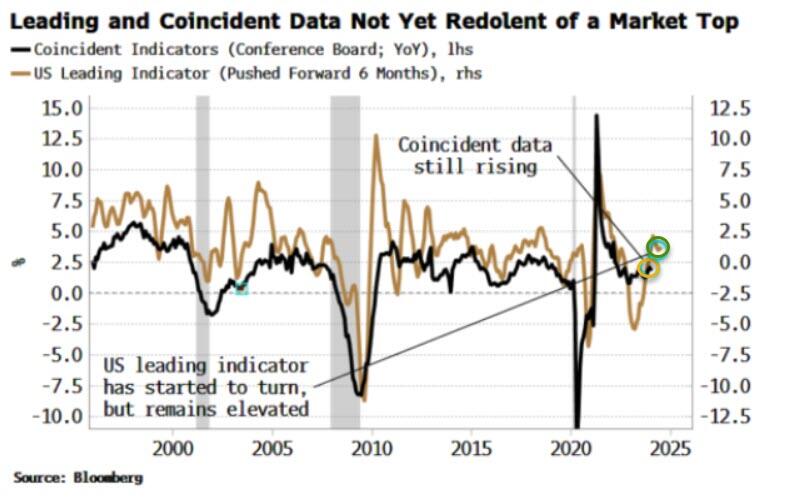
weakening leading economic indicators, with coincident indicators yet to decline
-
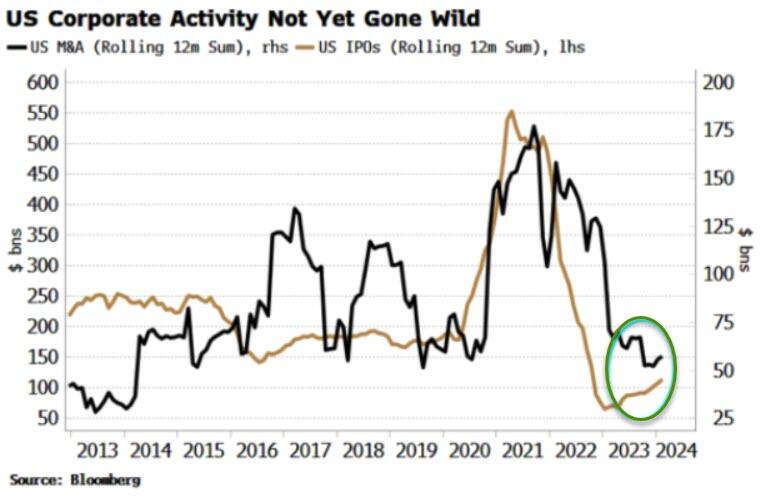
signs of over-extension in corporate activity
-
worsening excess liquidity
-
stretched breadth and price technicals
-
extreme bullish sentiment, and absence of bears
-
nosebleed valuations
Only some of the above are currently present, indicating the market is entering its topping phase, but one that could last several months yet.
Take economic data. The leading indicator for the US has started to turn down but from a high level, while coincident data is still increasing. Leading data, such as building permits and new orders-to-inventory ratios from PMIs, remain in a rising trend.
Credit markets and corporate actions typically display more signs of excess at market tops than is seen today. M&A, IPO and share buyback activity surge. Capex spending is rife, and more elaborate and questionable offerings are devised to take people’s money. We saw all of this at the last market top in 2021, as ultra-loose monetary policy and gallons of pandemic cash caused a wave of corporate activity and gave birth to Ponzi schemes, such as many SPACs.
Today, though, and for now capex is muted, SPACs are out of favor, while IPO and M&A activity is far below the excesses seen at the tail-end of the pandemic.
Still, every cycle has its own quirks, and in this one it remains to be seen to what extent private credit is hiding the skeletons in the closet.
When it comes to excess liquidity, it has yet to roll over (as discussed in recent columns), which will act as a tailwind for stock prices.
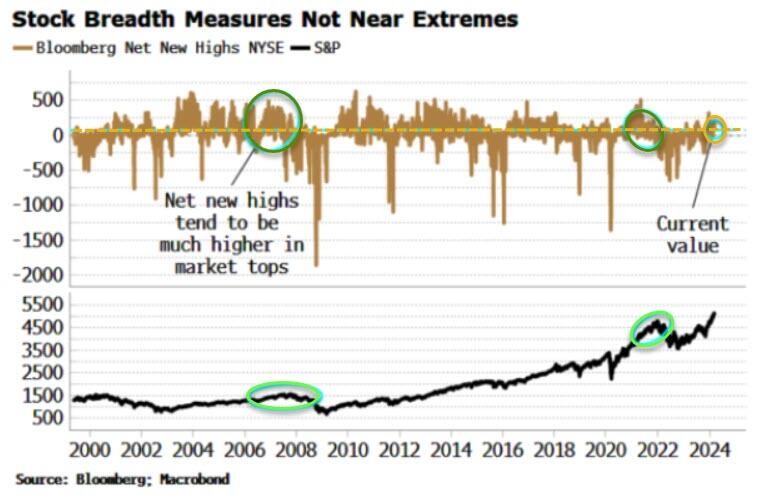
Furthermore, measures of market breadth, such as advance-decline lines, the percentage of stocks above their 200-day moving average, or the net number of stocks making new 52-week highs (shown in the chart below) are elevated, but not as extreme as the levels seen during prior market tops.
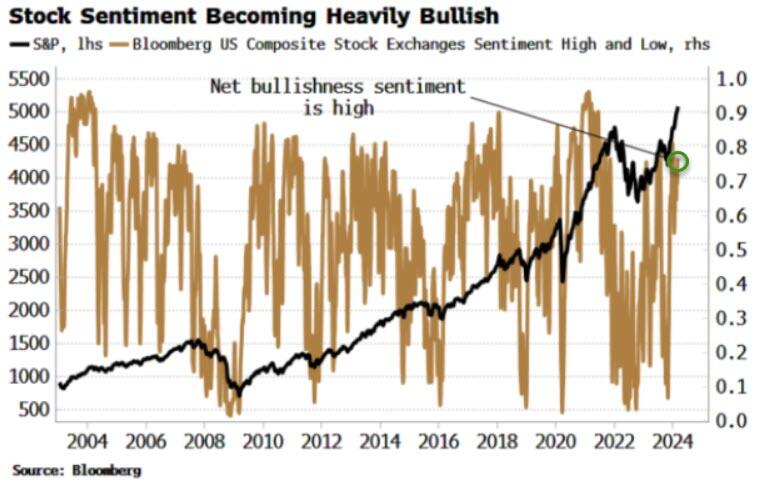
Sentiment is, however, reflective of a market in its topping phase. Bloomberg’s measure of individual stock sentiment is high (chart below), while the AAII’s (American Association of Individual Investors) net bullish indicator gauging retail-investor sentiment is not yet as stretched, but is still elevated. More glaringly though is AAII’s bear sentiment indicator, which is very low and suggests most stock bears have thrown in the towel, typical at market tops.
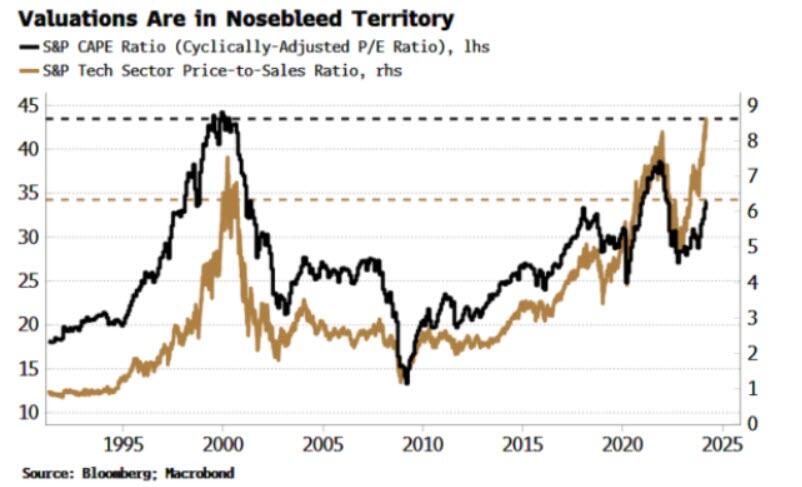
Also beginning to shout “topping market” is valuations. Multiples have been driving US returns, but even more egregiously in the tech sector. P/Es are driving tech returns more than they have at any time since the run-up to the tech bust in 2000 (outside of some very brief periods).
The S&P’s cyclically-adjusted P/E ratio is high, but still under its 2000 and 2022 peaks. However, the price-to-sales ratio is becoming faintly ludicrous, especially in the tech sector, where it’s at all-time highs at almost 9x, with some firms’ considerably more (Nvidia’s is at 36x …).
Valuations are of course execrable timing devices, but they are emblematic of how market tops can run and run long after any rational justification can be made for them doing so — other than that there’s a greater fool ready to take your position.
Previous tops have lingered well past their widely perceived sell-by date. The 2007 market kept going long after various subprime mortgage-bond prices had fallen, funding spreads had blown out, and hedge funds had shuttered, while in 2000 stocks continued their ascent despite growing evidence many companies were neither bringing in revenues nor making any profits.
It is unlikely this top will be much different, in the process creating much angst for bulls worried they’ll get out too early, while at the same time virtually eliminating bears, incandescent that the market is defying all sense and reality.
Market tops ultimately please no-one, which is why they outlast widespread disbelief. We’ll likely need to see more signs of a weaker economy, deteriorating liquidity, stretched technical indicators and corporate excess before the current top enters it endgame.
Uncategorized
Wendy’s teases new $3 offer for upcoming holiday
The Daylight Savings Time promotion slashes prices on breakfast.
Share this:


Daylight Savings Time, or the practice of advancing clocks an hour in the spring to maximize natural daylight, is a controversial practice because of the way it leaves many feeling off-sync and tired on the second Sunday in March when the change is made and one has one less hour to sleep in.
Despite annual "Abolish Daylight Savings Time" think pieces and online arguments that crop up with unwavering regularity, Daylight Savings in North America begins on March 10 this year.
Related: Coca-Cola has a new soda for Diet Coke fans
Tapping into some people's very vocal dislike of Daylight Savings Time, fast-food chain Wendy's (WEN) is launching a daylight savings promotion that is jokingly designed to make losing an hour of sleep less painful and encourage fans to order breakfast anyway.
Image source: Wendy's.
Promotion wants you to compensate for lost sleep with cheaper breakfast
As it is also meant to drive traffic to the Wendy's app, the promotion allows anyone who makes a purchase of $3 or more through the platform to get a free hot coffee, cold coffee or Frosty Cream Cold Brew.
More Food + Dining:
- Taco Bell menu tries new take on an American classic
- McDonald's menu goes big, brings back fan favorites (with a catch)
- The 10 best food stocks to buy now
Available during the Wendy's breakfast hours of 6 a.m. and 10:30 a.m. (which, naturally, will feel even earlier due to Daylight Savings), the deal also allows customers to buy any of its breakfast sandwiches for $3. Items like the Sausage, Egg and Cheese Biscuit, Breakfast Baconator and Maple Bacon Chicken Croissant normally range in price between $4.50 and $7.
The choice of the latter is quite wide since, in the years following the pandemic, Wendy's has made a concerted effort to expand its breakfast menu with a range of new sandwiches with egg in them and sweet items such as the French Toast Sticks. The goal was both to stand out from competitors with a wider breakfast menu and increase traffic to its stores during early-morning hours.
Wendy's deal comes after controversy over 'dynamic pricing'
But last month, the chain known for the square shape of its burger patties ignited controversy after saying that it wanted to introduce "dynamic pricing" in which the cost of many of the items on its menu will vary depending on the time of day. In an earnings call, chief executive Kirk Tanner said that electronic billboards would allow restaurants to display various deals and promotions during slower times in the early morning and late at night.
Outcry was swift and Wendy's ended up walking back its plans with words that they were "misconstrued" as an intent to surge prices during its most popular periods.
While the company issued a statement saying that any changes were meant as "discounts and value offers" during quiet periods rather than raised prices during busy ones, the reputational damage was already done since many saw the clarification as another way to obfuscate its pricing model.
"We said these menuboards would give us more flexibility to change the display of featured items," Wendy's said in its statement. "This was misconstrued in some media reports as an intent to raise prices when demand is highest at our restaurants."
The Daylight Savings Time promotion, in turn, is also a way to demonstrate the kinds of deals Wendy's wants to promote in its stores without putting up full-sized advertising or posters for what is only relevant for a few days.
Related: Veteran fund manager picks favorite stocks for 2024
stocks pandemicUncategorized
Inside The Most Ridiculous Jobs Report In Recent History: Record 1.2 Million Immigrant Jobs Added In One Month
Inside The Most Ridiculous Jobs Report In Recent History: Record 1.2 Million Immigrant Jobs Added In One Month
Last month we though that the…
Share this:


Last month we though that the January jobs report was the "most ridiculous in recent history" but, boy, were we wrong because this morning the Biden department of goalseeked propaganda (aka BLS) published the February jobs report, and holy crap was that something else. Even Goebbels would blush.
What happened? Let's take a closer look.
On the surface, it was (almost) another blockbuster jobs report, certainly one which nobody expected, or rather just one bank out of 76 expected. Starting at the top, the BLS reported that in February the US unexpectedly added 275K jobs, with just one research analyst (from Dai-Ichi Research) expecting a higher number.
Some context: after last month's record 4-sigma beat, today's print was "only" 3 sigma higher than estimates. Needless to say, two multiple sigma beats in a row used to only happen in the USSR... and now in the US, apparently.

Before we go any further, a quick note on what last month we said was "the most ridiculous jobs report in recent history": it appears the BLS read our comments and decided to stop beclowing itself. It did that by slashing last month's ridiculous print by over a third, and revising what was originally reported as a massive 353K beat to just 229K, a 124K revision, which was the biggest one-month negative revision in two years!

Of course, that does not mean that this month's jobs print won't be revised lower: it will be, and not just that month but every other month until the November election because that's the only tool left in the Biden admin's box: pretend the economic and jobs are strong, then revise them sharply lower the next month, something we pointed out first last summer and which has not failed to disappoint once.
In the past month the Biden department of goalseeking stuff higher before revising it lower, has revised the following data sharply lower:
— zerohedge (@zerohedge) August 30, 2023
- Jobs
- JOLTS
- New Home sales
- Housing Starts and Permits
- Industrial Production
- PCE and core PCE
To be fair, not every aspect of the jobs report was stellar (after all, the BLS had to give it some vague credibility). Take the unemployment rate, after flatlining between 3.4% and 3.8% for two years - and thus denying expectations from Sahm's Rule that a recession may have already started - in February the unemployment rate unexpectedly jumped to 3.9%, the highest since February 2022 (with Black unemployment spiking by 0.3% to 5.6%, an indicator which the Biden admin will quickly slam as widespread economic racism or something).

And then there were average hourly earnings, which after surging 0.6% MoM in January (since revised to 0.5%) and spooking markets that wage growth is so hot, the Fed will have no choice but to delay cuts, in February the number tumbled to just 0.1%, the lowest in two years...

... for one simple reason: last month's average wage surge had nothing to do with actual wages, and everything to do with the BLS estimate of hours worked (which is the denominator in the average wage calculation) which last month tumbled to just 34.1 (we were led to believe) the lowest since the covid pandemic...

... but has since been revised higher while the February print rose even more, to 34.3, hence why the latest average wage data was once again a product not of wages going up, but of how long Americans worked in any weekly period, in this case higher from 34.1 to 34.3, an increase which has a major impact on the average calculation.

While the above data points were examples of some latent weakness in the latest report, perhaps meant to give it a sheen of veracity, it was everything else in the report that was a problem starting with the BLS's latest choice of seasonal adjustments (after last month's wholesale revision), which have gone from merely laughable to full clownshow, as the following comparison between the monthly change in BLS and ADP payrolls shows. The trend is clear: the Biden admin numbers are now clearly rising even as the impartial ADP (which directly logs employment numbers at the company level and is far more accurate), shows an accelerating slowdown.

But it's more than just the Biden admin hanging its "success" on seasonal adjustments: when one digs deeper inside the jobs report, all sorts of ugly things emerge... such as the growing unprecedented divergence between the Establishment (payrolls) survey and much more accurate Household (actual employment) survey. To wit, while in January the BLS claims 275K payrolls were added, the Household survey found that the number of actually employed workers dropped for the third straight month (and 4 in the past 5), this time by 184K (from 161.152K to 160.968K).

This means that while the Payrolls series hits new all time highs every month since December 2020 (when according to the BLS the US had its last month of payrolls losses), the level of Employment has not budged in the past year. Worse, as shown in the chart below, such a gaping divergence has opened between the two series in the past 4 years, that the number of Employed workers would need to soar by 9 million (!) to catch up to what Payrolls claims is the employment situation.

There's more: shifting from a quantitative to a qualitative assessment, reveals just how ugly the composition of "new jobs" has been. Consider this: the BLS reports that in February 2024, the US had 132.9 million full-time jobs and 27.9 million part-time jobs. Well, that's great... until you look back one year and find that in February 2023 the US had 133.2 million full-time jobs, or more than it does one year later! And yes, all the job growth since then has been in part-time jobs, which have increased by 921K since February 2023 (from 27.020 million to 27.941 million).

Here is a summary of the labor composition in the past year: all the new jobs have been part-time jobs!

But wait there's even more, because now that the primary season is over and we enter the heart of election season and political talking points will be thrown around left and right, especially in the context of the immigration crisis created intentionally by the Biden administration which is hoping to import millions of new Democratic voters (maybe the US can hold the presidential election in Honduras or Guatemala, after all it is their citizens that will be illegally casting the key votes in November), what we find is that in February, the number of native-born workers tumbled again, sliding by a massive 560K to just 129.807 million. Add to this the December data, and we get a near-record 2.4 million plunge in native-born workers in just the past 3 months (only the covid crash was worse)!

The offset? A record 1.2 million foreign-born (read immigrants, both legal and illegal but mostly illegal) workers added in February!

Said otherwise, not only has all job creation in the past 6 years has been exclusively for foreign-born workers...

... but there has been zero job-creation for native born workers since June 2018!

This is a huge issue - especially at a time of an illegal alien flood at the southwest border...

... and is about to become a huge political scandal, because once the inevitable recession finally hits, there will be millions of furious unemployed Americans demanding a more accurate explanation for what happened - i.e., the illegal immigration floodgates that were opened by the Biden admin.
Which is also why Biden's handlers will do everything in their power to insure there is no official recession before November... and why after the election is over, all economic hell will finally break loose. Until then, however, expect the jobs numbers to get even more ridiculous.
Uncategorized
Shipping company files surprise Chapter 7 bankruptcy, liquidation
While demand for trucking has increased, so have costs and competition, which have forced a number of players to close.
Share this:


The U.S. economy is built on trucks.
As a nation we have relatively limited train assets, and while in recent years planes have played an expanded role in moving goods, trucks still represent the backbone of how everything — food, gasoline, commodities, and pretty much anything else — moves around the country.
Related: Fast-food chain closes more stores after Chapter 11 bankruptcy
"Trucks moved 61.1% of the tonnage and 64.9% of the value of these shipments. The average shipment by truck was 63 miles compared to an average of 640 miles by rail," according to the U.S. Bureau of Transportation Statistics 2023 numbers.
But running a trucking company has been tricky because the largest players have economies of scale that smaller operators don't. That puts any trucking company that's not a massive player very sensitive to increases in gas prices or drops in freight rates.
And that in turn has led a number of trucking companies, including Yellow Freight, the third-largest less-than-truckload operator; J.J. & Sons Logistics, Meadow Lark, and Boateng Logistics, to close while freight brokerage Convoy shut down in October.
Aside from Convoy, none of these brands are household names. but with the demand for trucking increasing, every company that goes out of business puts more pressure on those that remain, which contributes to increased prices.
Image source: Shutterstock
Another freight company closes and plans to liquidate
Not every bankruptcy filing explains why a company has gone out of business. In the trucking industry, multiple recent Chapter 7 bankruptcies have been tied to lawsuits that pushed otherwise successful companies into insolvency.
In the case of TBL Logistics, a Virginia-based national freight company, its Feb. 29 bankruptcy filing in U.S. Bankruptcy Court for the Western District of Virginia appears to be death by too much debt.
"In its filing, TBL Logistics listed its assets and liabilities as between $1 million and $10 million. The company stated that it has up to 49 creditors and maintains that no funds will be available for unsecured creditors once it pays administrative fees," Freightwaves reported.
The company's owners, Christopher and Melinda Bradner, did not respond to the website's request for comment.
Before it closed, TBL Logistics specialized in refrigerated and oversized loads. The company described its business on its website.
"TBL Logistics is a non-asset-based third-party logistics freight broker company providing reliable and efficient transportation solutions, management, and storage for businesses of all sizes. With our extensive network of carriers and industry expertise, we streamline the shipping process, ensuring your goods reach their destination safely and on time."
The world has a truck-driver shortage
The covid pandemic forced companies to consider their supply chain in ways they never had to before. Increased demand showed the weakness in the trucking industry and drew attention to how difficult life for truck drivers can be.
That was an issue HBO's John Oliver highlighted on his "Last Week Tonight" show in October 2022. In the episode, the host suggested that the U.S. would basically start to starve if the trucking industry shut down for three days.
"Sorry, three days, every produce department in America would go from a fully stocked market to an all-you-can-eat raccoon buffet," he said. "So it’s no wonder trucking’s a huge industry, with more than 3.5 million people in America working as drivers, from port truckers who bring goods off ships to railyards and warehouses, to long-haul truckers who move them across the country, to 'last-mile' drivers, who take care of local delivery."
The show highlighted how many truck drivers face low pay, difficult working conditions and, in many cases, crushing debt.
"Hundreds of thousands of people become truck drivers every year. But hundreds of thousands also quit. Job turnover for truckers averages over 100%, and at some companies it’s as high as 300%, meaning they’re hiring three people for a single job over the course of a year. And when a field this important has a level of job satisfaction that low, it sure seems like there’s a huge problem," Oliver shared.
The truck-driver shortage is not just a U.S. problem; it's a global issue, according to IRU.org.
"IRU’s 2023 driver shortage report has found that over three million truck driver jobs are unfilled, or 7% of total positions, in 36 countries studied," the global transportation trade association reported.
"With the huge gap between young and old drivers growing, it will get much worse over the next five years without significant action."
Related: Veteran fund manager picks favorite stocks for 2024
bankruptcy bankruptcies pandemic stocks commodities

Wendy’s has a new deal for daylight savings time haters


Watch Live: President Biden Reminds Americans Just How Good They’ve Got It Thanks To Him


Watch: President Biden Delivers The “Darkest, Most Un-American Speech Given By A President”


These Are The 5 Charts The FDIC Does Not Want You Paying Attention To


Interest rates, the best it gets. It’s time to deploy cash


Is the biotech market rally real? Data suggest comeback in private, public markets


People Who Received Ivermectin Were Better Off, Study Finds


COVID-19 May Lead To Persistent Cognitive Impairment, Brain Fog, And Lower IQ Scores


Stock Market’s Top Will Outlast Your Disbelief


Normalise the underlying conditions when “rating” a company’s share price
-

 Uncategorized2 weeks ago
All Of The Elements Are In Place For An Economic Crisis Of Staggering Proportions
-

 Uncategorized1 month ago
Cathie Wood sells a major tech stock (again)
-

 Uncategorized3 weeks ago
California Counties Could Be Forced To Pay $300 Million To Cover COVID-Era Program
-

 Uncategorized2 weeks ago
Apparel Retailer Express Moving Toward Bankruptcy
-

 Uncategorized3 weeks ago
Industrial Production Decreased 0.1% in January
-

 International6 hours ago
Walmart launches clever answer to Target’s new membership program
-

 International1 month ago
War Delirium
-

 Uncategorized3 weeks ago
RFK Jr: The Wuhan Cover-Up & The Rise Of The Biowarfare-Industrial Complex