Connect with us

Uncategorized

Whiskey Rich: Luxury Liquor Trumps Stocks & Art Over Past Decade

Whiskey Rich: Luxury Liquor Trumps Stocks & Art Over Past Decade

Some of the world’s ultra-wealthy spend their money on luxury goods…

Published

on

Whiskey Rich: Luxury Liquor Trumps Stocks & Art Over Past Decade

Some of the world’s ultra-wealthy spend their money on luxury goods such as fine wines, expensive watches, or one-of-a-kind art pieces as a passion, but others consider them investments - and their returns do often end up paying off.

Visual Capitalist's Marcus Lu dives into the 10-year performance of various luxury good classes as of Q4 2023, according to the Knight Frank Luxury Investment Index released as part of the 2024 Wealth Report. The 10-year return of the S&P 500 was included for additional context.

Rare Whisky Bottles Have Outperformed the S&P 500 Since 2013

Knight Frank’s index uses the weighted average of each individual asset, tracking sales of reference brands and pieces for each asset.

Over the past 10 years, rare whisky (or whiskey, depending on where it was made) has been the best performing luxury asset, appreciating by 280% and even besting the S&P 500.

Numerous sale records have been broken at auctions since COVID-19, with collectors sometimes shelling out millions for a single bottle. In November 2023 for example, a bottle of The Macallan Valerio Adami 60 Year Old (of which only 40 bottles were produced) sold for $2.7 million at a Sotheby’s auction. Before bidding commenced, Sotheby’s had given the bottle a high estimate of $1.5M.

Fine wine and luxury watches were the next two best performing luxury goods by 10-year returns, at +146% and +138% respectively.

At the bottom were jewelry (+37%), such as rings and necklaces, and colored diamonds (+8%), including rare pink and blue diamonds.

Tyler Durden Wed, 03/27/2024 - 23:20

Read More

Continue Reading

Uncategorized

Philly Fed: State Coincident Indexes Increased in 49 States in January (3-Month Basis)

From the Philly Fed:

The Federal Reserve Bank of Philadelphia has released the coincident indexes for the 50 states for January 2024. Over the
past three months, the indexes increased in 49 states and decreased in one state, for a three-month diffus…

Published

on

From the Philly Fed:
The Federal Reserve Bank of Philadelphia has released the coincident indexes for the 50 states for January 2024. Over the past three months, the indexes increased in 49 states and decreased in one state, for a three-month diffusion index of 96. Additionally, in the past month, the indexes increased in 39 states, decreased in seven states, and remained stable in four, for a one-month diffusion index of 64. For comparison purposes, the Philadelphia Fed has also developed a similar coincident index for the entire United States. The Philadelphia Fed’s U.S. index increased 0.6 percent over the past three months and 0.2 percent in January.
emphasis added
Note: These are coincident indexes constructed from state employment data. An explanation from the Philly Fed:
The coincident indexes combine four state-level indicators to summarize current economic conditions in a single statistic. The four state-level variables in each coincident index are nonfarm payroll employment, average hours worked in manufacturing by production workers, the unemployment rate, and wage and salary disbursements deflated by the consumer price index (U.S. city average). The trend for each state’s index is set to the trend of its gross domestic product (GDP), so long-term growth in the state’s index matches long-term growth in its GDP.
Philly Fed State Conincident Map Click on map for larger image.

Here is a map of the three-month change in the Philly Fed state coincident indicators. This map was all red during the worst of the Pandemic and also at the worst of the Great Recession.

The map is almost all positive on a three-month basis.

Source: Philly Fed.

Philly Fed Number of States with Increasing ActivityAnd here is a graph is of the number of states with one month increasing activity according to the Philly Fed. 

This graph includes states with minor increases (the Philly Fed lists as unchanged).

In January, 41 states had increasing activity including minor increases.

Read More

Continue Reading

Uncategorized

Accelerating CAR T cell therapy: Lipid nanoparticles speed up manufacturing

For patients with certain types of cancer, CAR T cell therapy has been nothing short of life changing. Developed in part by Carl June, Richard W. Vague…

Published

on

For patients with certain types of cancer, CAR T cell therapy has been nothing short of life changing. Developed in part by Carl June, Richard W. Vague Professor at Penn Medicine, and approved by the Food and Drug Administration (FDA) in 2017, CAR T cell therapy mobilizes patients’ own immune systems to fight lymphoma and leukemia, among other cancers.

Credit: Ann Metzloff

For patients with certain types of cancer, CAR T cell therapy has been nothing short of life changing. Developed in part by Carl June, Richard W. Vague Professor at Penn Medicine, and approved by the Food and Drug Administration (FDA) in 2017, CAR T cell therapy mobilizes patients’ own immune systems to fight lymphoma and leukemia, among other cancers.

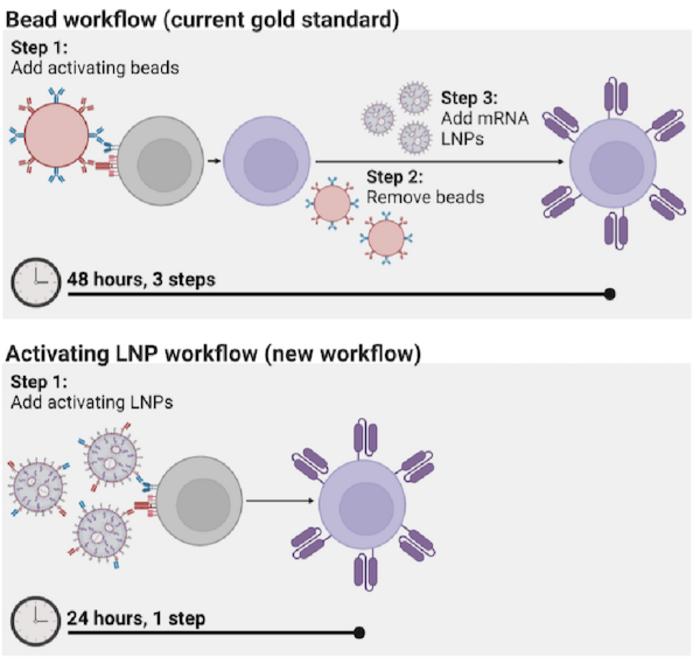
However, the process for manufacturing CAR T cells themselves is time-consuming and costly, requiring multiple steps across days. The state of the art involves extracting patients’ T cells, then activating them with tiny magnetic beads, before giving the T cells genetic instructions to make chimeric antigen receptors (CARs), the specialized receptors that help T cells eliminate cancer cells.

Now, Penn Engineers have developed a novel method for manufacturing CAR T cells, one that takes just 24 hours and requires only one step, thanks to the use of lipid nanoparticles (LNPs), the potent delivery vehicles that played a critical role in the Moderna and Pfizer-BioNTech COVID-19 vaccines.

In a new paper in Advanced Materials, Michael J. Mitchell, Associate Professor in Bioengineering, describes the creation of “activating lipid nanoparticles” (aLNPs), which can activate T cells and deliver the genetic instructions for CARs in a single step, greatly simplifying  the CAR T cell manufacturing process. “We wanted to combine these two extremely promising areas of research,” says Ann Metzloff, a doctoral student and NSF Graduate Research Fellow in the Mitchell lab and the paper’s lead author. “How could we apply lipid nanoparticles to CAR T cell therapy?”

In some ways, T cells function like a military reserve unit: in times of health, they remain inactive, but when they detect pathogens, they mobilize, rapidly expanding their numbers before turning to face the threat. Cancer poses a unique challenge to this defense strategy. Since cancer cells are the body’s own, T cells don’t automatically treat cancer as dangerous, hence the need to first “activate” T cells and deliver cancer-detecting CARs in CAR T cell therapy.

Until now, the most efficient means of activating T cells has been to extract them from a patient’s bloodstream and then mix those cells with magnetic beads attached to specific antibodies — molecules that provoke an immune response. “The beads are expensive,” says Metzloff. “They also need to be removed with a magnet before you can clinically administer the T cells. However, in doing so, you actually lose a lot of the T cells, too.”

Made primarily of lipids, the same water-repellent molecules that constitute household cooking fats like butter and olive oil, lipid nanoparticles have proven tremendously effective at delivering delicate molecular payloads. Their capsule-like shape can enclose and protect mRNA, which provides instructions for cells to manufacture proteins. Due to the widespread use of the COVID-19 vaccines, says Metzloff, “The safety and efficacy of lipid nanoparticles has been shown in billions of people around the world.”

To incorporate LNPs into the production of CAR T cells, Metzloff and Mitchell wondered if it might be possible to attach the activating antibodies used on the magnetic beads directly to the surface of the LNPs. Employing LNPs this way, they thought, might make it possible to eliminate the need for activating beads in the production process altogether. “This is novel,” says Metzloff, “because we’re using lipid nanoparticles not just to deliver mRNA encoding CARs, but also to initiate an advantageous activation state.”

Over the course of two years, Metzloff carefully optimized the design of the aLNPs. One of the primary challenges was to find the right ratio of one antibody to another. “There were a lot of choices to make,” Metzloff recalls, “since this hadn’t been done before.”

By attaching the antibodies directly to LNPs, the researchers were able to reduce the number of steps involved in the process of manufacturing CAR T cells from three to one, and to halve the time required, from 48 hours to just 24 hours. “This will hopefully have a transformative effect on the process for manufacturing CAR T cells,” says Mitchell. “It currently takes so much time to make them, and thus they are not accessible to many patients around the world who need them.”

CAR T cells manufactured using aLNPs have yet to be tested in humans, but in mouse models, CAR T cells created using the process described in the paper had a significant effect on leukemia, reducing the size of tumors, thereby demonstrating the feasibility of the technology.

Metzloff also sees additional potential for aLNPs. “I think aLNPs could be explored more broadly as a platform to deliver other cargoes to T cells,” she says. “We demonstrated in this paper one specific clinical application, but lipid nanoparticles can be used to encapsulate lots of different things: proteins, different types of mRNA. The aLNPs have broad potential utility for T cell cancer therapy as a whole, beyond this one mRNA CAR T cell application that we’ve shown here.”

This study was conducted at the University of Pennsylvania School of Engineering and Applied Science and is supported by the U.S. National Institutes of Health Director’s New Innovator Award (DP2 TR002776), a U.S. National Science Foundation CAREER Award (CBET-2145491), an American Cancer Society Research Scholar Grant (RSG-22-122-01-ET), and a Burroughs Wellcome Fund Career Award at the Scientific Interface. Further support for this paper and the researchers involved came from the Emerson Collective, U.S. National Science Foundation Graduate Research Fellowships, a U.S. National Institutes of Health Ruth L. Kirschstein National Research Service Award (F31CA260922), the National Institute of Dental and Craniofacial Research of the US National Institutes of Health (T90DE030854), the University of Pennsylvania Fontaine Fellowship, the Norman and Selma Kron Research Fellowship, and the Robert Wood Johnson Foundation Health Policy Research Scholars Program. The researchers thank the Human Immunology Core at the University of Pennsylvania (RRID: SCR_022380) for assistance with primary human T cell procurement. The HIC is supported in part by NIH P30 AI045008 and P30 CA016520.

Additional co-authors include Marshall S. Padilla, Ningqiang Gong, Margaret M. Billingsley, Xuexiang Han, David Mai, Christian G. Figueroa-Espada, Ajay S. Thatte, Rebecca M. Haley, Alvin J. Mukalel and Alex G. Hamilton of Penn Engineering; Maria Merolle of Penn Vet; and Mohamad-Gabriel Alameh, Neil C. Sheppard, Carl June and Drew Weissman of the Perelman School of Medicine.


Read More

Continue Reading

Uncategorized

A detailed look at manufacturing, and an update on frieght

  – by New Deal democratAs I wrote on Monday, the big question for this year is whether the recessionary effects of the Fed rate hikes have just been…

Published

on


 - by New Deal democrat


As I wrote on Monday, the big question for this year is whether the recessionary effects of the Fed rate hikes have just been delayed, or whether, because the rate hikes have stopped, so has the headwind they normally produce. Watching manufacturing and construction, especially housing construction, is what I expect to supply the answer.


On Monday I focused on housing construction and sales. Since there’s no big economic news today, let’s take a more detailed look at manufacturing.

There are three manufacturing metrics that are “official” components of the index of Leading Economic Indicators: the ISM manufacturing new orders subindex, average weekly hours of manufacturing workers, and capital goods new orders. Note that since manufacturing makes up less of the US economy than it did in the 20th century, it takes a steeper downturn in these components to be consistent with a recession than it used to.

Let’s start with the ISM manufacturing index and its new orders component, which were last updated at the beginning of this month:


These are in a definite uptrend, although neither has definitively broken above the dividing line of 50 which separates expansion from contraction.

Next, let’s compare capital goods new orders, which were reported yesterday for February (dark blue), with industrial production (red), a premier coincident indicator, and also manufacturing employment from the payrolls survey (gold), all YoY for easier comparison. First, here’s the historical look:


Note that capital goods orders are very noisy (one reason I typically don’t highlight them), and did not turn negative in advance of the Great Recession. Nevertheless, they generally do turn in advance of industrial production, which typically turns in advance of manufacturing employment.

A similar dynamic has existed since the pandemic:


YoY gains in new capital goods orders decelerated first, followed by industrial production, followed last by manufacturing employment. The two first metrics are generally flat YoY, and manufacturing employment is only slightly positive.

Now let’s compare the average manufacturing workweek (black) with capital goods orders, both again YoY and first historically:


The average manufacturing workweek is even more leading than capital goods orders, turning first, but is even more noisy, and over-sensitive to the downside. That is, sharp declines in manufacturing hours always happen before recessions, but a downturn in hours frequently does not presage a recession at all.

Here’s the post-pandemic look at these two metrics:


Hours turned negative first, and if anything are getting “less bad” in recent months, while capital goods new orders, as already indicated, are essentially flat YoY.

Put the data together, and you get a relatively mild manufacturing recession in 2023, which appears to be recovering this year, as the ISM new orders index and the manufacturing workweek are trending higher (if not positive yet), while capital goods orders and production are flat. Manufacturing employment growth -the least leading metric - appears still to be decelerating. 

Before I conclude, let’s take a brief updated look at transportation. Remember, the theory is that everything that is produced must be shipped to market. So to confirm a trend, both should be moving in the same direction.

Here is the Freight Transportation Index through January (dark blue), the noisier and more negatively biased Cass Transportation Index (light blue), compared with heavy weight truck sales which has been an excellent leading indicator (red):


In February, preliminarily there was a steep drop in excess of -3.5% in the Freight Transportation Index, but it has not been updated at FRED, possibly because at least one component (air freight) was withheld pending further seasonal adjustments.

There was a steep drop off in all of these metrics late last year following the Yellow Freight bankruptcy. The Cass Index and truck sales may be showing the beginning of a recovery from that, although the data is too noisy to say anything definitive.

One final note: we’ll bet a detailed updated look at the spending side of construction and production via the personal spending report this Friday.

Read More

Continue Reading

Trending