Uncategorized
NIH Refuses To Release Details Of COVID-19 Vaccine Royalty Agreement
NIH Refuses To Release Details Of COVID-19 Vaccine Royalty Agreement
Authored by Zachary Stieber via The Epoch Times (emphasis ours),
The…
Share this:


Authored by Zachary Stieber via The Epoch Times (emphasis ours),
The U.S. National Institutes of Health (NIH) is refusing to release additional information about an agreement it reached over a COVID-19 vaccine that has earned it at least $400 million.
The NIH declined to provide any materials in response to a Freedom of Information Act request from The Epoch Times.
“The NIH withholds the entirety of the records as they are protected from release,” Gorka Garcia-Malene, an NIH officer, told The Epoch Times in a letter.
She cited an exemption outlined in the act that allows government agencies to partially or fully withhold information.
“In this case, exemption 3 incorporates 35 U.S.C. 209 (f), which reads in relevant part, ‘No Federal agency shall grant any license under a patent or patent application on a federally owned invention unless the person requesting the license has supplied the agency with a plan for development or marketing of the invention, except that any such plan shall be treated by the Federal agency as commercial and financial information obtained from a person and privileged and confidential and not subject to disclosure under section 552 of title 5,’” Ms. Garcia-Malene wrote.
“Exemption 4 protects from disclosure trade secrets and commercial or financial information that is privileged and confidential,” she added.
In February 2023, Moderna announced that it had paid $400 million to the NIH and would make additional payments in the future as part of a licensing agreement for spike proteins used in the company’s COVID-19 vaccine. The Epoch Times obtained a copy of the contract, which confirmed the payment but redacted details of the future payments.
The Epoch Times then lodged a new request, seeking more details about the future payments, which are said to be based on how many COVID-19 vaccines are sold.
Ms. Garcia-Malene was responding to the new request.
James Love, director of the nonprofit Knowledge Ecology International, said the information should be made public.
“The NIH put out several press statements about the royalty dispute with Moderna, and they should not now claim it is some secret confidential information. And when hundreds of millions of dollars are at stake, the public interest in transparency is large too,” Mr. Love told The Epoch Times in an email.
“There are a lot of NIH officials who resent transparency,” he added.
Inquiries to NIH spokespersons received away messages. Another request for comment, sent to one of the addresses provided in the away messages, was not returned.
The Epoch Times plans to appeal the NIH’s decision.
The NIH is one of several government agencies that receive royalty payments. Officials there have fought against attempts to acquire information on these payments, but in 2023, they disclosed some $325 million in royalties received between 2009 and 2020 after being sued.
Some experts say the payments, made to the agency and many of its top scientists, should be stopped.
“Neither the government nor any government employee should have any financial interest in a product for which the government has any involvement in licensing or promoting,“ Aaron Siri, managing partner of Siri & Glimstad LLP, told The Epoch Times in an email. ”It creates a dangerous conflict of interest.”
Move on BioNTech
The NIH is trying to obtain more money from COVID-19 vaccine manufacturers, according to recent filings.
BioNTech, Pfizer’s partner, said in the forms that the NIH served it with a notice of default because the NIH’s position is that BioNTech owes it money from COVID-19 vaccine sales.
BioNTech said it does not think it owes the NIH money but that “the ultimate outcome of these matters is uncertain and we cannot guarantee that our interpretation of these license agreements will prevail, or that we will not ultimately need to pay some or all of the royalty and other related amounts in dispute.”
The NIH did not return inquiries on the BioNTech filings.
The NIH has said previously it licensed its spike protein technology to BioNTech for the Pfizer-BioNTech COVID-19 vaccine.
The Epoch Times has submitted a Freedom of Information Act request for the notice of default and related documents. Another request seeks information on whether the NIH has threatened or served Pfizer with a similar notice.
However much money the U.S. government receives in royalties will be much less than it has paid for the vaccines. The government has purchased hundreds of millions of shots, spending north of $30 billion.
Uncategorized
Bitcoin’s resilience tested: Price up 577% amid pandemics, war and corporate embrace
Quick Take As we approach the Bitcoin halving and bid farewell to the current epoch, it is crucial to reflect on the events that have transpired since…
Share this:

Quick Take
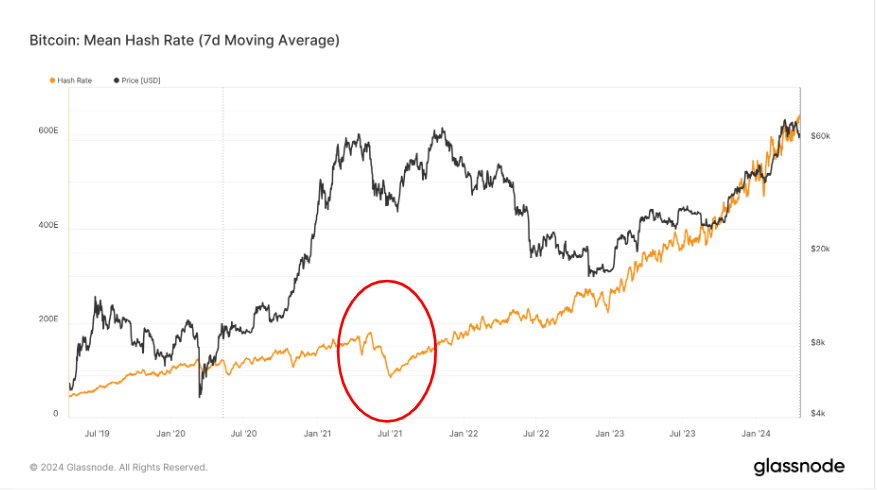
As we approach the Bitcoin halving and bid farewell to the current epoch, it is crucial to reflect on the events that have transpired since the previous halving in May 2020. The world has witnessed a series of significant events that have shaped the economic landscape and influenced the adoption of Bitcoin.
The COVID-19 pandemic, which began in March 2020, had a detrimental effect on the global economy throughout the entire cycle. The aftermath of the pandemic has led to severe inflation and currency debasement, the effects of which are still felt today.
In August 2020, Michael Saylor, then CEO of MicroStrategy, made a bold move by adopting Bitcoin, resulting in the company accumulating more than 1% of the total Bitcoin supply as of April 2024. The FASB introduced rules that will positively influence corporate adoption by establishing fair value accounting for Bitcoin in corporate treasuries.
El Salvador made history by making Bitcoin legal tender and implementing a dollar-cost averaging (DCA) approach to acquiring the digital asset.
China’s ban on Bitcoin in the summer of 2021 caused a significant drop in the hash rate, which plummeted by approximately 50%.
Geopolitical tensions escalated, with multiple wars and invasions occurring, most notably Russia’s invasion of Ukraine in February 2022 and the recent conflict in the Middle East.
The introduction of Bitcoin ordinals paved the way for the launch of Runes at block 840,000.
This cycle also marked the first time that the balance of Bitcoin on exchanges decreased, indicating a shift in investor behavior.

In this cycle, the digital asset exchange FTX collapsed alongside several crypto lending platforms like Celsius and BlockFi.
In January 2024, the launch of Bitcoin ETFs became an instant success, further solidifying Bitcoin’s position in the financial world.
Other notable events included the highest inflation and interest rates in recent history, reminding us that while the future remains unpredictable, the limited supply of 21 million Bitcoin remains a constant.
Despite the challenges and events that have unfolded, Bitcoin has surged an impressive 577% since the last halving.

The post Bitcoin’s resilience tested: Price up 577% amid pandemics, war and corporate embrace appeared first on CryptoSlate.
bitcoin crypto pandemic covid-19 cryptoUncategorized
The bifurcation of the new vs. existing home markets continues
– by New Deal democratThe bifurcation of the new vs. existing home markets continued in March, per the report on existing home sales and prices yesterday….
Share this:

- by New Deal democrat
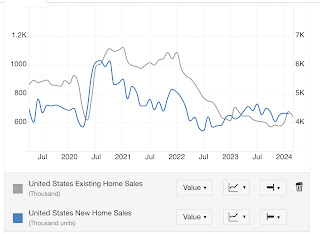
The bifurcation of the new vs. existing home markets continued in March, per the report on existing home sales and prices yesterday. Remember that, unlike existing homeowners, house builders can vary square footage, amenities, lot sizes, and offer price and/or mortgage incentives to counteract the effect of interest rate hikes.
On a seasonally adjusted basis, existing home sales declined from 438,000 to 419,000 in March. But this is well within the seasonally adjusted range of the past 16 months (gray, right scale in the graph below){also, note I am using Trading Economics graphs due to restrictions put on FRED by the Realtors; also note difference in scales):


Uncategorized
Economic Warning From The NFIB
The latest National Federation of Independent Business (NFIB) survey was an economic warning that departed widely from more robust governmental reports….
Share this:


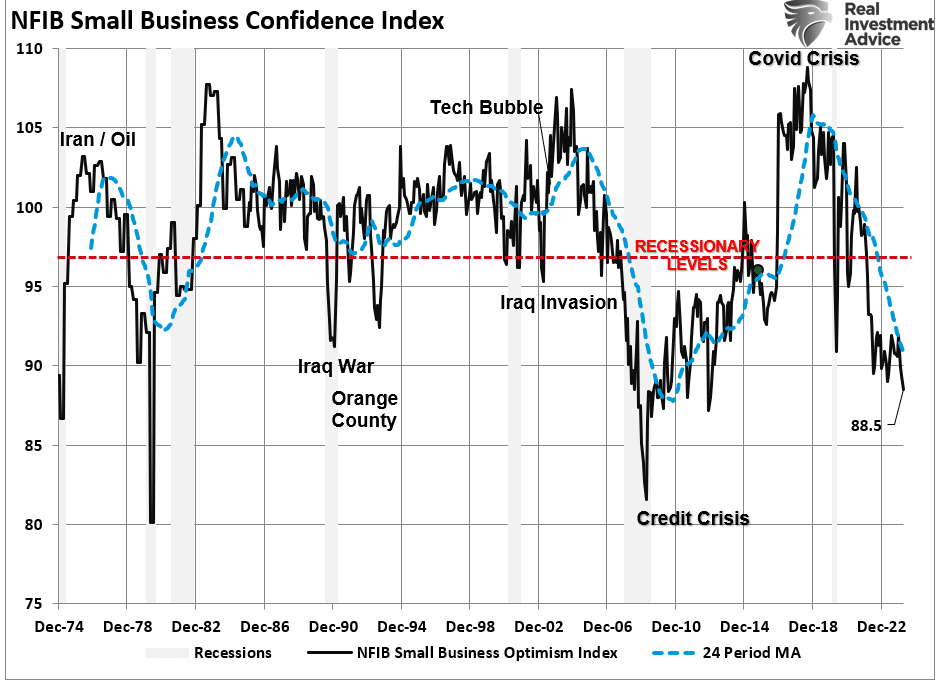
The latest National Federation of Independent Business (NFIB) survey was an economic warning that departed widely from more robust governmental reports. In a recent analysis of small businesses, we discussed the importance those business owners play in the economy.
“It is crucial to understand that small and mid-sized businesses comprise a substantial percentage of the U.S. economy. Roughly 60% of all companies in the U.S. have less than ten employees.
Small businesses drive the economy, employment, and wages. Therefore, the NFIB’s statements are highly relevant to the economy’s current state compared to the headline economic data from Government sources.”
While recent government data on economic growth and employment remain robust, the NFIB small business confidence survey declined in its latest reading. Not only did it fall to the lowest level in 11 years, but, as far as an economic warning goes, it remained at levels historically associated with a recessionary economy.
The decline in confidence should be unsurprising given the largest deviation of interest rates from their 5-year average since 1975. Higher borrowing costs impede business growth for small businesses, as they don’t have access to the bond market like major companies.

Therefore, as the economy slows and interest rates rise, small business owners turn to their local banks for operating loans. However, higher rates and tighter lending standards make access to capital more difficult.

Of course, given that capital is the lifeblood of any business, decisions on hiring, capital expenditures, and expansion hang in the balance.
Economic Warning – Capital Expenditures
It should be unsurprising that if the economy were expanding as quickly as headline data suggests, business owners would be expending capital to increase capacity to meet rising demand. However, in the most recent NFIB report, the percentage of business owners planning capital expenditures over the 3-6 months dropped to the lowest level since the pandemic-driven shutdown.

Again, given that small businesses comprise about 50% of the economy, there is more than just a casual relationship between their capital expenditure plans (CapEx) and real gross private investment, which is part of the GDP equation.

In other words, if small businesses cut back on CapEx, this will eventually translate into slower rates of private investment and, ultimately, economic growth in coming quarters.

As shown, the correlation between small business CapEx plans and economic growth should not be dismissed. While mainstream economists are becoming increasingly optimistic about an “economic reflation,” the economic warning between real GDP and CapEx suggests caution.

Of course, if small businesses are unwilling to increase CapEx, it is because there is a lack of demand to justify those expenditures. Therefore, if CapEx is falling, we should expect economic warnings from employment and sales.
Something Amiss With Sales
Many reasons feed into a small business owner’s decision NOT to invest in their business. As noted above, tighter bank lending standards and increased borrowing costs certainly weigh on that decision. However, if “business is booming,” business owners will find the capital needed to meet increased demand. However, looking deeper into the NFIB data, we find rising concerns about the “demand” side of the equation.
The NFIB publishes several data points from the survey concerning the “concerns” small business owners have. These cover many concerns, from government regulations to taxes, labor costs, sales, and other concerns confronting business owners. When it comes to the “demand” side of the equation, there are three crucial categories:
- Poor sales (demand),
- Cost of labor (the most significant expense to any business), and
- Is it a “Good time to expand?” (Capex)
In the chart below, I have inverted “Good time to expand,” so it correlates with rising concerns about the cost of labor and poor sales. What should be obvious is that the average of these concerns escalates as economic growth weakens (recessionary periods) and falls during economic recoveries. Currently, these rising concerns should provide an economic warning to economists.

Examining sales and employment figures can help us understand why business owners remain pessimistic about the overall economy. The chart below shows the NFIB members’ sales expectations over the next quarter compared to the previous quarter. The black line is the average of both with a long-term median.
Unsurprisingly, business owners are always optimistic that sales will improve in the next quarter. However, actual sales tend to fall short of those expectations. The two have a very high correlation, which is why the average of both provides valuable information. Sales expectations and actual sales are well below levels typically witnessed during recessions. With sales (demand) weak, there is little need to increase production (supply) substantially.

Here is the economic warning to pay attention to. Real retail sales comprise about 40% of personal consumption expenditures (PCE), roughly 70% of the economic growth rate. The decline in the average of actual and expected sales of small businesses suggests weaker retail sales and, by extension, a slower economic growth rate.

Employment Warning
The demand side of the economic equation is crucially important. If the demand for a business owner’s products or services declines, there is little need to increase employment. Therefore, if economic growth was as robust as headlines suggest, why are small businesses’ plans to increase employment declining sharply?

Furthermore, when demand falls, business owners look to cut operating costs to protect profitability. While cutting future employment is part of that equation, so are plans to raise worker compensation.

The last chart is crucial. The U.S. is a consumption-based economy. However, consumers can not consume without producing something first. Production must come first to generate the income needed for that consumption. The cycle is displayed below.

As employees receive fewer compensation increases (raises, bonuses, etc.) amid rising living costs, they cut consumption, which translates into slower economic growth rates. In turn, business owners cut employment and compensation further. It is a virtual spiral that historically ends in recession.
While this time could certainly be different, the economic warnings from the NFIB survey should not be dismissed. The data could explain why the Fed is adamant about cutting rates.
The post Economic Warning From The NFIB appeared first on RIA.
recession pandemic economic growth fed gdp interest rates

Bitcoin’s resilience tested: Price up 577% amid pandemics, war and corporate embrace


Economic Warning From The NFIB


The bifurcation of the new vs. existing home markets continues


Bankrupt nationwide retailer closes several more stores


“We’re not shoving anything down anyone’s throat,” Ford exec says about EVs


In the Good Old Days, One Fourth of Income Went to Food


Huge Bond Wagers Make Some Hedge Funds Too-Big-To-Fail, IMF Warns


Initial jobless claimZzzzzzzzzz . . . .


Realtor.com Reports Active Inventory UP 29.1% YoY; New Listings Up 7.2% YoY


NIH Refuses To Release Details Of COVID-19 Vaccine Royalty Agreement
-

 International4 weeks ago
Parexel CEO to retire; CAR-T maker AffyImmune promotes business leader to chief executive
-

 Government2 weeks ago
Climate-Con & The Media-Censorship Complex – Part 1
-

 International5 days ago
WHO Official Admits Vaccine Passports May Have Been A Scam
-

 Spread & Containment2 weeks ago
FDA Finally Takes Down Ivermectin Posts After Settlement
-

 Uncategorized3 weeks ago
Vaccinated People Show Long COVID-Like Symptoms With Detectable Spike Proteins: Preprint Study
-

 Uncategorized2 weeks ago
Can language models read the genome? This one decoded mRNA to make better vaccines.
-

 Uncategorized2 weeks ago
What’s So Great About The Great Reset, Great Taking, Great Replacement, Great Deflation, & Next Great Depression?
-

 Uncategorized3 days ago
Red States Fight Growing Efforts To Give “Basic Income” Cash To Residents