Uncategorized
While the Austin housing market isn’t sizzling, agents say it is still warm
Despite an uptick in inventory, Austin metro area home prices are holding steady and giving agents confidence in the strength of the market
Share this:

It is nearly April, which means temperatures in the Austin metropolitan area are heating up — and so is the housing market.
But like the temperatures, which are far from the triple-digit figures the residents of the Texas state capital will see in the coming months, local real estate professionals say that even though the market is warming up, it is nowhere near the frenzy at the height of the COVID-19 pandemic.
“The market is still strong,” said Wendy Cash, a broker at Austin area-based Century 21 Hellmann Stribling. “Buyers are still buying and sellers are still selling. We definitely noticed a downturn last year, which coincided with interest rates going up, and buyers just put the brakes on things and wanted to wait to see what was going to happen.
“When interest rates took a dig late in the fall, buyers came back out of the woodwork and started buying again. But I don’t thing we are ever going to see something like we did during the pandemic again.”
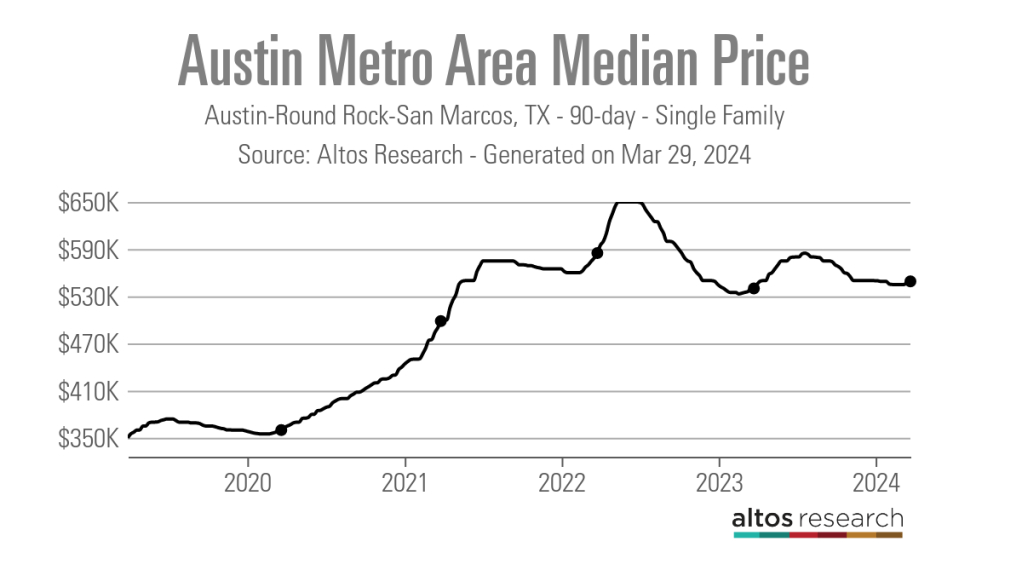
From 2020 until the middle of 2022, the Austin metro area was turning heads for its massive influx of homebuyers and its exponential home price growth. In early March 2020, prior to the onset of the pandemic, the 90-day average median list price for a single-family home in the area was $357,000. By late May 2022, this figure had risen to $650,000, according to data from Altos Research.
What ensued next was a rapid cooldown, which saw the median list price fall by more than $100,000 by mid-February 2023 to $533,000.
“April and May of 2022 is when we felt the first slowdown,” said Scott Michaels, an Austin-based Compass agent. “Looking at the number, 2023 was the lowest year in the past 28 years for sales, so it was a bit of an oddity compared to what we’d seen in the second half of 2020, all of 2021 and the first half of 2022.”
While Austin has made headlines in recent months for the number of homebuyers looking to move away from the metro area, local real estate professionals say that buyer demand remains strong.
“Interest rates have come down a little bit and kind of settled. We aren’t seeing the volatility we were, and I think that has made buyers a little more willing to make the leap and purchase a home,” Cash said. “Then, obviously, spring is kind of your traditional selling season, so there are more buyers typically in the spring, plus not as many people pulled the trigger last fall, so we have that pent-up demand.”
Michaels also noted that his business is still seeing a steady stream of out-of-town buyers.
“We are still seeing people move from all over the country, whether it is first-time or move-up buyers within Austin or people from Dallas, Houston, and then feeder markets like California, New York, Chicago, and we are seeing quite a few from the Seattle region right now,” Michaels said.
Agents highlight the stability of the Austin metro area’s median list price, which has hovered around $550,000 since early November 2023, as evidence of the still-strong level of demand in the market.
“Overall, things are kind of continuing from where they were in 2023 with a very modest change in the median sales price. And closed sales were also up about 1%, so overall just a little bit more of the same,” said Clare Losey, housing economist for the Austin Board of Realtors.
“What we saw during the COVID pandemic was just really unsustainable over a long-term basis. We had artificial demand that was induced by the pandemic itself — low interest rates, work from home, vacation homes — and it really drove demand that we otherwise would not have seen if the pandemic had not happened.”
Additionally, Austin’s median list price has remained stable even as inventory has risen drastically from the troughs it reached in the spring months of 2021 and 2022.
As of March 22, 2024, the 90-day average median number of active single-family listings in the Austin metro area was 6,895 — up from an all-time low of 1,070 listings in April 2021. In November 2023, this figure actually surpassed its pre-pandemic level at 8,527 listings.

“I think we are pretty balanced,” Cash said. “Technically we are still in a seller’s market. I feel like the market we are in, from an inventory standpoint, feels similar to last year.”
According to Losey, much of the new inventory coming on the market in Austin is suitable for first-time homebuyers.
“It is going to be a more popular homebuying season for first-time buyers,” Losey said. “There is just more inventory on the market that is within the most affordable price range, meaning homes priced under $300,000. In February, we saw an overall uptick of 45% in new listings on a year-over-year basis, but we saw a 27% increase in homes prices under $300,000.”

Even with the uptick in inventory, agents say they are still seeing properties receive multiple offers and go for more than the asking price.
“I occasionally see houses go for over ask, but not like they did during the pandemic,” Cash said. “A house may go for $10,000 or $20,000 over, and the multiple offers are like two or three offers and not the 15 to 20 offers.”
Michaels added that properties in popular neighborhoods that are priced correctly are still going within the first week they hit the market.
“If you are in an area where there is more inventory on the market, it may tend to sit a little bit longer,” Michaels said. “If it is priced at a higher price point, it may also sit a bit longer because your buyer pool is smaller, so that is a challenge for more of the luxury properties that are going up.”
While the Austin housing market may have cooled down from its post-pandemic heyday, local professionals remain bullish about the future of their metro area and housing market.
“Austin is just one of the premier areas of the country where people want to live or relocate to for a variety of reasons,” Michaels said. “There is great job growth, it is a vibrant city, there are beautiful rolling hills, the lakes, but also people are just sick of sitting on the sidelines and waiting for a market shift. They’ve been waiting for almost two years now, so they are just ready to pull the trigger and make the jump, and we are here for them.”
real estate housing market pandemic covid-19 interest ratesUncategorized
Real personal income and spending: if last month was “Goldilocks”, this month was close to “anti-Goldilocks”
– by New Deal democratPersonal income and spending has become one of the two most important monthly reports I follow, because it nets out the impacts…
Share this:

- by New Deal democrat
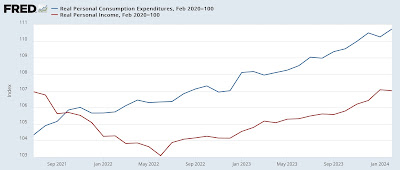
In February, nominally income rose 0.3%, while nominal spending rose a sharp 0.8%. Prices as measured by the PCE deflator increased 0.3% for the month, meaning that in real terms income were unchanged and spending (after rounding) rose 0.4%. Since just before the pandemic real incomes are up 7.0%, and spending is up 10.7% (NOTE: Data in all graphs below except for YoY comparisons, and the personal saving rate, is normed to 100 as of just before the pandemic):
On a YoY basis, the PCE price index is up 2.5%, just above January’s three year low of 2.4%. In the previous 16 months, the YoY measure had been declining at the rate of 0.25%/month, suggesting that it would hit the Fed’s 2.0% target this spring:

This month’s slight increase is probably just noise due to rounding, as the monthly change in the YoY rate was only 0.02%.
As I indicated above, for the past 50+ years, real spending on services has generally increased even during recessions. It is real spending on goods which declines. Last month real services spending rose 0.6%, while real goods spending rose 0.1%:

As per form, real services spending has risen consistently since the pandemic, while goods spending has been somewhat of a mirror image of gas prices, which peaked in June 2022.


Uncategorized
America’s Minsky Moment Approaches
America’s Minsky Moment Approaches
Authored by Michael Wilkerson via The Epoch Times,
Named after American economist Hyman Minsky, the idea…
Share this:


Authored by Michael Wilkerson via The Epoch Times,
Named after American economist Hyman Minsky, the idea behind a Minsky moment is that a financial markets crisis (especially in credit markets) is caused by a sudden and systemic collapse in asset prices, usually after a sustained period of speculative investment, excessive borrowing, and widespread financial risk taking.
In other words, it’s the moment when the music stops playing, investors stop buying, and the Ponzi game ends abruptly. It’s a hard crash.
America may be on the brink of its Minsky moment.
This process, which moves from slowly, slowly, to suddenly and now, goes back decades.
The confrontation with reality that was required to put America’s economic house back in order after the global financial crisis of 2008–09 was deferred to a later date by politicians, central bankers, and government officials alike, presumably when they would no longer be around.
Instead of taking the painful but necessary steps of liquidation—i.e., allowing more over-levered and risk-heavy banks and financial firms to fail, and for the economy to take the short-term pain, then move on—the U.S. government and the Federal Reserve kicked the can down the road by massive money-supply expansion and unproductive government spending.
The same playbook from the financial crisis (i.e., money printing and fiscal excess) was used again in 2020 in response to the pandemic. As the monetary authorities had but one instrument in their toolbox—the blunt-force cudgel of money-supply growth—it was the go-to solution.
As the saying goes, when the only tool available is a hammer, every problem looks like a nail. In both instances—the financial crisis and COVID periods), the U.S. Congress went on a massive spending spree, not realizing (or, as political animals with short time horizons, not caring) that excess and repeated deficit spending, and the debt creation needed to fund it, would eventually spiral out of control and doom future generations.
While a more serious collapse of the bubble—a monetary Great Reset—was avoided in 2008–09, the underlying conditions were not resolved.
The monetary and fiscal actions taken at the time only postponed the crisis and, worse, further inflated a massive bubble that is destined to eventually burst.
We are still living in this bubble, evidenced by all-time highs in equity and crypto markets, speculation in numerous asset classes from real estate to collectibles to memecoins, and “get what you can while you can” borrowing by governments, households, and corporates alike.
Given the increasing magnitude (in both nominal and real terms) of the debt problem, a financial crisis in 2024 or 2025 will have much worse consequences than anything that would have happened at the time of the financial crisis 15 years ago.
On the eve of the 2008 crisis, U.S. federal debt to GDP was around 64 percent, the same level as in 1995. This allowed some flexibility. As of the most recent quarter, the ratio of debt to GDP is now nearly double that, at 122 percent.
On this measure, the United States is now among the top 10 most indebted countries in the world, a peer group that includes economically hobbled nations such as Venezuela, Greece, Italy, and sclerotic Japan.
The level of U.S. national debt, quickly approaching $35 trillion in coming months, now requires more than $1.1 trillion in interest payments annually just to service it. And this number doesn’t include state and municipal debt or the unfunded liabilities and entitlements such as Medicare and Social Security that now comprise the substantial majority of the federal budget, limiting anyone’s ability to shrink the deficit through a reduction in discretionary spending.
The deficit for 2024 is tracking at $1.7 trillion, adding to the existing cumulative U.S. deficit of $22 trillion since 2001. The deficit matters in part because high deficits relative to GDP are strongly correlated with persistent inflation.
Since 2020, the United States has run the highest levels of deficits (as a percent of GDP) since World War II. Those deficits produced high inflation, but they also reversed and became budget surpluses shortly after the war ended. This was made possible because of the productivity miracle that was mid-twentieth century America.
The United States of 2024 has no equivalent productivity boost waiting in the wings. Artificial intelligence is one bright spot, but other tech (crypto in particular), energy, and mining industries are each being chased off-shore through regulatory interference.
Manufacturing is attempting a comeback, but only represents 11 percent of GDP. Bureaucratic, tax, monetary (the U.S. dollar remains too high to be competitive), and other barriers persist. The continued growth (as a percent of GDP) of financial advisors, personal injury attorneys, and tax accountants needed to navigate the impossible IRS tax code hardly comprise the revolutionary army needed to make the American economy great again.
When the Minsky moment arrives, the U.S. government will have no ability to confront it save for a resumption of quantitative easing and other forms of money printing.
With the bond markets in turmoil, investors will be increasingly reluctant to buy more U.S. debt. Foreign buyers have already begun reducing their exposure, and now account for only 30 percent by value of U.S. Treasurys held, compared with 45 percent in 2013.
If this divestment trend suddenly accelerates, the United States will be forced to monetize its debt through Federal Reserve purchases of U.S. Treasurys. This will be highly inflationary, even as economic conditions are weakening and unemployment is rising.
The U.S. Department of the Treasury and the Federal Reserve have already committed to a “whatever it takes” approach to crisis management. When the Minsky moment arrives, and the bond markets are in meltdown, the “whatever it takes” will primarily be a firehose of liquidity (more money created out of thin air) to the banking system with an alphabet soup of program names.
As a result, the United States will be forced to accept significantly higher levels of inflation. The alternatives are just too severe. The U.S. government, as the issuer of the world’s reserve currency, cannot default. There is a practical limit on how high it can take the visible tax rate. Its only alternative is the hidden tax of ever-higher inflation.
To avoid this outcome, U.S. productivity would have to dramatically increase such that the ratio of debt to GDP falls back in line. This seems an impossibility. The higher the ratio of debt to GDP, the greater the anchor-like drag on the national economic ship.
Uncategorized
Stocks, Gold, & Crypto Soar In Q1 Despite Rout In Rate-Cut Expectations
Stocks, Gold, & Crypto Soar In Q1 Despite Rout In Rate-Cut Expectations
Q1 macro was characterized by a vast divergence between ‘soft’…
Share this:

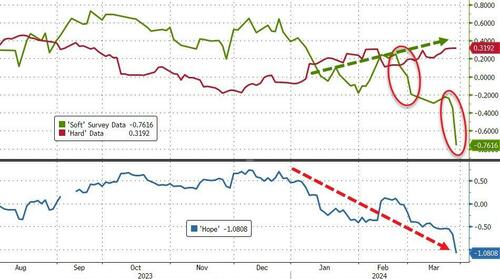
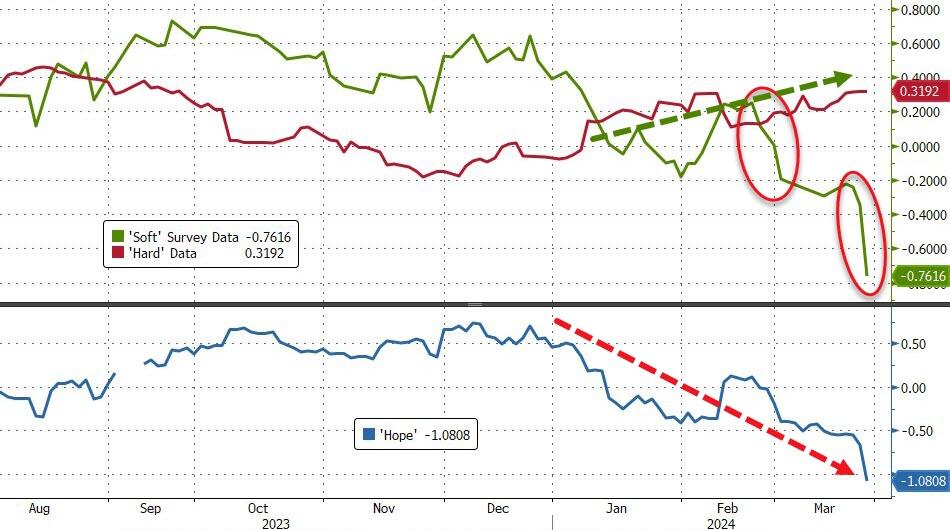
Q1 macro was characterized by a vast divergence between 'soft' surveys crashing as 'hard' data drifting higher...
Source: Bloomberg
The strong 'hard' data - and sticky inflation - along with endless jawboning, drove rate-hike expectations drastically lower in Q1. 2024 expectations for The Fed crashed from almost seven cuts to less than three...
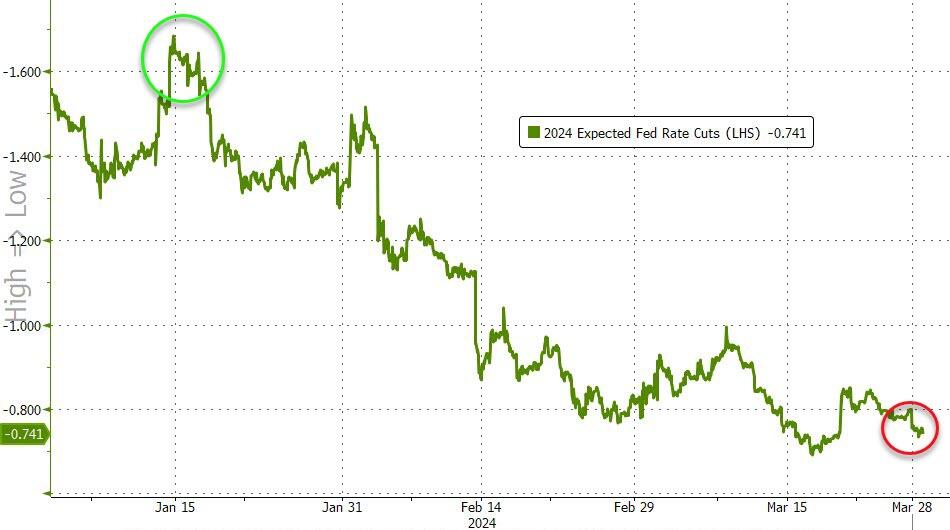
Source: Bloomberg
...and stocks did not even blink!
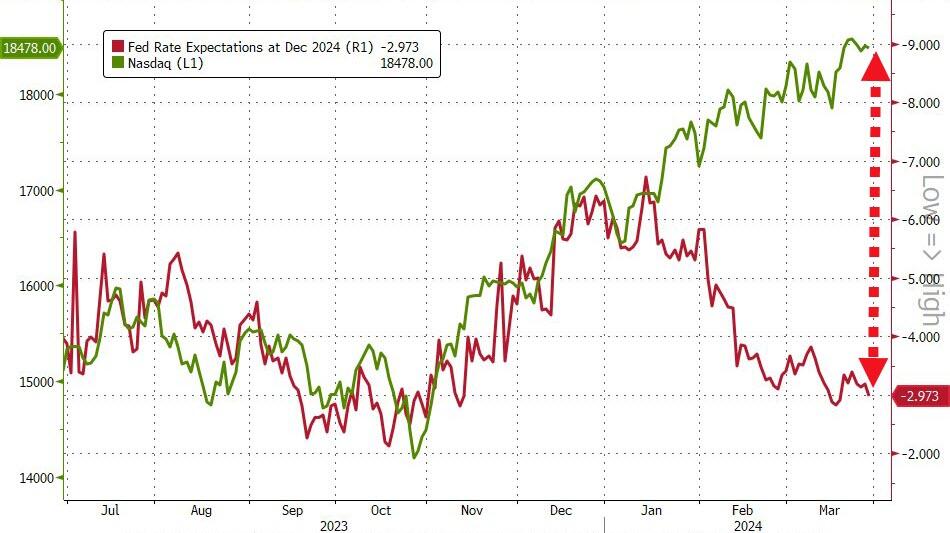
Source: Bloomberg
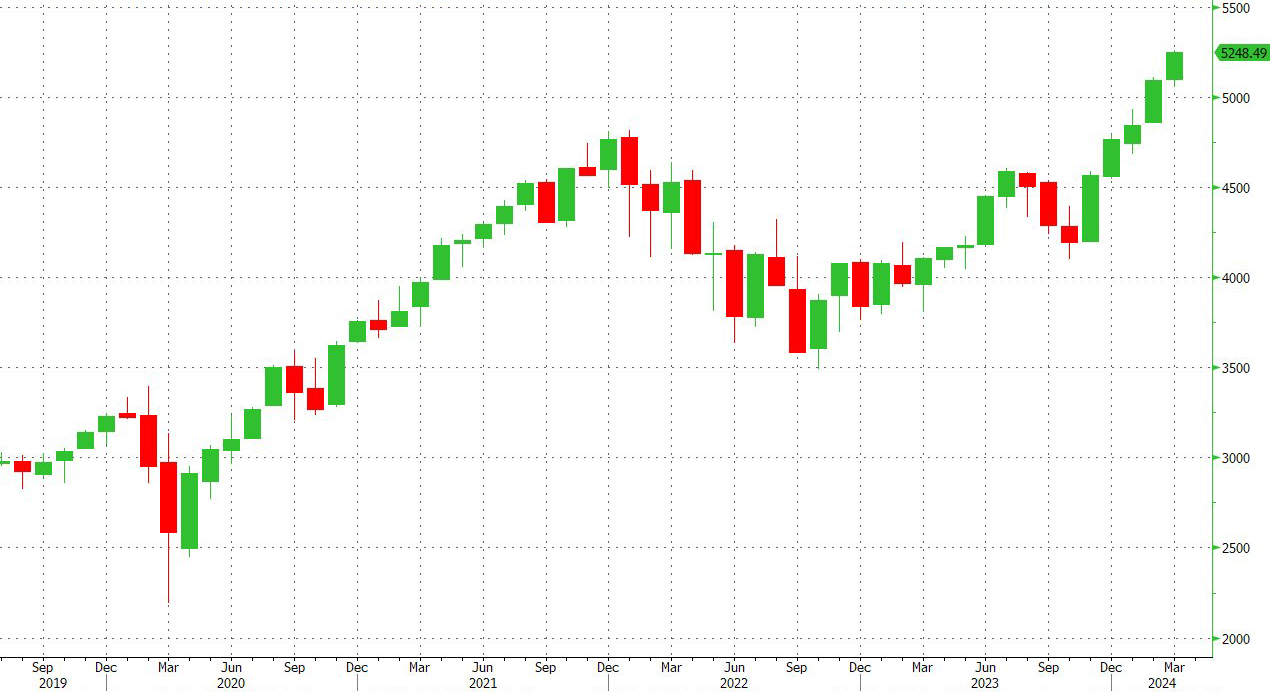
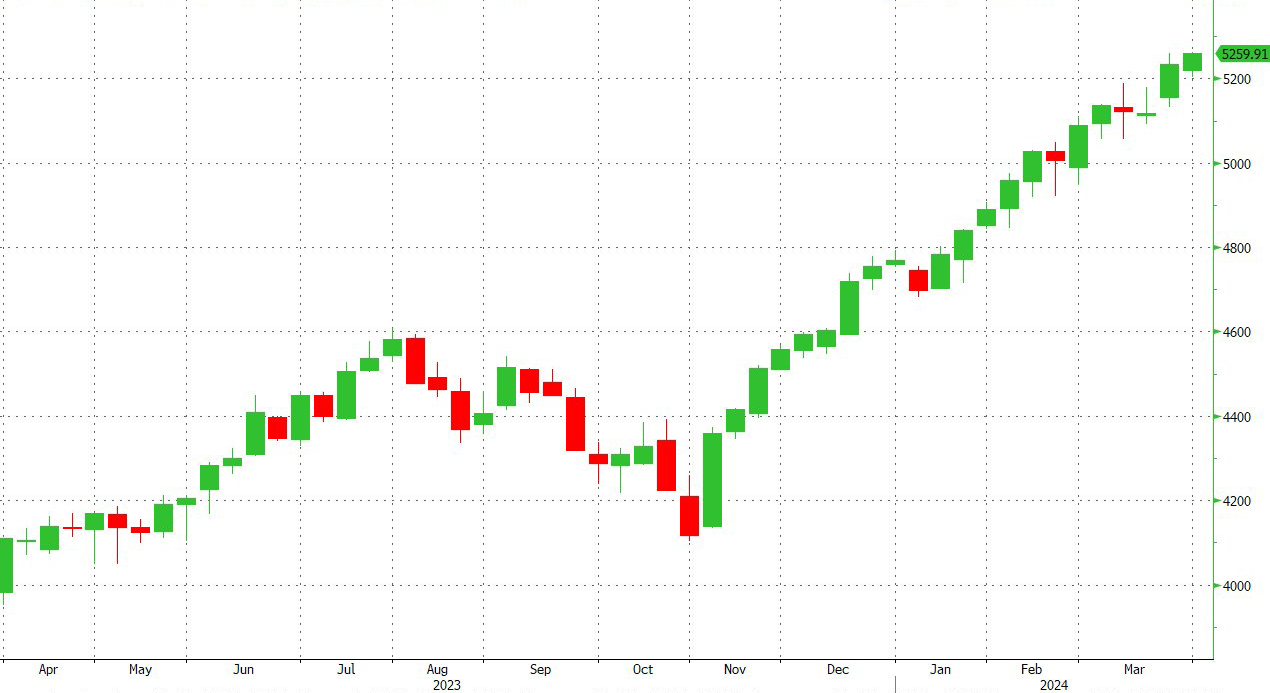
With the S&P 500 surging to its best start to a year since 2019 (outperforming Nasdaq)...
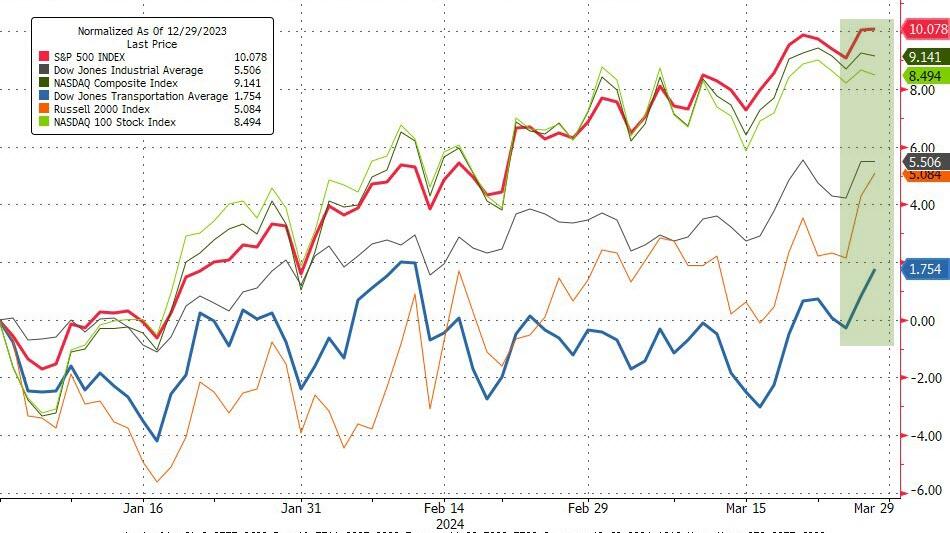
Source: Bloomberg
That's the 5th green month in a row...
Source: Bloomberg
And stocks are up for 18 of the last 22 weeks (it hasn't done more than that since 1989)...
Source: Bloomberg
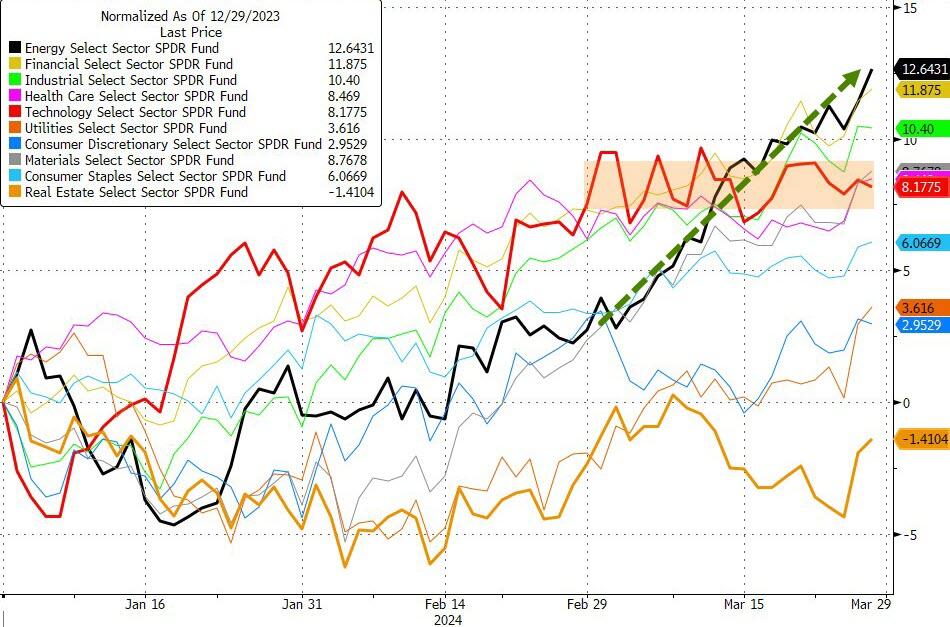
Notably, and perhaps surprisingly, Q1's best performing sector was not tech... it was Energy (with Real Estate the only sector red in Q1). In fact in March, Energy stocks are up 10% while Tech is unchanged...
Source: Bloomberg
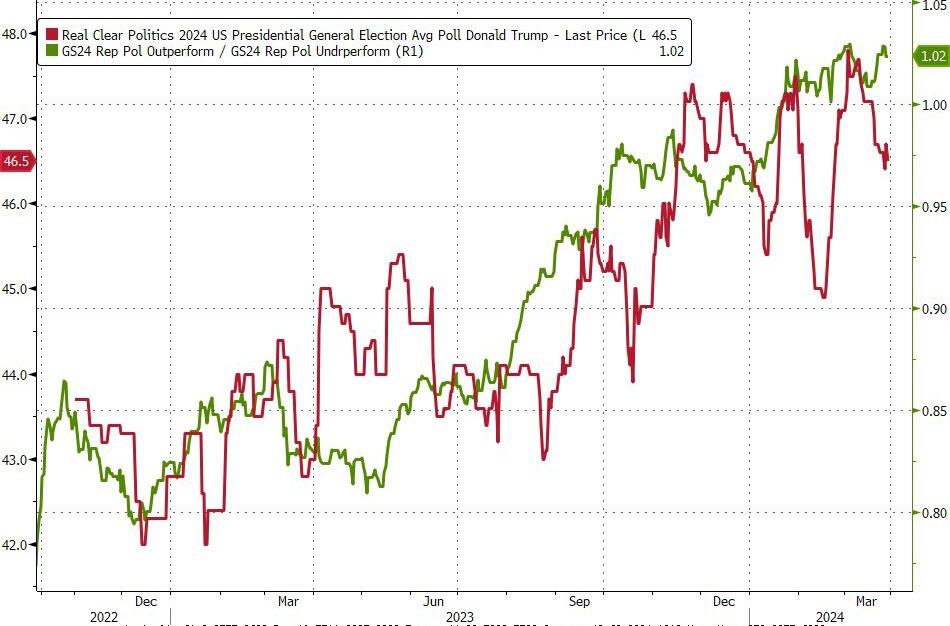
Some have argued that Q1's market strength reflects a growing belief that Republicans will win in November...
Source: Bloomberg
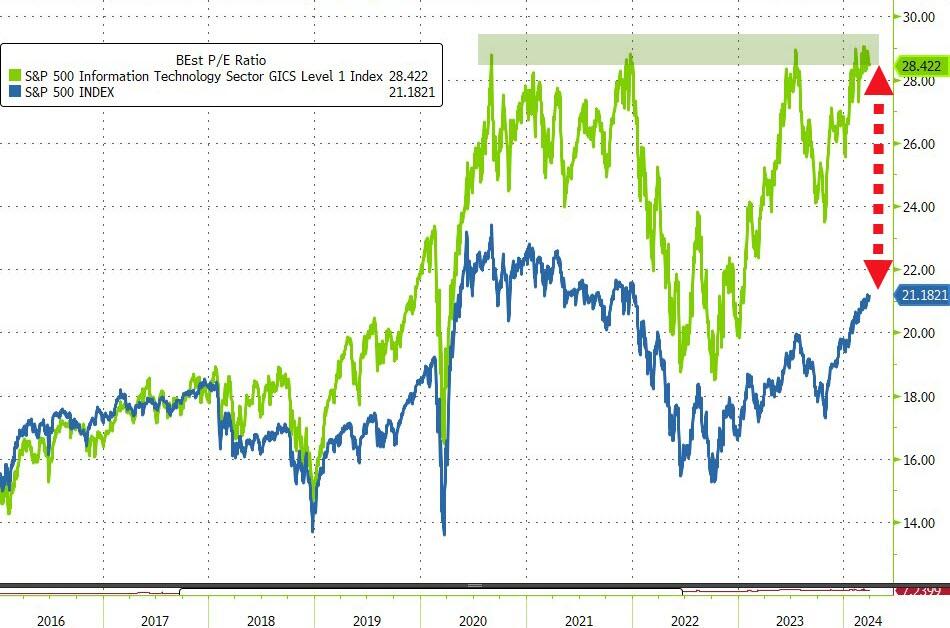
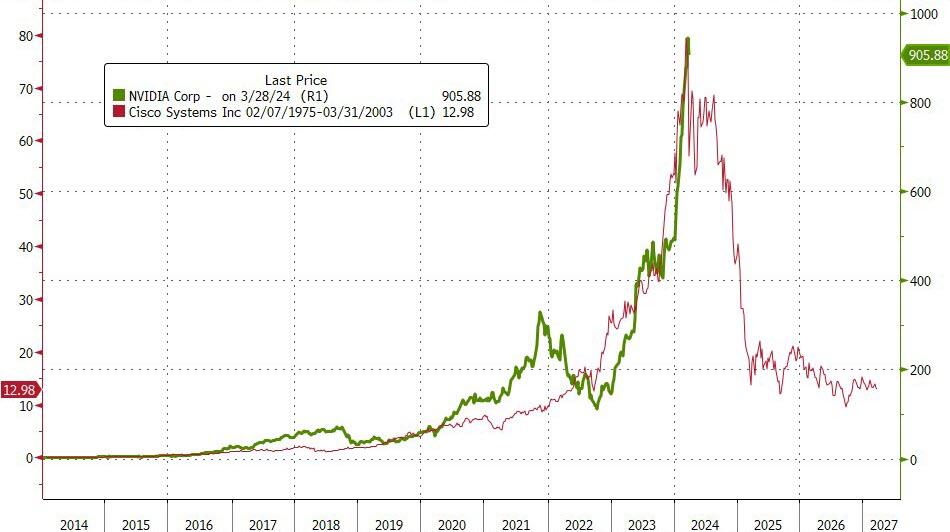
And don't let anyone tell you this has not been a multiple expansion - tech is now back at over 28x - its post-dot-com bust highs...
Source: Bloomberg
MTUM (momentum) saw its best start to a year... ever....
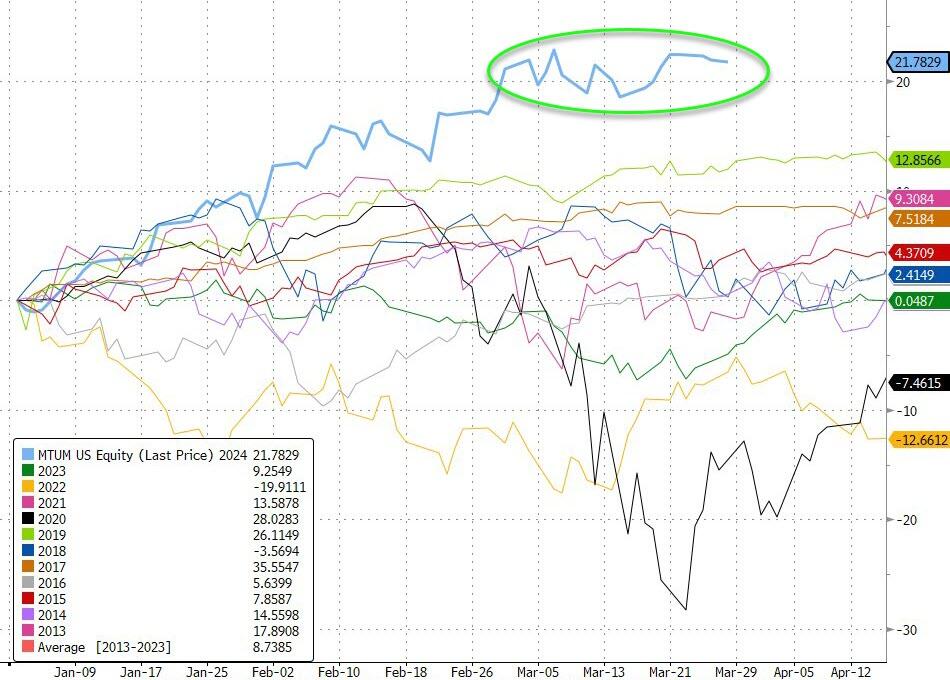
Source: Bloomberg
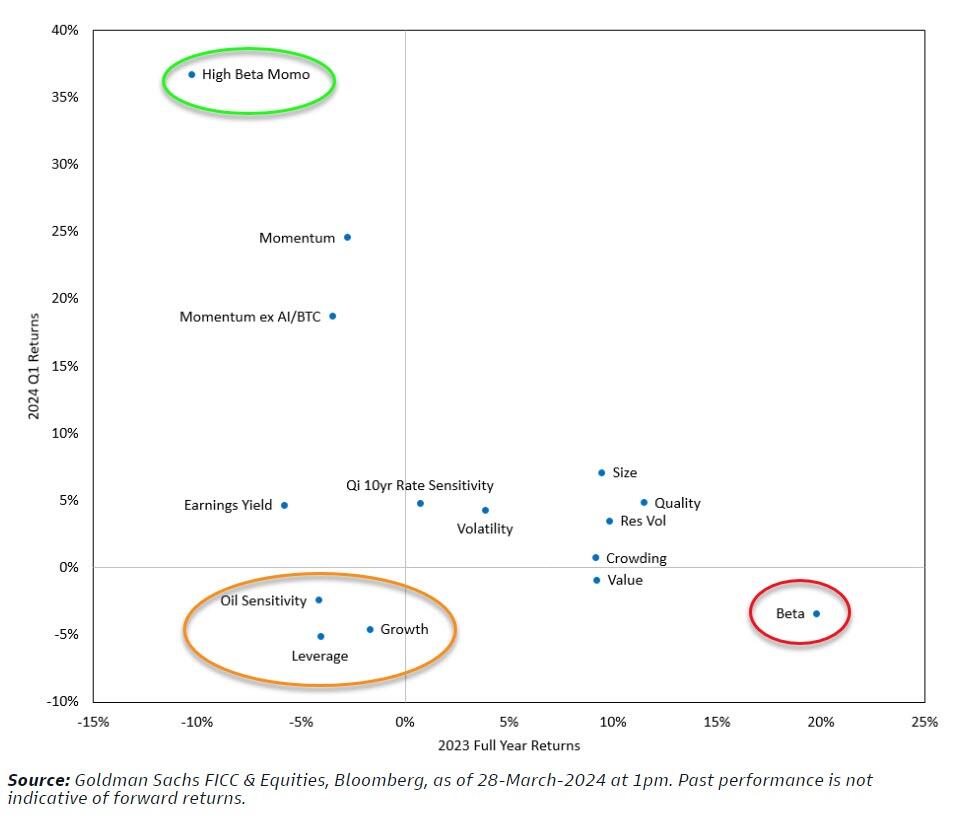
In fact, as Goldman shows in the chart below, High Beta Momo - the big Q1 outperformer - reversed its laggard performance in 2023...
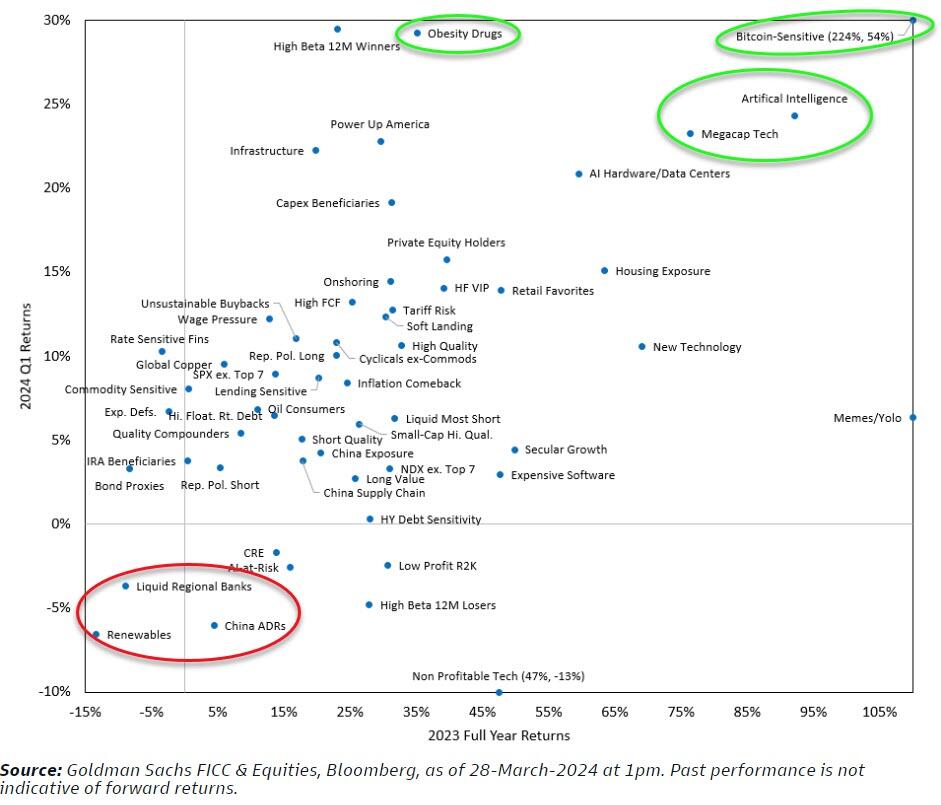
Thematically, Bitcoin-Sensitive stocks, AI stocks, and anti-obesity drug stocks all outperformed in Q1, continuing the trend of 2023 gains...
AI-related stocks soared 24% in Q1 while stocks at risk from AI fell around 3% in Q1...
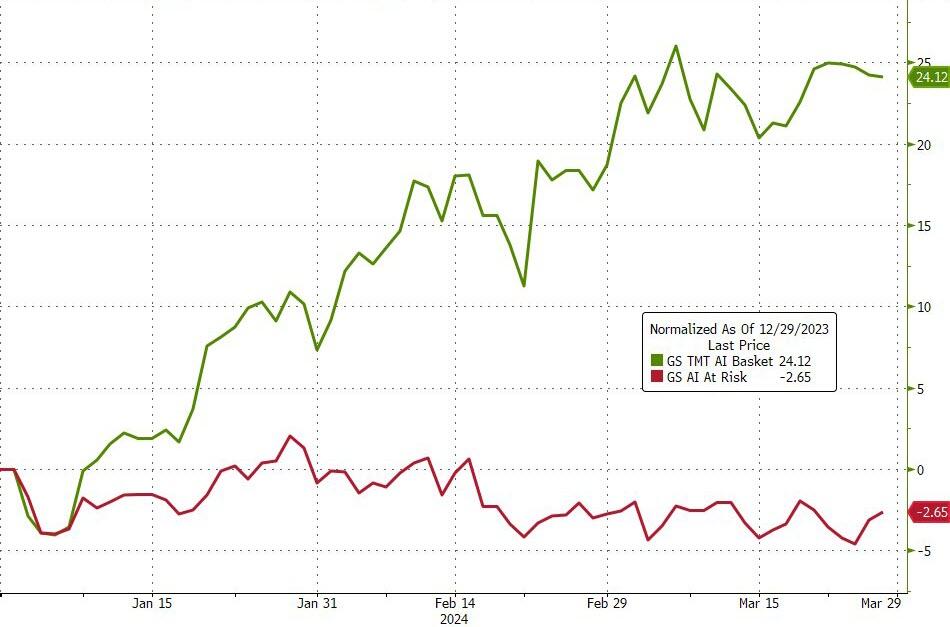
Source: Bloomberg
Anti-Obesity stocks soared in Q1, actually outperforming AI stocks and even GLP-1-at-risk stocks (e.g. WW) managed gains in Q1...
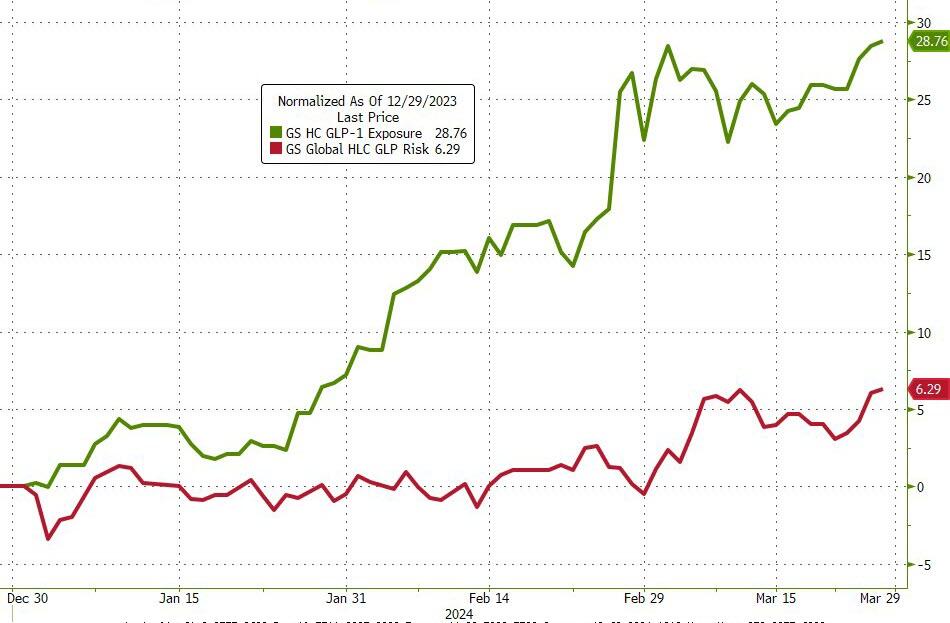
Source: Bloomberg
'Magnificent 7' stocks added a stunning $1.7 trillion in market cap in Q1...
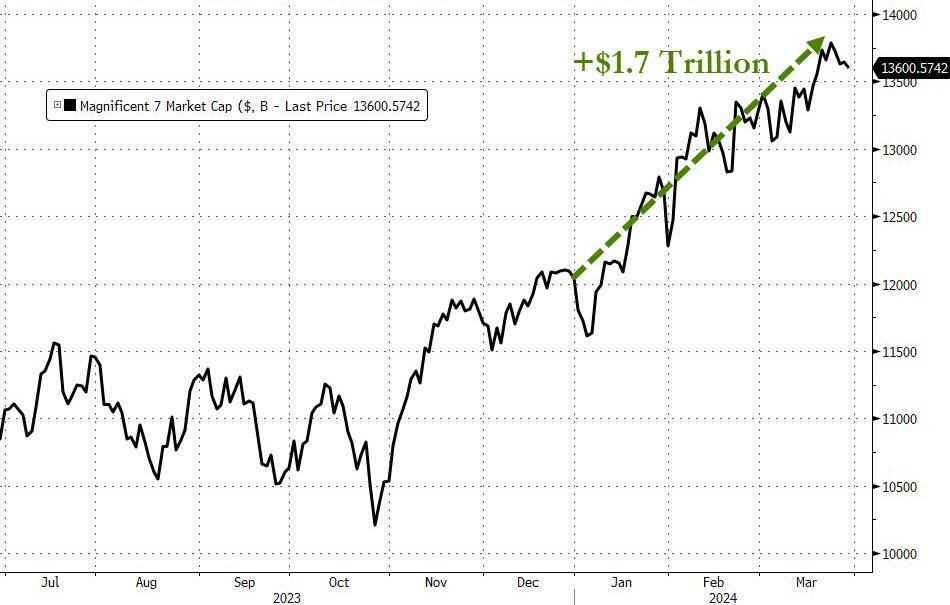
Source: Bloomberg
Notably, the implied vol of the Mag7 is once again very elevated relative to the implied vol of the S&P 500. In July of last year, this signaled a big reversal (demand for hedges). In Jan of this year, it was a signal of chasers buying levered bets on the upside. What does it mean this time?
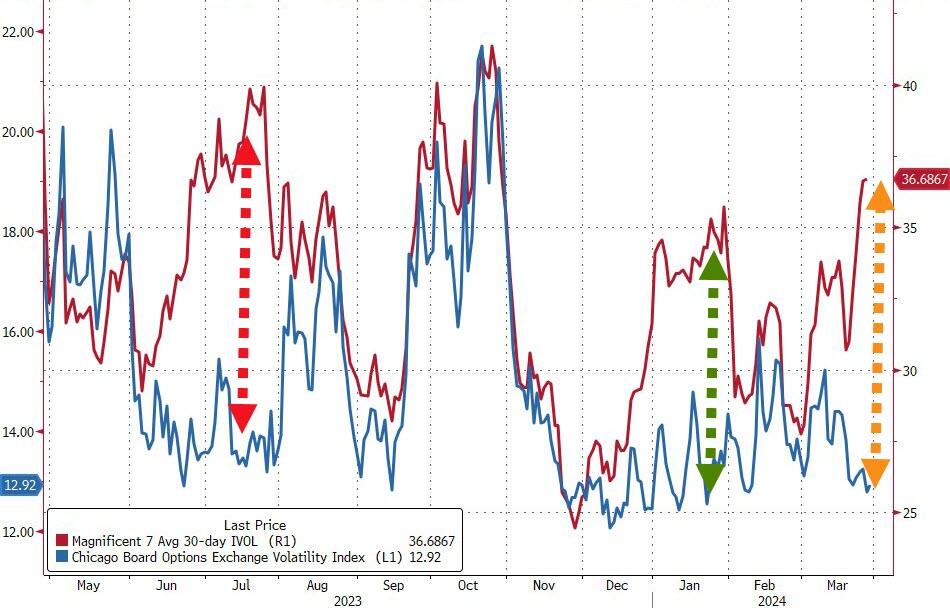
Source: Bloomberg
The strength in stocks and credit has dominated any rise in yields and crushed financial conditions to their loosest since before The Fed started their rate-hiking cycle...
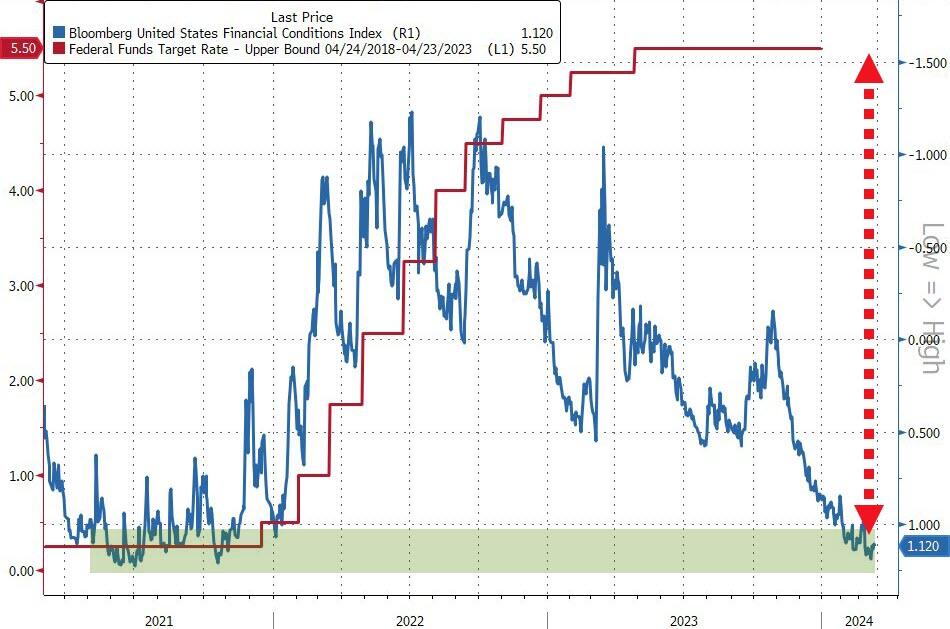
Source: Bloomberg
US Treasuries were dumped in Q1 as rate-cut expectations plunged with the short-end modestly underperforming...
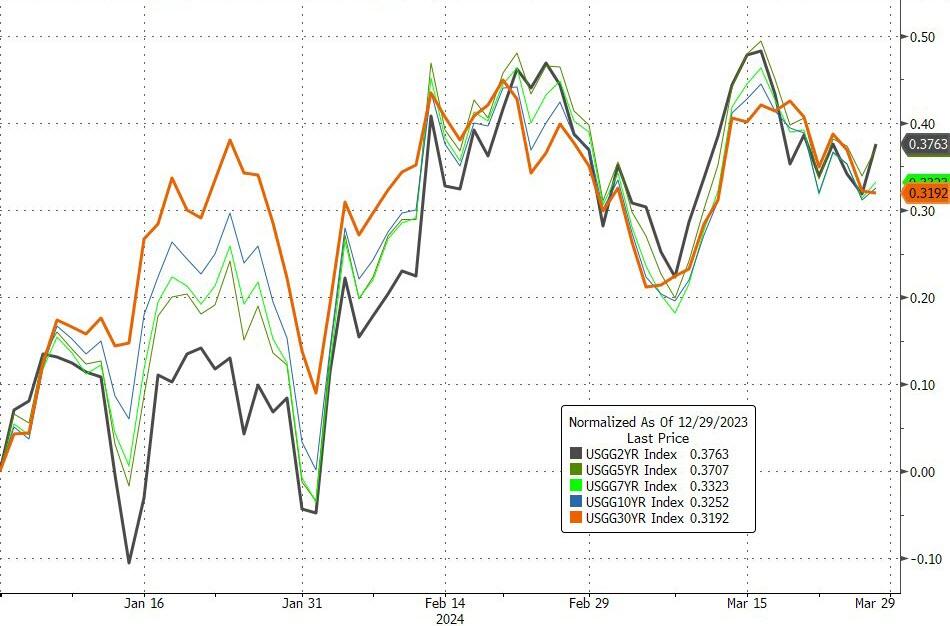
Source: Bloomberg
And while survey-based inflation expectations (UMich) are sliding, the market's expectation for inflation is anything but...
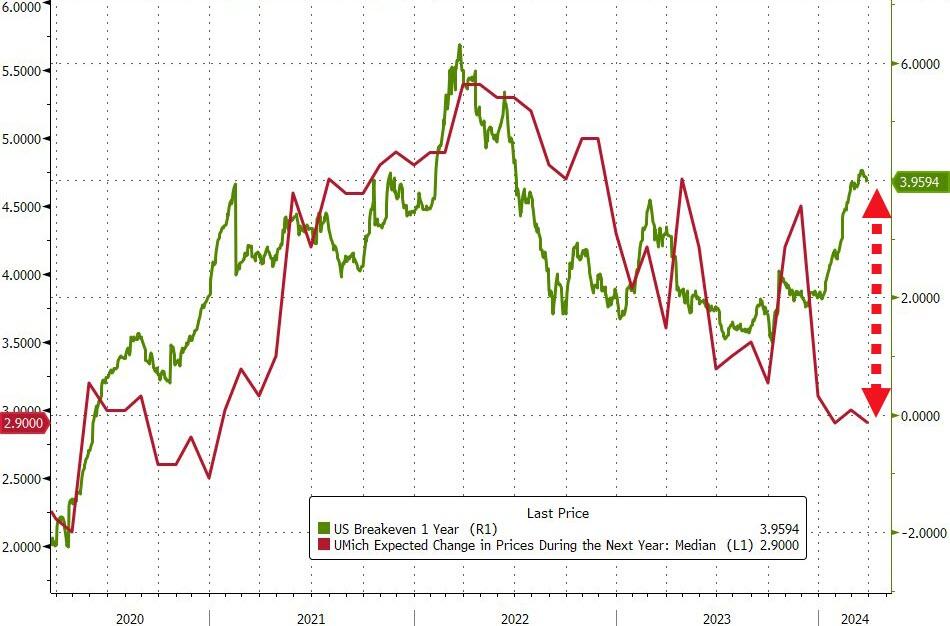
Source: Bloomberg
The dollar rallied in Q1, erasing around half of the Q4 losses...
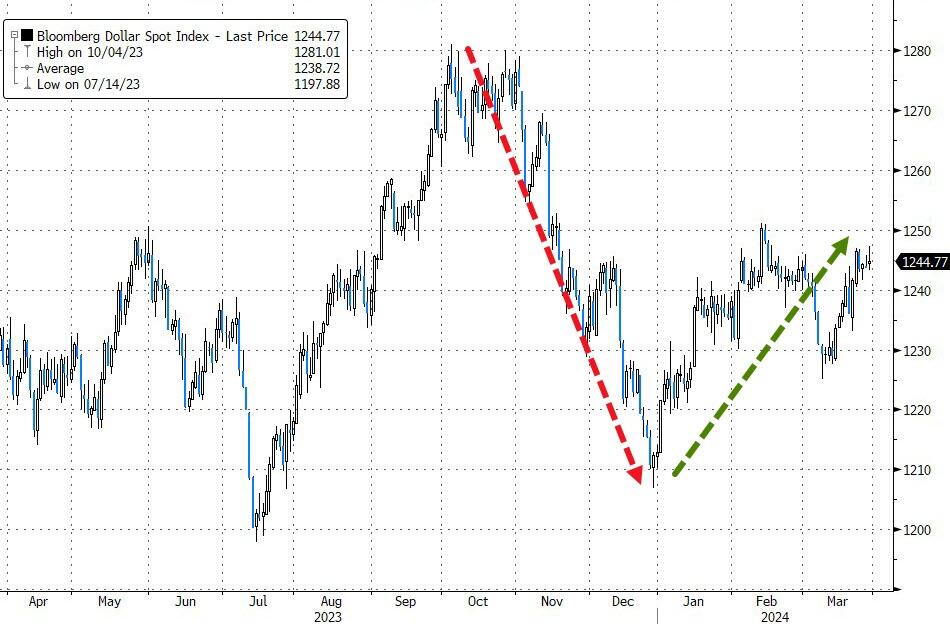
Source: Bloomberg
The dollar's strength was supported by yen weakness as the Japanese currency plunged to its weakest since 1990...
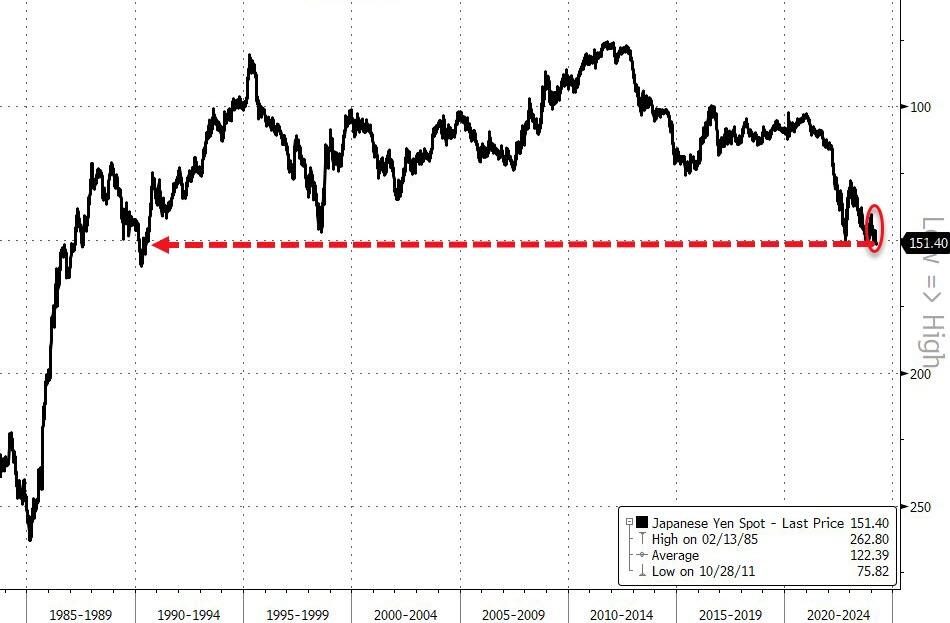
Source: Bloomberg
Not to be outdone, the yuan also tumbled in Q1...
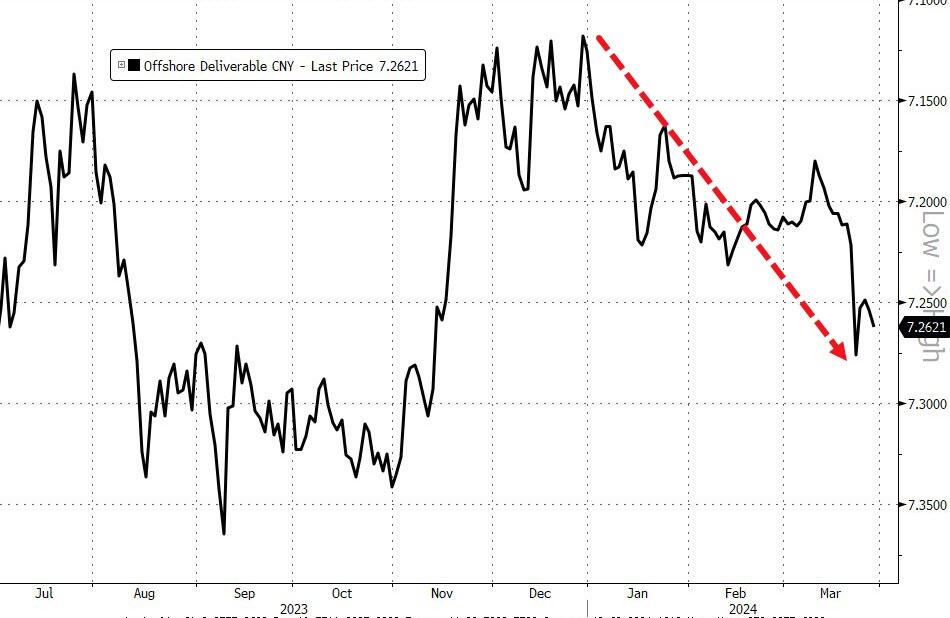
Source: Bloomberg
Q1 was dominated by bitcoin headlines - as the newly minted ETFs saw unprecedented inflows...
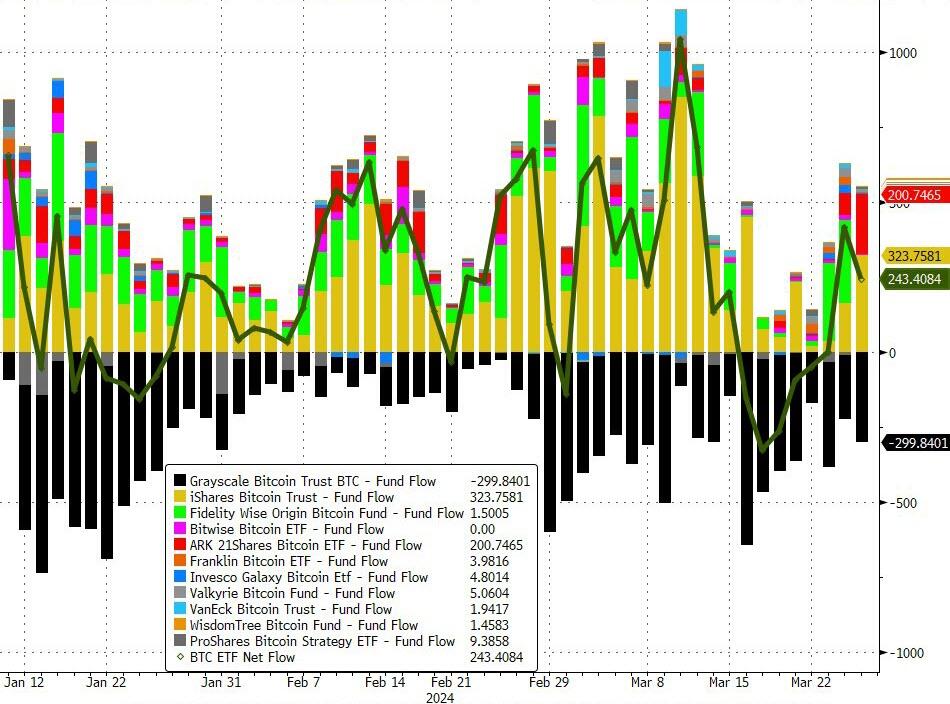
Source: Bloomberg
Which helped push Bitcoin to a new record high (in USD)...
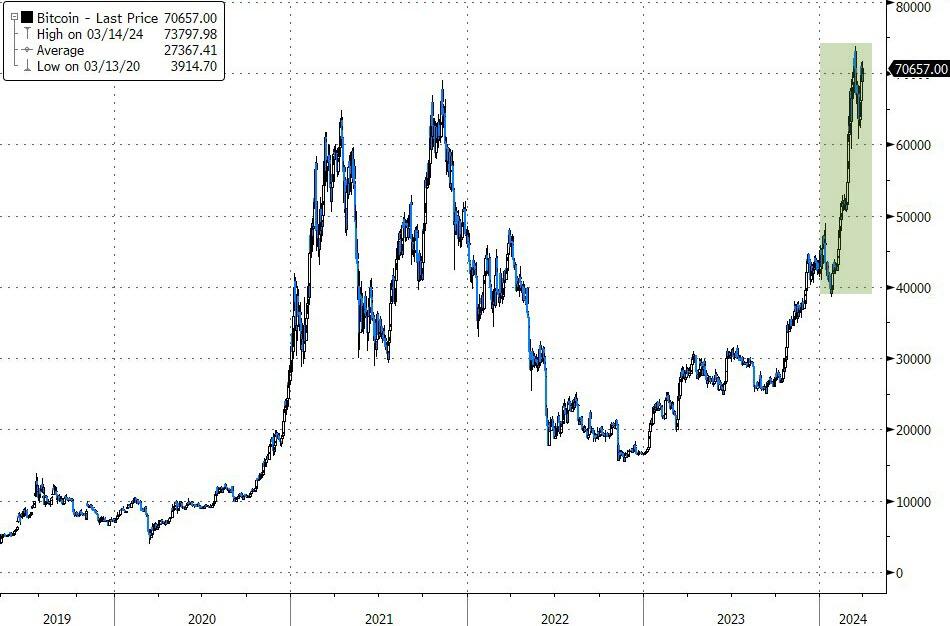
Source: Bloomberg
Ethereum also soared in Q1 (up 55%) but Solana outperformed...
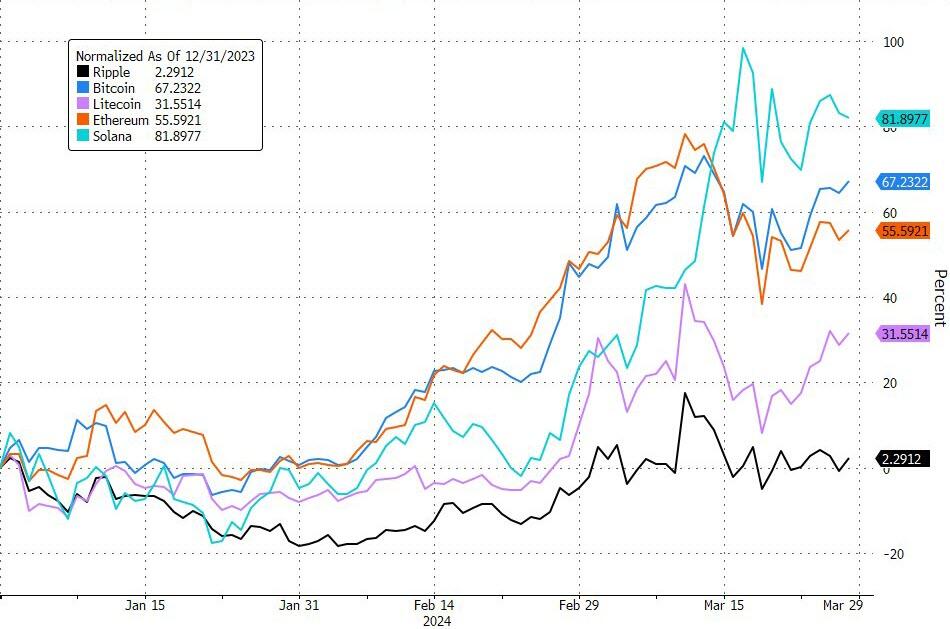
Source: Bloomberg
Another alternate currency - gold - also soared to a new record high in Q1...
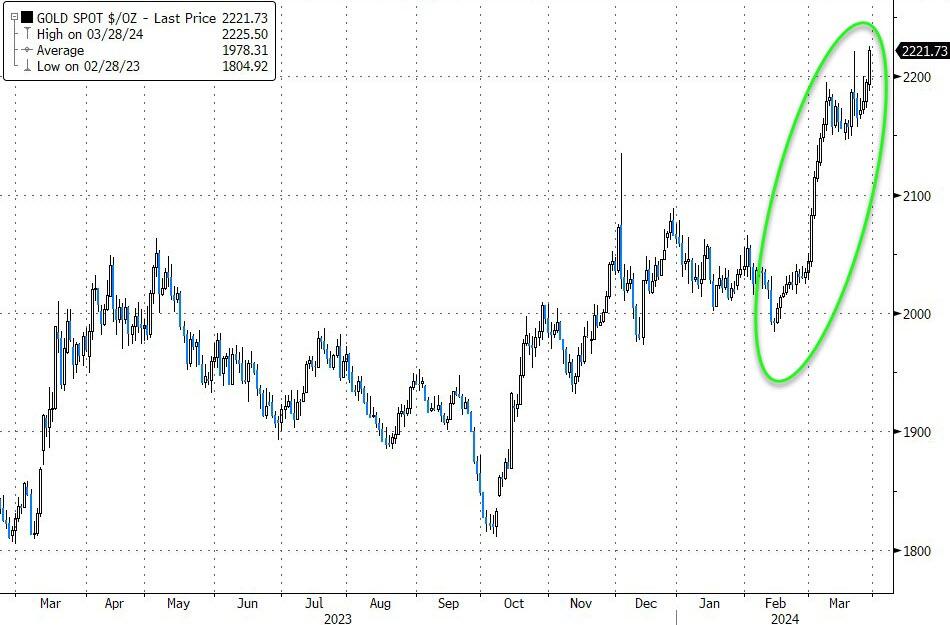
Source: Bloomberg
And just when you thought NVDA was the big winner, Cocoa hyperinflates in Q1, up 135% YTD!
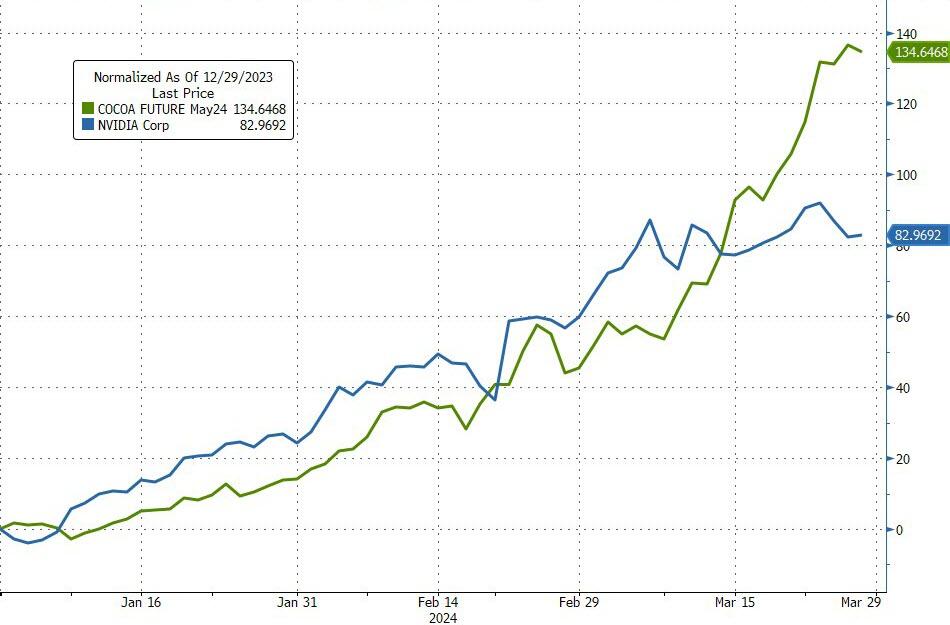
Source: Bloomberg
Oil, wholesale gasoline, and pump-prices all ripped higher in Q1 (especially March)...
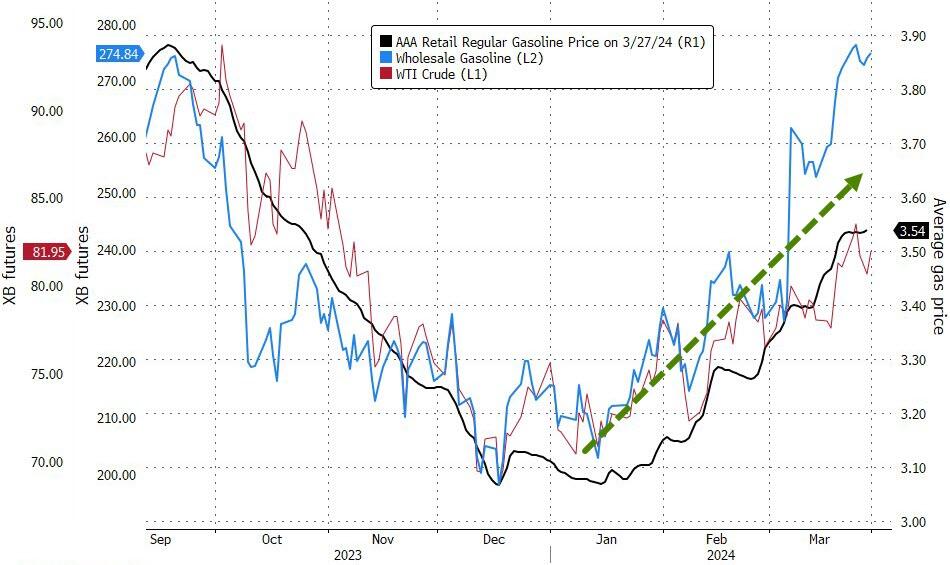
Source: Bloomberg
Finally, as Goldman's Chris Hussey notes, it's times like these – when 'everything is awesome' – when it is best to assess the risks that swirl around the investment landscape. Here are a few to consider:
-
A strong economic landing becomes a hard landing;
-
Inflation is sticky, not transitory, and the Fed pushes back;
-
The pandemic stimulus surge turns out not to be 'cost-less';
-
Concentration raises 'key company' risk;
-
Elections and geo-political risks.
And as a reminder, we've seen these 'everything is awesome' moments before...
Source: Bloomberg
And they never end well.


Stocks, Gold, & Crypto Soar In Q1 Despite Rout In Rate-Cut Expectations


Whiskey Rich: Luxury Liquor Trumps Stocks & Art Over Past Decade


Real personal income and spending: if last month was “Goldilocks”, this month was close to “anti-Goldilocks”


Home Depot agrees to make its largest acquisition ever


Profits Are Still Rising, Why Is the Fed Worried About Wage Growth?


America’s Minsky Moment Approaches


The divided state of Australia’s property market


Initial claims remain somnolent, while continuing claims pop slightly


COVID-19 antibody discovery could explain long COVID


Unlocking how to use mRNA to target Alzheimer’s disease
-

 Spread & Containment2 weeks ago
IFM’s Hat Trick and Reflections On Option-To-Buy M&A
-

 International1 week ago
Parexel CEO to retire; CAR-T maker AffyImmune promotes business leader to chief executive
-

 International3 weeks ago
EyePoint poaches medical chief from Apellis; Sandoz CFO, longtime BioNTech exec to retire
-

 Uncategorized1 month ago
Apparel Retailer Express Moving Toward Bankruptcy
-

 International3 weeks ago
Walmart launches clever answer to Target’s new membership program
-

 Uncategorized1 month ago
Key Events This Week: All Eyes On Core PCE Amid Deluge Of Fed Speakers
-

 Uncategorized1 month ago
A Blue State Exodus: Who Can Afford To Be A Liberal
-

 Uncategorized4 weeks ago
Evidence And Insights About Gold’s Long-Term Uptrend