Government
What weekly unemployment claims reveal about the local impacts of the COVID-19 recession
What weekly unemployment claims reveal about the local impacts of the COVID-19 recession
Share this:

By Alan Berube
Over the past two months, the coronavirus pandemic has devastated large swaths of the U.S. labor market, with more than 36 million American workers filing claims for unemployment insurance. Just last week, the Bureau of Labor Statistics (BLS) reported that the national unemployment rate reached 14.7% by mid-April, its highest level since the Great Depression—even as the agency acknowledged that the rate is likely considerably higher.
While few corners of the U.S. economy have been unaffected by the pandemic, some places have suffered more and/or earlier than others due to factors such as the path of the virus within U.S. borders and the vulnerability of local industries to consumer and government actions. Recently, Brookings Metro examined BLS data on job loss and unemployment trends through the middle of March, as those actions were just taking shape. However, BLS publishes those data roughly six weeks after the underlying survey is conducted, making them somewhat out-of-date amid a rapidly changing labor market.
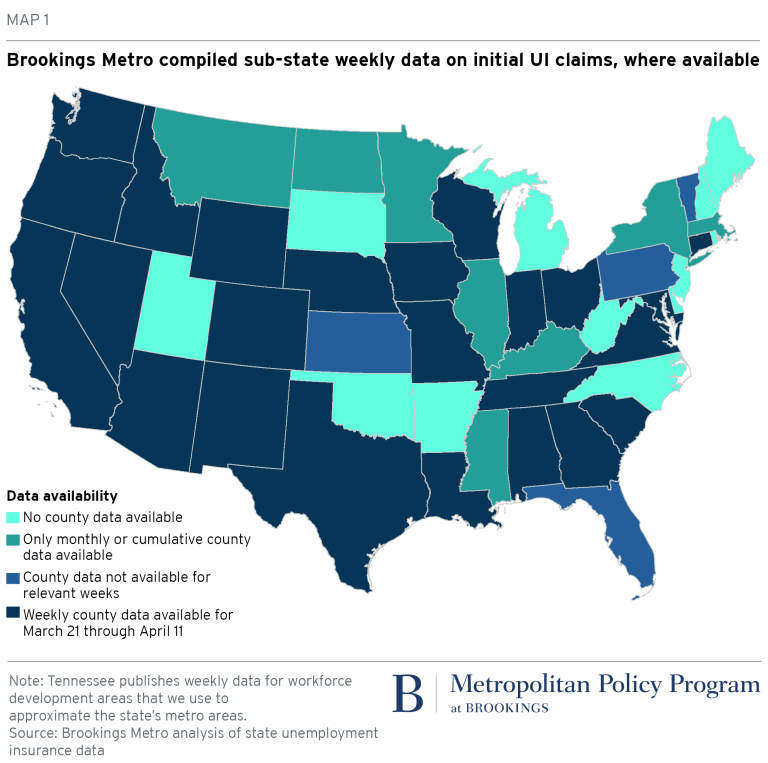
Initial unemployment insurance (UI) claims may provide a more current picture of regional labor market volatility. Each week, states report the preceding week’s data on initial UI claims to the U.S. Department of Labor. For this analysis, Brookings Metro compiled sub-state weekly data on those claims (where available) to examine metropolitan-level trends.
Many states publish these data—typically by county—on the websites of their departments of labor or workforce development each week. However, not all states publish such data; some provide no sub-state data, while others provide those data only on a monthly or cumulative basis.
Overall, we identified 27 states and the District of Columbia that provided weekly initial UI claims data by county (or equivalent) for the weeks ending March 21 through April 11. These data allowed us to explore UI claims trends for 111 of the 192 U.S. metro areas with populations of at least 250,000. (If a metro area spanned multiple states and data were available by county in one or more of those states but not others, we included the metro area if constituent counties with data accounted for at least 75% of employment for the whole metro area.)

Initial UI claims were most widespread in tourism hubs and regions hit earlier by the virus
As an early Brookings Metro analysis suggested, some cities felt the initial brunt of the COVID-19 recession earlier than others. Comparing total claims across the four weeks to initial employment totals by metro area shows that in just one month, as many as one-quarter of all workers in tourism destinations such as Las Vegas, New Orleans, and Myrtle Beach, S.C. lost their jobs, as work in hotels, casinos, and entertainment hubs quickly dried up.
Another set of heavily impacted metro areas not only possessed vulnerable industries and workers, but also are located in states where public officials took earlier action to contain the virus’s spread. California’s Riverside-San Bernardino, Stockton, and Vallejo metro areas saw unemployment claims rise dramatically in the wake of Governor Gavin Newsom’s stay-at-home order on March 19. The same was true of the Youngstown and Toledo metro areas in Ohio, which, on March 15, became one of the first states to shutter all bars and restaurants. These metro areas saw greater shares of their workers affected than other metro areas in those states, such as the San Francisco Bay Area and Ohio’s three largest metro areas (Cleveland, Columbus, and Cincinnati), where larger white-collar workforces were not subject to the same high levels of immediate displacement.
In a different set of metro areas, the share of workers filing initial UI claims in the early weeks of the crisis was much smaller. In Texas, for instance, initial UI claims represented no more than 10% of local employment in any metro area; in many of the state’s midsized metro areas, the share was only 5% to 6%. This reflected not only Texas’s below-average rates of COVID-19 infection in March and April, but also the fact that Governor Greg Abbott let local officials make decisions about shutdowns before finally issuing a statewide stay-at-home order effective April 2. In Georgia, where Governor Brian Kemp only issued such an order on April 3, layoffs were already widespread in regions such as Atlanta and Savannah, as local officials took earlier action to limit the virus’s spread.

Another factor that may contribute to differences across counties and states in the prevalence of these claims is the responsiveness of their UI systems. Research from the Economic Policy Institute finds that for every 10 people who successfully filed for UI benefits between mid-March and mid-April, at least three more tried but couldn’t get through. Some states have purposely made it more burdensome for people to apply for UI benefits, while others have simply failed to update or upgrade computer systems that handle such applications.
Initial claims were still high or rising in several metro areas by mid-April
From mid-March through mid-April, roughly 20 million workers nationwide filed initial UI claims. The worst weeks were those ending March 28 and April 4, when UI benefit rolls swelled by 6 million claimants each week. Laid-off workers filed another 5 million initial claims the week ending April 11, followed by 10 million more over the succeeding three weeks.
Across the metro areas analyzed here, initial claim totals were also highest for the weeks ending March 28 and April 4. Of the 111 metro areas, 98 registered their highest weekly total during one of those weeks.
Yet in some metro areas, initial UI claims were rising or remained high as of mid-April. Regions in Indiana, South Carolina, and even the Seattle metro area (where the virus is thought to have initially entered the United States) either met a new weekly high for UI claims or were still above 80% of their peak weekly claims for the week ending April 11. Again, these patterns may reflect differences in state UI system responsiveness, but they may also signal the spread of the economic contagion into industries “upstream” from immediately affected sectors of hospitality and retail.

Local UI claims can be useful ‘real time’ indicators of labor market conditions
Because they are reported weekly, data on metro areas’ initial UI claims offer insights into the health of local economies that are something closer to real time than official labor market surveys. Moreover, they show that the impacts of this downturn are not being felt evenly across the country, nor even within states—illustrating the need for tailored assistance to heavily affected areas.
But the insights are only as complete as the data behind them. Although this analysis manages to cover a majority of major U.S. metro areas, too many states fail to make sub-state UI data accessible to the public. The availability of these data doesn’t fall neatly along regional, demographic, or blue/red state lines; it just seems to appear in some places and not in others.
The U.S. Department of Labor could help by requesting that states submit initial UI claims data by county at the same time they submit their statewide totals each week. Not all states may have the capacity to report such data right away, but federal encouragement would signal the value of this information, and would enable the reporting of these data in one place as opposed to the dozens of mercurial state agency websites we scoured.
Until then, we’ll continue tracking and analyzing these data state by state, metro area by metro area, to chart the depth and breadth of the labor market challenges facing American communities.
The author thanks Sarah Crump and Caroline George for research assistance, including wading through 51 state Department of Labor websites.
Government
Low Iron Levels In Blood Could Trigger Long COVID: Study
Low Iron Levels In Blood Could Trigger Long COVID: Study
Authored by Amie Dahnke via The Epoch Times (emphasis ours),
People with inadequate…
Share this:


Authored by Amie Dahnke via The Epoch Times (emphasis ours),
People with inadequate iron levels in their blood due to a COVID-19 infection could be at greater risk of long COVID.
A new study indicates that problems with iron levels in the bloodstream likely trigger chronic inflammation and other conditions associated with the post-COVID phenomenon. The findings, published on March 1 in Nature Immunology, could offer new ways to treat or prevent the condition.
Long COVID Patients Have Low Iron Levels
Researchers at the University of Cambridge pinpointed low iron as a potential link to long-COVID symptoms thanks to a study they initiated shortly after the start of the pandemic. They recruited people who tested positive for the virus to provide blood samples for analysis over a year, which allowed the researchers to look for post-infection changes in the blood. The researchers looked at 214 samples and found that 45 percent of patients reported symptoms of long COVID that lasted between three and 10 months.
In analyzing the blood samples, the research team noticed that people experiencing long COVID had low iron levels, contributing to anemia and low red blood cell production, just two weeks after they were diagnosed with COVID-19. This was true for patients regardless of age, sex, or the initial severity of their infection.
According to one of the study co-authors, the removal of iron from the bloodstream is a natural process and defense mechanism of the body.
But it can jeopardize a person’s recovery.
“When the body has an infection, it responds by removing iron from the bloodstream. This protects us from potentially lethal bacteria that capture the iron in the bloodstream and grow rapidly. It’s an evolutionary response that redistributes iron in the body, and the blood plasma becomes an iron desert,” University of Oxford professor Hal Drakesmith said in a press release. “However, if this goes on for a long time, there is less iron for red blood cells, so oxygen is transported less efficiently affecting metabolism and energy production, and for white blood cells, which need iron to work properly. The protective mechanism ends up becoming a problem.”
The research team believes that consistently low iron levels could explain why individuals with long COVID continue to experience fatigue and difficulty exercising. As such, the researchers suggested iron supplementation to help regulate and prevent the often debilitating symptoms associated with long COVID.
“It isn’t necessarily the case that individuals don’t have enough iron in their body, it’s just that it’s trapped in the wrong place,” Aimee Hanson, a postdoctoral researcher at the University of Cambridge who worked on the study, said in the press release. “What we need is a way to remobilize the iron and pull it back into the bloodstream, where it becomes more useful to the red blood cells.”
The research team pointed out that iron supplementation isn’t always straightforward. Achieving the right level of iron varies from person to person. Too much iron can cause stomach issues, ranging from constipation, nausea, and abdominal pain to gastritis and gastric lesions.
1 in 5 Still Affected by Long COVID
COVID-19 has affected nearly 40 percent of Americans, with one in five of those still suffering from symptoms of long COVID, according to the U.S. Centers for Disease Control and Prevention (CDC). Long COVID is marked by health issues that continue at least four weeks after an individual was initially diagnosed with COVID-19. Symptoms can last for days, weeks, months, or years and may include fatigue, cough or chest pain, headache, brain fog, depression or anxiety, digestive issues, and joint or muscle pain.
Government
Walmart joins Costco in sharing key pricing news
The massive retailers have both shared information that some retailers keep very close to the vest.
Share this:

As we head toward a presidential election, the presumed candidates for both parties will look for issues that rally undecided voters.
The economy will be a key issue, with Democrats pointing to job creation and lowering prices while Republicans will cite the layoffs at Big Tech companies, high housing prices, and of course, sticky inflation.
The covid pandemic created a perfect storm for inflation and higher prices. It became harder to get many items because people getting sick slowed down, or even stopped, production at some factories.
Related: Popular mall retailer shuts down abruptly after bankruptcy filing
It was also a period where demand increased while shipping, trucking and delivery systems were all strained or thrown out of whack. The combination led to product shortages and higher prices.
You might have gone to the grocery store and not been able to buy your favorite paper towel brand or find toilet paper at all. That happened partly because of the supply chain and partly due to increased demand, but at the end of the day, it led to higher prices, which some consumers blamed on President Joe Biden's administration.
Biden, of course, was blamed for the price increases, but as inflation has dropped and grocery prices have fallen, few companies have been up front about it. That's probably not a political choice in most cases. Instead, some companies have chosen to lower prices more slowly than they raised them.
However, two major retailers, Walmart (WMT) and Costco, have been very honest about inflation. Walmart Chief Executive Doug McMillon's most recent comments validate what Biden's administration has been saying about the state of the economy. And they contrast with the economic picture being painted by Republicans who support their presumptive nominee, Donald Trump.
Image source: Joe Raedle/Getty Images
Walmart sees lower prices
McMillon does not talk about lower prices to make a political statement. He's communicating with customers and potential customers through the analysts who cover the company's quarterly-earnings calls.
During Walmart's fiscal-fourth-quarter-earnings call, McMillon was clear that prices are going down.
"I'm excited about the omnichannel net promoter score trends the team is driving. Across countries, we continue to see a customer that's resilient but looking for value. As always, we're working hard to deliver that for them, including through our rollbacks on food pricing in Walmart U.S. Those were up significantly in Q4 versus last year, following a big increase in Q3," he said.
He was specific about where the chain has seen prices go down.
"Our general merchandise prices are lower than a year ago and even two years ago in some categories, which means our customers are finding value in areas like apparel and hard lines," he said. "In food, prices are lower than a year ago in places like eggs, apples, and deli snacks, but higher in other places like asparagus and blackberries."
McMillon said that in other areas prices were still up but have been falling.
"Dry grocery and consumables categories like paper goods and cleaning supplies are up mid-single digits versus last year and high teens versus two years ago. Private-brand penetration is up in many of the countries where we operate, including the United States," he said.
Costco sees almost no inflation impact
McMillon avoided the word inflation in his comments. Costco (COST) Chief Financial Officer Richard Galanti, who steps down on March 15, has been very transparent on the topic.
The CFO commented on inflation during his company's fiscal-first-quarter-earnings call.
"Most recently, in the last fourth-quarter discussion, we had estimated that year-over-year inflation was in the 1% to 2% range. Our estimate for the quarter just ended, that inflation was in the 0% to 1% range," he said.
Galanti made clear that inflation (and even deflation) varied by category.
"A bigger deflation in some big and bulky items like furniture sets due to lower freight costs year over year, as well as on things like domestics, bulky lower-priced items, again, where the freight cost is significant. Some deflationary items were as much as 20% to 30% and, again, mostly freight-related," he added.
bankruptcy pandemic trumpGovernment
Walmart has really good news for shoppers (and Joe Biden)
The giant retailer joins Costco in making a statement that has political overtones, even if that’s not the intent.
Share this:

As we head toward a presidential election, the presumed candidates for both parties will look for issues that rally undecided voters.
The economy will be a key issue, with Democrats pointing to job creation and lowering prices while Republicans will cite the layoffs at Big Tech companies, high housing prices, and of course, sticky inflation.
The covid pandemic created a perfect storm for inflation and higher prices. It became harder to get many items because people getting sick slowed down, or even stopped, production at some factories.
Related: Popular mall retailer shuts down abruptly after bankruptcy filing
It was also a period where demand increased while shipping, trucking and delivery systems were all strained or thrown out of whack. The combination led to product shortages and higher prices.
You might have gone to the grocery store and not been able to buy your favorite paper towel brand or find toilet paper at all. That happened partly because of the supply chain and partly due to increased demand, but at the end of the day, it led to higher prices, which some consumers blamed on President Joe Biden's administration.
Biden, of course, was blamed for the price increases, but as inflation has dropped and grocery prices have fallen, few companies have been up front about it. That's probably not a political choice in most cases. Instead, some companies have chosen to lower prices more slowly than they raised them.
However, two major retailers, Walmart (WMT) and Costco, have been very honest about inflation. Walmart Chief Executive Doug McMillon's most recent comments validate what Biden's administration has been saying about the state of the economy. And they contrast with the economic picture being painted by Republicans who support their presumptive nominee, Donald Trump.
Image source: Joe Raedle/Getty Images
Walmart sees lower prices
McMillon does not talk about lower prices to make a political statement. He's communicating with customers and potential customers through the analysts who cover the company's quarterly-earnings calls.
During Walmart's fiscal-fourth-quarter-earnings call, McMillon was clear that prices are going down.
"I'm excited about the omnichannel net promoter score trends the team is driving. Across countries, we continue to see a customer that's resilient but looking for value. As always, we're working hard to deliver that for them, including through our rollbacks on food pricing in Walmart U.S. Those were up significantly in Q4 versus last year, following a big increase in Q3," he said.
He was specific about where the chain has seen prices go down.
"Our general merchandise prices are lower than a year ago and even two years ago in some categories, which means our customers are finding value in areas like apparel and hard lines," he said. "In food, prices are lower than a year ago in places like eggs, apples, and deli snacks, but higher in other places like asparagus and blackberries."
McMillon said that in other areas prices were still up but have been falling.
"Dry grocery and consumables categories like paper goods and cleaning supplies are up mid-single digits versus last year and high teens versus two years ago. Private-brand penetration is up in many of the countries where we operate, including the United States," he said.
Costco sees almost no inflation impact
McMillon avoided the word inflation in his comments. Costco (COST) Chief Financial Officer Richard Galanti, who steps down on March 15, has been very transparent on the topic.
The CFO commented on inflation during his company's fiscal-first-quarter-earnings call.
"Most recently, in the last fourth-quarter discussion, we had estimated that year-over-year inflation was in the 1% to 2% range. Our estimate for the quarter just ended, that inflation was in the 0% to 1% range," he said.
Galanti made clear that inflation (and even deflation) varied by category.
"A bigger deflation in some big and bulky items like furniture sets due to lower freight costs year over year, as well as on things like domestics, bulky lower-priced items, again, where the freight cost is significant. Some deflationary items were as much as 20% to 30% and, again, mostly freight-related," he added.
bankruptcy pandemic trump

Catastrophic Risk: Investing and Business Implications


When Military Rule Supplants Democracy


Redefining Poverty: Towards a Transpartisan Approach


The Digest #187


Dropping Like a Stone: ON RRP Take‑up in the Second Half of 2023


Where Is R‑Star and the End of the Refi Boom: The Top 5 Posts of 2023


Students lose out as cities and states give billions in property tax breaks to businesses − draining school budgets and especially hurting the poorest students


Revving up tourism: Formula One and other big events look set to drive growth in the hospitality industry


Biden to call for first-time homebuyer tax credit, construction of 2 million homes


GBPINR: Analysis and Projections for 2024
-

 Uncategorized2 weeks ago
All Of The Elements Are In Place For An Economic Crisis Of Staggering Proportions
-

 Uncategorized1 month ago
Cathie Wood sells a major tech stock (again)
-

 Uncategorized3 weeks ago
California Counties Could Be Forced To Pay $300 Million To Cover COVID-Era Program
-

 Uncategorized2 weeks ago
Apparel Retailer Express Moving Toward Bankruptcy
-

 Uncategorized3 weeks ago
Industrial Production Decreased 0.1% in January
-

 International1 day ago
Walmart launches clever answer to Target’s new membership program
-

 Uncategorized3 weeks ago
RFK Jr: The Wuhan Cover-Up & The Rise Of The Biowarfare-Industrial Complex
-

 Uncategorized3 weeks ago
GOP Efforts To Shore Up Election Security In Swing States Face Challenges