Connect with us

Uncategorized

US Treasury Reveals Lower Than Expected Rate Of Debt Sales In Quarterly Refunding Plan; Yields Slide

US Treasury Reveals Lower Than Expected Rate Of Debt Sales In Quarterly Refunding Plan; Yields Slide

We already knew – after its publication…

Published

on

US Treasury Reveals Lower Than Expected Rate Of Debt Sales In Quarterly Refunding Plan; Yields Slide

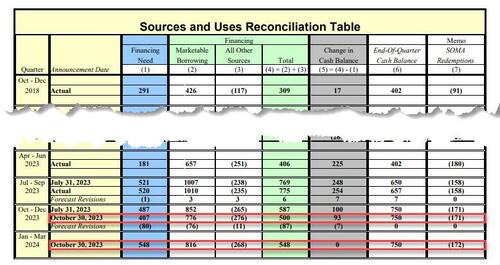
We already knew - after its publication on Monday - that in the current quarter, the Treasury expected to issue $776BN in debt in the current quarter, or some $76BN below the previous forecast published last quarter, a welcome slowdown in debt issuance as a result of slightly higher than expected tax receipts in October.

Today's Treasury Refunding Announcement gave the details of what the composition of this issuance would be, with a focus on Coupon vs Bill sales.

Here is what we learned: next week, the US Treasury's debt sales will total $112BN, which while an increase from the $103BN unveiled in August, was less than the $114BN anticipated by Wall Street bond dealers. It was the second straight boost to the so-called quarterly refunding, if slightly less than expected.

The offering of $112 billion in coupons will refund approximately $102.2 billion of privately-held Treasury notes maturing on November 15, 2023. This issuance will raise new cash from private investors of approximately $9.8 billion.  The securities are:

  • A 3-year note in the amount of $48 billion on Nov 7, up $2BN from $46BN in October
  • A 10-year note in the amount of $40 billion on Nov 8, up $5BN from $35BN in October
  • A 30-year bond in the amount of $24 billion on Nov 9, up $3BN from $20BN in October

Treasury plans to increase both the new issue and reopening auction size of the 10-year note by $2bn and the 30-year bond by $1bn; Treasury will maintain the 20-year bond new issue and reopening auction size, noting that "treasury issuance plans will continue to depend on a variety of factors, including the evolution of the fiscal outlook and the pace and duration of future SOMA redemptions”

Compared with the August refunding, the key difference this time was a slower pace of increases in sales of 10-year and 30-year securities, with 20-year bonds kept unchanged.

Some more details:

  • The Treasury also plans to increase the Nov. and Dec. reopening auction size of the 2-year FRN by $2b and the January new issue auction size by $2b;
  • Treasury plans to maintain Nov. 10-year TIPS reopening auction size at $15b and increase Dec. 5-year TIPS reopening auction size by $1b to $20b; Jan. 10-year TIPS new issue auction size to be increased by $1b to $18b.
  • Additionally, two- and five-year auction sizes are set to increase by $3BN per month; three-year by $2BN per month; and seven-year by $1BN per month.

The table below summarizes all of the above:

This is what most rates traders on Wall Street had expected from the Treasury today.

The total of $112 billion compares a peak of $126BN first reached in February 2021; auction sizes across the curve began rising in 2018 to finance tax cuts and surged in 2020 to finance federal pandemic response. Then after dipping modestly in 2022, coupon issuance is once again rising and will continue to do so pretty much indefinitely unless the government learns to live within its means, which of course will never happen.

The Treasury also specified that it now expects a single additional step up in quarterly issuance of longer-term debt. “As these changes will make substantial progress towards aligning auction sizes with projected borrowing needs, Treasury anticipates that one additional quarter of increases to coupon auction sizes will likely be needed beyond the increases announced today,” the Treasury said in its release Wednesday.

As usual, the Treasury said it plans to address any seasonal or unexpected variations in borrowing needs over the next quarter through changes in regular bill auction sizes and/or CMBs.

The department said its plans “will continue to depend on a variety of factors, including the evolution of the fiscal outlook” and the pace and duration of the Federal Reserve’s shrinking of its portfolio of Treasuries. The Fed is letting up to $60 billion a month of its holdings mature without replacement, forcing the government to issue more to the public.

And since there was a modest miss in coupon issuance, the offset naturally had to come at the expense of bills; this is what the Treasury said regarding the coming bill issuance: "Given current fiscal forecasts, treasury expects to maintain bill auction sizes at current levels into late-November – this will help to ensure sufficient liquidity to meet our elevated one-week cash needs around the end of this month.  By early-December, Treasury anticipates implementing modest reductions to short-dated bill auction sizes that will likely then be maintained through mid- to late-January."

Readers will recall that the August refunding announcement - which spooked bond markets with the surge in new issuance - came as a bit of a shock, sending yields surging with 10-year rates up more than 75 basis points since then.

While Treasury Secretary Janet Yellen has rejected the idea that increased government borrowing caused the move, market participants highlight increasing concern about the widening US fiscal deficit.

In its guidance to officials, the Treasury Borrowing Advisory Committee — a panel of bond-market participants — noted that there’s more liquidity and demand for securities maturing sooner than 10 years.

With regard to bills, which mature in one year or less, the Treasury said it “expects to maintain bill auction sizes at current levels into late-November.”

By early next month, “Treasury anticipates implementing modest reductions to short-dated bill auction sizes that will likely then be maintained through mid- to late-January.” That plan comes after the department said Monday that it expects more revenue this quarter than previously expected, thanks in part to an influx of deferred taxes from much of California and other states.

The share of bills in total government debt pile current is currently more than 20%, the cap that TBAC has long advised as most ideal. However, in August, TBAC indicated that exceeding the peak for a time before returning to the recommended range wouldn’t pose an issue.

Turning to the topic of buybacks, which some have called QE in sheep's clothing, the Treasury said that it "intends to provide an update on the timing for implementing the regular buyback program in the next quarterly refunding announcement.”

For its Issuance plans for Treasury Inflation-Protected Securities, or TIPS, the department said it will maintain the November 10-year maturity reopening at $15 billion and increase its new issue sale in January by $1 billion. It also said it will lift its December reopening 5-year maturity by $1 billion.

As for floating-rate notes, the Treasury plans to increase the November and December reopening auction size of the 2-year FRN by $2 billion and the January new issue auction size by $2 billion.

In kneejerk response, 10Y yields dropped to session lows if rising modestly since after today's refunding was slightly lower than most had expected.

Tyler Durden Wed, 11/01/2023 - 08:59

Read More

Continue Reading

Uncategorized

Common household chemicals pose new threat to brain health

CLEVELAND—A team of researchers from the Case Western Reserve University School of Medicine has provided fresh insight into the dangers some common…

Published

on

CLEVELAND—A team of researchers from the Case Western Reserve University School of Medicine has provided fresh insight into the dangers some common household chemicals pose to brain health. They suggest that chemicals found in a wide range of items, from furniture to hair products, may be linked to neurological diseases like multiple sclerosis and autism spectrum disorders.

Paul Tesar

Credit: Case Western Reserve University

CLEVELAND—A team of researchers from the Case Western Reserve University School of Medicine has provided fresh insight into the dangers some common household chemicals pose to brain health. They suggest that chemicals found in a wide range of items, from furniture to hair products, may be linked to neurological diseases like multiple sclerosis and autism spectrum disorders.

Neurological problems impact millions of people, but only a fraction of cases can be attributed to genetics alone, indicating that unknown environmental factors are important contributors to neurological disease.

The new study published today in the journal Nature Neuroscience, discovered that some common home chemicals specifically affect the brain’s oligodendrocytes, a specialized cell type that generates the protective insulation around nerve cells.

“Loss of oligodendrocytes underlies multiple sclerosis and other neurological diseases,” said the study’s principal investigator, Paul Tesar, the Dr. Donald and Ruth Weber Goodman Professor of Innovative Therapeutics and director of the Institute for Glial Sciences at the School of Medicine. “We now show that specific chemicals in consumer products can directly harm oligodendrocytes, representing a previously unrecognized risk factor for neurological disease.” 

On the premise that not enough thorough research has been done on the impact of chemicals on brain health, the researchers analyzed over 1,800 chemicals that may be exposed to humans. They identified chemicals that selectively damaged oligodendrocytes belong to two classes: organophosphate flame retardants and quaternary ammonium compounds. Since quaternary ammonium compounds are present in many personal-care products and disinfectants, which are being used more frequently since the COVID-19 pandemic began, humans are regularly exposed to these chemicals. And many electronics and furniture include organophosphate flame retardants.

The researchers used cellular and organoid systems in the laboratory to show that quaternary ammonium compounds cause oligodendrocytes to die, while organophosphate flame retardants prevented the maturation of oligodendrocytes. 

They demonstrated how the same chemicals damage oligodendrocytes in the developing brains of mice. The researchers also linked exposure to one of the chemicals to poor neurological outcomes in children nationally.

“We found that oligodendrocytes—but not other brain cells—are surprisingly vulnerable to quaternary ammonium compounds and organophosphate flame retardants,” said Erin Cohn, lead author and graduate student in the School of Medicine’s Medical Scientist Training Program. “Understanding human exposure to these chemicals may help explain a missing link in how some neurological diseases arise.” 

The association between human exposure to these chemicals and effects on brain health requires further investigation, the experts warned. Future research must track the chemical levels in the brains of adults and children to determine the amount and length of exposure needed to cause or worsen disease.

“Our findings suggest that more comprehensive scrutiny of the impacts of these common household chemicals on brain health is necessary,” Tesar said. “We hope our work will contribute to informed decisions regarding regulatory measures or behavioral interventions to minimize chemical exposure and protect human health.”

Additional contributing researchers from Case Western Reserve School of Medicine and from the U.S. Environmental Protection Agency included Benjamin Clayton, Mayur Madhavan, Kristin Lee, Sara Yacoub, Yuriy Fedorov, Marissa Scavuzzo, Katie Paul Friedman and Timothy Shafer. 

The research was supported by grants from the National Institutes of Health, National Multiple Sclerosis Society, Howard Hughes Medical Institute and New York Stem Cell Foundation, and philanthropic support by sTF5 Care and the Long, Walter, Peterson, Goodman and Geller families.

###

Case Western Reserve University is one of the country’s leading private research institutions. Located in Cleveland, we offer a unique combination of forward-thinking educational opportunities in an inspiring cultural setting. Our leading-edge faculty engage in teaching and research in a collaborative, hands-on environment. Our nationally recognized programs include arts and sciences, dental medicine, engineering, law, management, medicine, nursing and social work. About 6,000 undergraduate and 6,300 graduate students comprise our student body. Visit case.edu to see how Case Western Reserve thinks beyond the possible.


Read More

Continue Reading

Uncategorized

As mortgage rates remain rangebound, so do new home sales

  – by New Deal democratLet’s begin this post by putting why I am watching new home sales in context.The economy was kept out of recession last year,…

Published

on


 - by New Deal democrat


Let’s begin this post by putting why I am watching new home sales in context.

The economy was kept out of recession last year, despite aggressive Fed rate hikes, in large part by commodity price deflation, much or most of which was triggered by the un-kinking of supply chains after the pandemic. That gale force economic tailwind is gone, but the Fed rate hikes remain. So the big question for this year is whether the effects of the Fed rate hikes have just been delayed, or whether, because the rate hikes have stopped, so has the headwind they normally produce. Watching manufacturing and construction, especially housing construction, is what I expect to supply the answer.

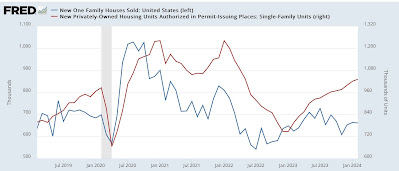
So, to the data, starting with my usual caveat: while new home sales (blue in the graphs below) are the most leading of the housing metrics, they are noisy and heavily revised. There was little this month, as January was only revised higher by 3,000 to 664,000. February gave back -2,000 of that, coming in at 662,000 annualized. In the below graph I also show th slightly less leading but much less noisy single family permits (red, right scale):


Before I discuss this graph a little further, let’s compare sales with the even more leading metric of mortgage rates. Both are shown YoY (rates inverted, and *100 for scale):


Except for the distortion created by the pandemic shutdowns in spring 2020 and the YoY comparisons in spring 2021, we see that new home sales have almost simultaneously followed the trajectory of mortgage rates: the higher the mortgage rate YoY, the lower new home sales YoY. Because mortgage rates remain slightly elevated compared with one year ago, the progress YoY in new home sales has almost completely stopped. As a result, I expect single family permits to follow the more noisy downward trend in month over month comparisons in sales in the immediate future.

In other words, so long as mortgage rates remain in the 6%-7% range, I expect new housing sales and construction to stall out as well, but not to decline significantly either.

Finally, as I always reiterate, prices lag sales. So here’s the YoY update on median prices (red), which are not seasonally adjusted (red) compared with YoY sales:


Again, aside from the spring 2020 and 2021 YoY distortions due to the pandemic lockdowns, we see that prices followed sales higher, and then in 2023 followed sales lower. We will probably continue see negative YoY comparisons in prices for a few months more before they follow sales back higher YoY probably by late this year.

But the big takeaway remains that, generally speaking, I am not expecting much in the way of big moves in new home sales or prices until there is a significant change in mortgage rates.

Read More

Continue Reading

Uncategorized

New Home Sales at 662,000 Annual Rate in February

The Census Bureau reports New Home Sales in February were at a seasonally adjusted annual rate (SAAR) of 662 thousand.

The previous three months were revised up slightly.

Sales of new single‐family houses in February 2024 were at a seasonally adjuste…

Published

on

The Census Bureau reports New Home Sales in February were at a seasonally adjusted annual rate (SAAR) of 662 thousand.

The previous three months were revised up slightly.
Sales of new single‐family houses in February 2024 were at a seasonally adjusted annual rate of 662,000, according to estimates released jointly today by the U.S. Census Bureau and the Department of Housing and Urban Development. This is 0.3 percent below the revised January rate of 664,000, but is 5.9 percent above the February 2023 estimate of 625,000.
emphasis added
Click on graph for larger image.

The first graph shows New Home Sales vs. recessions since 1963. The dashed line is the current sales rate.

New home sales were close to pre-pandemic levels.

The second graph shows New Home Months of Supply.

New Home Sales, Months of SupplyThe months of supply increased in February to 8.4 months from 8.3 months in January.

The all-time record high was 12.2 months of supply in January 2009. The all-time record low was 3.3 months in August 2020.

This is well above the top of the normal range (about 4 to 6 months of supply is normal).
"The seasonally‐adjusted estimate of new houses for sale at the end of February was 463,000. This represents a supply of 8.4 months at the current sales rate."
Sales were below expectations of 673 thousand SAAR, however, sales for the three previous months were revised up slightly. I'll have more later today.

Read More

Continue Reading

Trending