Uncategorized
This Is Nuts – An Entire Market Chasing One Stock
This Is Nuts – An Entire Market Chasing One Stock
Authored by Lance Roberts via RealInvestmentAdvice.com,
“When you sit down with your…
Share this:

Authored by Lance Roberts via RealInvestmentAdvice.com,
“When you sit down with your portfolio management team, and the first comment made is ‘this is nuts,’ it’s probably time to think about your overall portfolio risk. On Friday, that was how the investment committee both started and ended – ‘this is nuts.’”
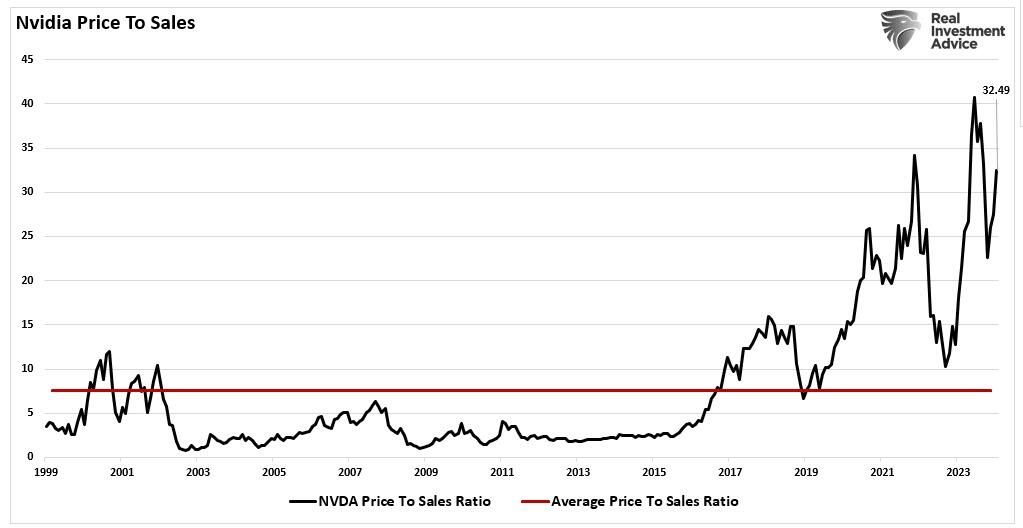
I revisited that original post a couple of weeks ago as the market approached its 5000 psychological milestone. Since then, the entire market has surged higher following last week’s earnings report from Nvidia (NVDA). The reason I say “this is nuts” is the assumption that all companies were going to grow earnings and revenue at Nvidia’s rate.
Even one of the “always bullish” media outlets took notice, which is notable.
“In a normal functioning market, Nvidia doing amazingly is bad news for competitors such as AMD and Intel. Nvidia is selling more of its chips, meaning fewer sales opportunities for rivals. Shouldn’t their stocks drop? Just because Meta owns and uses some new Nvidia chips, how is that going to positively impact its earnings and cash flow over the next four quarters? Will it at all?
The point is that investors are acting irrationally as Nvidia serves up eye-popping financial figures and the hype machine descends on social media. It makes sense until it doesn’t, and that is classic bubble action.” – Yahoo Finance
As Brian Sozzi notes in his article, we may be at the “this is nuts” stage of market exuberance. Such usually coincides with Wall Street analysts stretching to “justify” why paying premiums for companies is “worth it.”
We Can’t All Be Winners
Of course, that is the quintessential underpinning for a market that has reached the “this is nuts” stage. There is little doubt about Nvidia’s earnings and revenue growth rates. However, to maintain that growth pace indefinitely, particularly at 32x price-to-sales, means others like AMD and Intel must lose market share.
However, as shown, numerous companies in the S&P 1500 alone are trading well above 10x price-to-sales. (If you don’t understand why 10x price-to-sales is essential, read this.) Many companies having nothing to do with Nvidia or artificial intelligence, like Wingstop, trade at almost 22x price-to-sales.
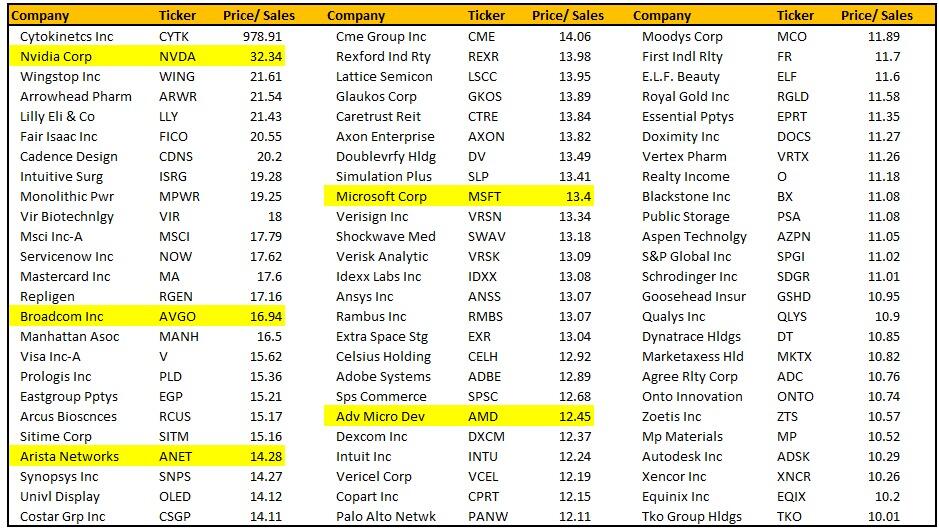
Again, if you don’t understand why “this is nuts,” read the linked article above.
However, in the short term, this doesn’t mean the market can’t keep increasing those premiums even further. As Brian concluded in his article:
“Nothing says ‘investing bubble’ like unbridled confidence. It’s that feeling that whatever stock you buy — at whatever price and at whatever time — will only go up forever. This makes you feel like an investing genius and inclined to take on more risk.”
Looking at some current internals tells us that Brian may be correct.
“This Is Nuts” Type Of Exuberance
In momentum-driven markets, exuberance and greed can take speculative actions to increasingly further extremes. As markets continue to ratchet new all-time highs, the media drives additional hype by producing commentary like the following.
“Going back to 1954, markets are always higher one year later – the only exception was 2007.”
That is a correct statement. When markets hit all-time highs, they are usually higher 12 months later due to the underlying momentum of the market. But therein lies the rub: what happened next? The table below from Warren Pies tells the tale.

As shown, markets were higher 12 months after new highs were made. However, a lot of money was lost during the next bear market or correction. Except for only four periods, those bear markets occurred within the next 24 to 48 months. Most gains from the previous highs were lost in the subsequent downturn.
Unsurprisingly, investing in the market is not a “risk-free” adventure. While there are many opportunities to make money, there is also a history of wealth devastation. Therefore, understanding the environment you are investing in can help avoid potential capital destruction.
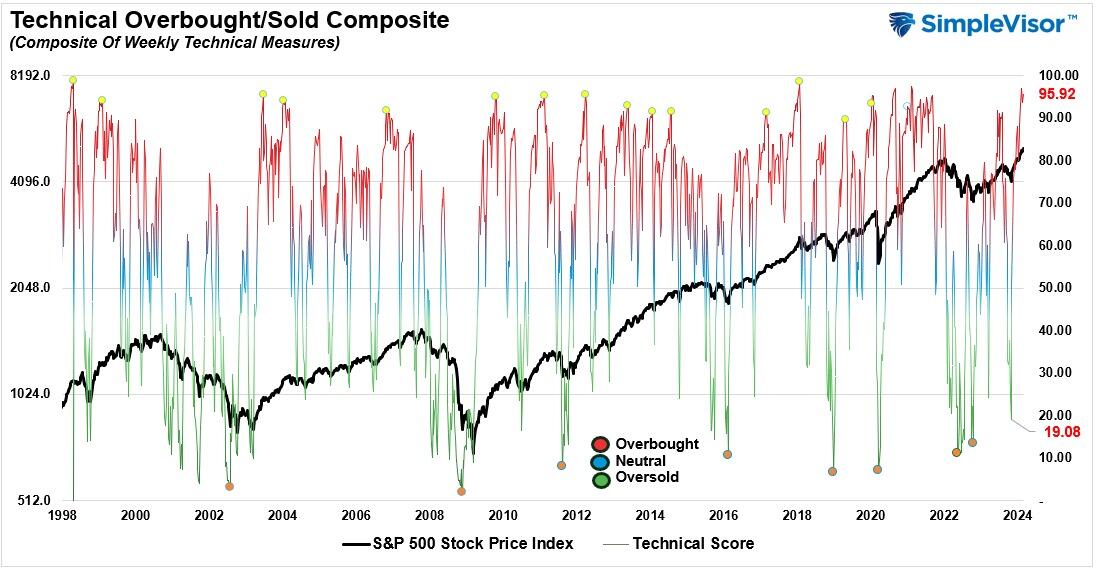
From a technical perspective, markets are exceedingly overbought as investors have rushed back into equities following the correction in 2022. The composite index below comprises nine indicators measured using weekly data. That index is now at levels that have denoted short-term market peaks.
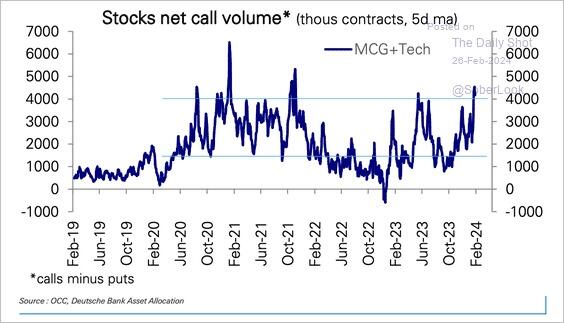
Unsurprisingly, speculative money is chasing the Mega-cap growth and technology stocks. The volume of call options on those stocks is at levels that have previously preceded more significant corrections.
Another way to view the current momentum-driven advance in the market is by measuring the divergence between short and long-term moving averages. Given that moving averages smooth price changes over given periods, the divergences should not deviate significantly from each other over more extended periods. However, as shown below, that changed dramatically following the stimulus-fueled surge in the markets post-pandemic. Currently, the deviation between the weekly moving averages is at levels only previously seen when the Government sent checks to households, overnight lending rates were zero, and the Fed bought $120 billion monthly in bonds. Yet, none of that is happening currently.

Unsurprisingly, with the surge in market prices, investor confidence has surged along with their allocation to equities. The most recent Schwab Survey of bullish sentiment suggests the same.
“More than half of traders have a bullish outlook for the first quarter – the highest level of bullishness since 2021“
Yes, quite simply, “This is nuts.”
Market Measures Advise Caution
In the short term, over the next 12 months, the market will indeed likely finish the year higher than where it started. That is what the majority of analysis tells us. However, that doesn’t mean that stocks can’t, and won’t, suffer a rather significant correction along the way. The chart below shows retail and professional traders’ 13-week average of net bullish sentiment. You will notice that high sentiment readings often precede market corrections while eventually rising to higher levels.
For example, the last time bullish sentiment was this extreme was in late 2021. Even though the market eventually rallied to all-time highs, it was 2-years before investors got back to even.

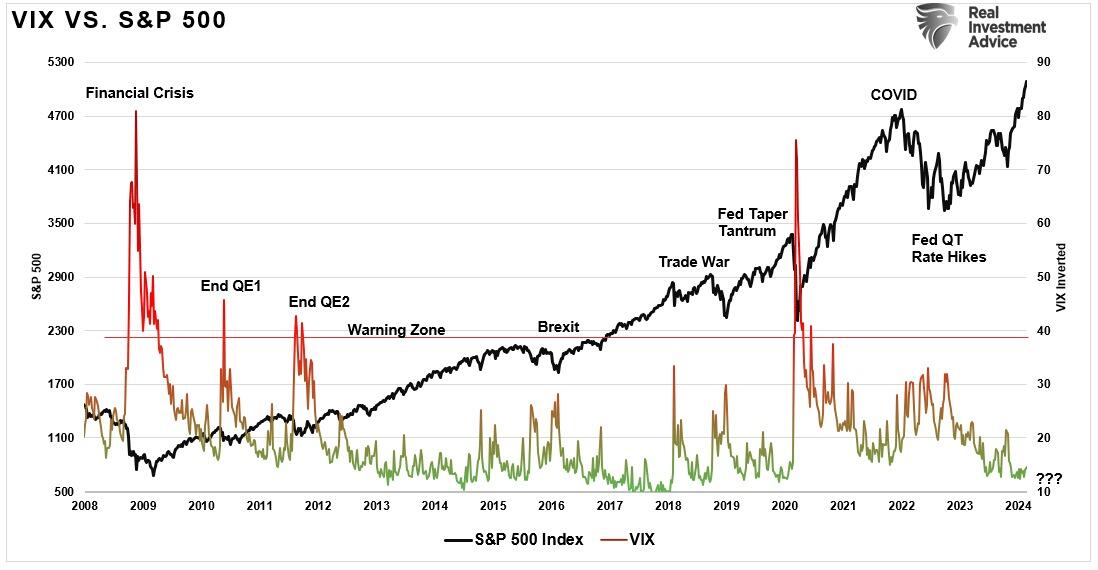
Furthermore, the compression of volatility remains a critical near-term concern. While low levels of volatility have become increasingly common since the financial crisis due to the suppression of interest rates and a flood of liquidity, the lack of volatility provides the “fuel” for a market correction.
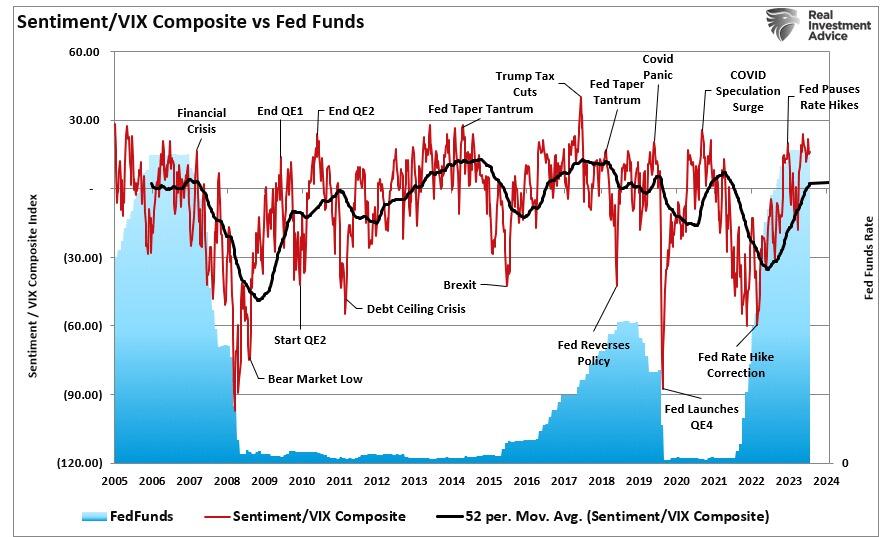
Combining excessive bullish sentiment and low volatility into a single indicator shows that previous levels were warnings to more bullish investors. Interestingly, Fed rate cuts cause excess sentiment to unwind. This is because rate cuts have historically coincided with financial events and recessions.
While none of this should be surprising, given the current market momentum and bullish psychology, the over-confidence of investors in their decision-making has always had less than desirable outcomes.
No. The markets likely will not crash tomorrow or in the next few months. However, sentiment has reached the “this is nuts” stage. For us, as portfolio managers, such has always been an excellent time to start laying the groundwork to protect our gains.
“Lean on your investing experience and all its wrinkles.” – Brian Sozzi
Uncategorized
Comments on February Employment Report
The headline jobs number in the February employment report was above expectations; however, December and January payrolls were revised down by 167,000 combined. The participation rate was unchanged, the employment population ratio decreased, and the …
Share this:


Prime (25 to 54 Years Old) Participation
Since the overall participation rate is impacted by both cyclical (recession) and demographic (aging population, younger people staying in school) reasons, here is the employment-population ratio for the key working age group: 25 to 54 years old.
The 25 to 54 years old participation rate increased in February to 83.5% from 83.3% in January, and the 25 to 54 employment population ratio increased to 80.7% from 80.6% the previous month.
Average Hourly Wages
 The graph shows the nominal year-over-year change in "Average Hourly Earnings" for all private employees from the Current Employment Statistics (CES).
 Wage growth has trended down after peaking at 5.9% YoY in March 2022 and was at 4.3% YoY in February.
Part Time for Economic Reasons
 From the BLS report:
"The number of people employed part time for economic reasons, at 4.4 million, changed little in February. These individuals, who would have preferred full-time employment, were working part time because their hours had been reduced or they were unable to find full-time jobs."The number of persons working part time for economic reasons decreased in February to 4.36 million from 4.42 million in February. This is slightly above pre-pandemic levels.
These workers are included in the alternate measure of labor underutilization (U-6) that increased to 7.3% from 7.2% in the previous month. This is down from the record high in April 2020 of 23.0% and up from the lowest level on record (seasonally adjusted) in December 2022 (6.5%). (This series started in 1994). This measure is above the 7.0% level in February 2020 (pre-pandemic).
Unemployed over 26 Weeks
 This graph shows the number of workers unemployed for 27 weeks or more.
 According to the BLS, there are 1.203 million workers who have been unemployed for more than 26 weeks and still want a job, down from 1.277 million the previous month.
This is close to pre-pandemic levels.
Job Streak
| Headline Jobs, Top 10 Streaks | ||
|---|---|---|
| Year Ended | Streak, Months | |
| 1 | 2019 | 100 |
| 2 | 1990 | 48 |
| 3 | 2007 | 46 |
| 4 | 1979 | 45 |
| 5 | 20241 | 38 |
| 6 tie | 1943 | 33 |
| 6 tie | 1986 | 33 |
| 6 tie | 2000 | 33 |
| 9 | 1967 | 29 |
| 10 | 1995 | 25 |
| 1Currrent Streak | ||
Summary:
The headline monthly jobs number was above consensus expectations; however, December and January payrolls were revised down by 167,000 combined. The participation rate was unchanged, the employment population ratio decreased, and the unemployment rate was increased to 3.9%. Another solid report.
Uncategorized
Immune cells can adapt to invading pathogens, deciding whether to fight now or prepare for the next battle
When faced with a threat, T cells have the decision-making flexibility to both clear out the pathogen now and ready themselves for a future encounter.
Share this:


How does your immune system decide between fighting invading pathogens now or preparing to fight them in the future? Turns out, it can change its mind.
Every person has 10 million to 100 million unique T cells that have a critical job in the immune system: patrolling the body for invading pathogens or cancerous cells to eliminate. Each of these T cells has a unique receptor that allows it to recognize foreign proteins on the surface of infected or cancerous cells. When the right T cell encounters the right protein, it rapidly forms many copies of itself to destroy the offending pathogen.

Importantly, this process of proliferation gives rise to both short-lived effector T cells that shut down the immediate pathogen attack and long-lived memory T cells that provide protection against future attacks. But how do T cells decide whether to form cells that kill pathogens now or protect against future infections?
We are a team of bioengineers studying how immune cells mature. In our recently published research, we found that having multiple pathways to decide whether to kill pathogens now or prepare for future invaders boosts the immune system’s ability to effectively respond to different types of challenges.
Fight or remember?
To understand when and how T cells decide to become effector cells that kill pathogens or memory cells that prepare for future infections, we took movies of T cells dividing in response to a stimulus mimicking an encounter with a pathogen.
Specifically, we tracked the activity of a gene called T cell factor 1, or TCF1. This gene is essential for the longevity of memory cells. We found that stochastic, or probabilistic, silencing of the TCF1 gene when cells confront invading pathogens and inflammation drives an early decision between whether T cells become effector or memory cells. Exposure to higher levels of pathogens or inflammation increases the probability of forming effector cells.
Surprisingly, though, we found that some effector cells that had turned off TCF1 early on were able to turn it back on after clearing the pathogen, later becoming memory cells.
Through mathematical modeling, we determined that this flexibility in decision making among memory T cells is critical to generating the right number of cells that respond immediately and cells that prepare for the future, appropriate to the severity of the infection.
Understanding immune memory
The proper formation of persistent, long-lived T cell memory is critical to a person’s ability to fend off diseases ranging from the common cold to COVID-19 to cancer.
From a social and cognitive science perspective, flexibility allows people to adapt and respond optimally to uncertain and dynamic environments. Similarly, for immune cells responding to a pathogen, flexibility in decision making around whether to become memory cells may enable greater responsiveness to an evolving immune challenge.
Memory cells can be subclassified into different types with distinct features and roles in protective immunity. It’s possible that the pathway where memory cells diverge from effector cells early on and the pathway where memory cells form from effector cells later on give rise to particular subtypes of memory cells.
Our study focuses on T cell memory in the context of acute infections the immune system can successfully clear in days, such as cold, the flu or food poisoning. In contrast, chronic conditions such as HIV and cancer require persistent immune responses; long-lived, memory-like cells are critical for this persistence. Our team is investigating whether flexible memory decision making also applies to chronic conditions and whether we can leverage that flexibility to improve cancer immunotherapy.
Resolving uncertainty surrounding how and when memory cells form could help improve vaccine design and therapies that boost the immune system’s ability to provide long-term protection against diverse infectious diseases.
Kathleen Abadie was funded by a NSF (National Science Foundation) Graduate Research Fellowships. She performed this research in affiliation with the University of Washington Department of Bioengineering.
Elisa Clark performed her research in affiliation with the University of Washington (UW) Department of Bioengineering and was funded by a National Science Foundation Graduate Research Fellowship (NSF-GRFP) and by a predoctoral fellowship through the UW Institute for Stem Cell and Regenerative Medicine (ISCRM).
Hao Yuan Kueh receives funding from the National Institutes of Health.
stimulus covid-19 yuan vaccine stimulusUncategorized
Stock indexes are breaking records and crossing milestones – making many investors feel wealthier
The S&P 500 topped 5,000 on Feb. 9, 2024, for the first time. The Dow Jones Industrial Average will probably hit a new big round number soon t…
Share this:


The S&P 500 stock index topped 5,000 for the first time on Feb. 9, 2024, exciting some investors and garnering a flurry of media coverage. The Conversation asked Alexander Kurov, a financial markets scholar, to explain what stock indexes are and to say whether this kind of milestone is a big deal or not.
What are stock indexes?
Stock indexes measure the performance of a group of stocks. When prices rise or fall overall for the shares of those companies, so do stock indexes. The number of stocks in those baskets varies, as does the system for how this mix of shares gets updated.
The Dow Jones Industrial Average, also known as the Dow, includes shares in the 30 U.S. companies with the largest market capitalization – meaning the total value of all the stock belonging to shareholders. That list currently spans companies from Apple to Walt Disney Co.
The S&P 500 tracks shares in 500 of the largest U.S. publicly traded companies.
The Nasdaq composite tracks performance of more than 2,500 stocks listed on the Nasdaq stock exchange.
The DJIA, launched on May 26, 1896, is the oldest of these three popular indexes, and it was one of the first established.
Two enterprising journalists, Charles H. Dow and Edward Jones, had created a different index tied to the railroad industry a dozen years earlier. Most of the 12 stocks the DJIA originally included wouldn’t ring many bells today, such as Chicago Gas and National Lead. But one company that only got booted in 2018 had stayed on the list for 120 years: General Electric.
The S&P 500 index was introduced in 1957 because many investors wanted an option that was more representative of the overall U.S. stock market. The Nasdaq composite was launched in 1971.
You can buy shares in an index fund that mirrors a particular index. This approach can diversify your investments and make them less prone to big losses.
Index funds, which have only existed since Vanguard Group founder John Bogle launched the first one in 1976, now hold trillions of dollars .
Why are there so many?
There are hundreds of stock indexes in the world, but only about 50 major ones.
Most of them, including the Nasdaq composite and the S&P 500, are value-weighted. That means stocks with larger market values account for a larger share of the index’s performance.
In addition to these broad-based indexes, there are many less prominent ones. Many of those emphasize a niche by tracking stocks of companies in specific industries like energy or finance.
Do these milestones matter?
Stock prices move constantly in response to corporate, economic and political news, as well as changes in investor psychology. Because company profits will typically grow gradually over time, the market usually fluctuates in the short term, while increasing in value over the long term.
The DJIA first reached 1,000 in November 1972, and it crossed the 10,000 mark on March 29, 1999. On Jan. 22, 2024, it surpassed 38,000 for the first time. Investors and the media will treat the new record set when it gets to another round number – 40,000 – as a milestone.
The S&P 500 index had never hit 5,000 before. But it had already been breaking records for several weeks.
Because there’s a lot of randomness in financial markets, the significance of round-number milestones is mostly psychological. There is no evidence they portend any further gains.
For example, the Nasdaq composite first hit 5,000 on March 10, 2000, at the end of the dot-com bubble.
The index then plunged by almost 80% by October 2002. It took 15 years – until March 3, 2015 – for it return to 5,000.
By mid-February 2024, the Nasdaq composite was nearing its prior record high of 16,057 set on Nov. 19, 2021.
Index milestones matter to the extent they pique investors’ attention and boost market sentiment.
Investors afflicted with a fear of missing out may then invest more in stocks, pushing stock prices to new highs. Chasing after stock trends may destabilize markets by moving prices away from their underlying values.
When a stock index passes a new milestone, investors become more aware of their growing portfolios. Feeling richer can lead them to spend more.
This is called the wealth effect. Many economists believe that the consumption boost that arises in response to a buoyant stock market can make the economy stronger.
Is there a best stock index to follow?
Not really. They all measure somewhat different things and have their own quirks.
For example, the S&P 500 tracks many different industries. However, because it is value-weighted, it’s heavily influenced by only seven stocks with very large market values.
Known as the “Magnificent Seven,” shares in Amazon, Apple, Alphabet, Meta, Microsoft, Nvidia and Tesla now account for over one-fourth of the S&P 500’s value. Nearly all are in the tech sector, and they played a big role in pushing the S&P across the 5,000 mark.
This makes the index more concentrated on a single sector than it appears.
But if you check out several stock indexes rather than just one, you’ll get a good sense of how the market is doing. If they’re all rising quickly or breaking records, that’s a clear sign that the market as a whole is gaining.
Sometimes the smartest thing is to not pay too much attention to any of them.
For example, after hitting record highs on Feb. 19, 2020, the S&P 500 plunged by 34% in just 23 trading days due to concerns about what COVID-19 would do to the economy. But the market rebounded, with stock indexes hitting new milestones and notching new highs by the end of that year.
Panicking in response to short-term market swings would have made investors more likely to sell off their investments in too big a hurry – a move they might have later regretted. This is why I believe advice from the immensely successful investor and fan of stock index funds Warren Buffett is worth heeding.
Buffett, whose stock-selecting prowess has made him one of the world’s 10 richest people, likes to say “Don’t watch the market closely.”
If you’re reading this because stock prices are falling and you’re wondering if you should be worried about that, consider something else Buffett has said: “The light can at any time go from green to red without pausing at yellow.”
And the opposite is true as well.
Alexander Kurov does not work for, consult, own shares in or receive funding from any company or organization that would benefit from this article, and has disclosed no relevant affiliations beyond their academic appointment.
dow jones sp 500 nasdaq stocks covid-19

Watch Live: President Biden Reminds Americans Just How Good They’ve Got It Thanks To Him


Watch: President Biden Delivers The “Darkest, Most Un-American Speech Given By A President”


Interest rates, the best it gets. It’s time to deploy cash


Is the biotech market rally real? Data suggest comeback in private, public markets


People Who Received Ivermectin Were Better Off, Study Finds


Europe Is Alarmed Enough To Begin Wargaming A Food Crisis


Normalise the underlying conditions when “rating” a company’s share price


COVID-19 Lockdowns Had High Health, Economic Costs: Swedish Study


Racial and Ethnic Wealth Inequality in the Post‑Pandemic Era


Stock Market’s Top Will Outlast Your Disbelief
-

 Uncategorized2 weeks ago
All Of The Elements Are In Place For An Economic Crisis Of Staggering Proportions
-

 Uncategorized1 month ago
Cathie Wood sells a major tech stock (again)
-

 Uncategorized3 weeks ago
California Counties Could Be Forced To Pay $300 Million To Cover COVID-Era Program
-

 Uncategorized2 weeks ago
Apparel Retailer Express Moving Toward Bankruptcy
-

 Uncategorized3 weeks ago
Industrial Production Decreased 0.1% in January
-

 International1 month ago
War Delirium
-

 Uncategorized3 weeks ago
RFK Jr: The Wuhan Cover-Up & The Rise Of The Biowarfare-Industrial Complex
-

 Uncategorized3 weeks ago
GOP Efforts To Shore Up Election Security In Swing States Face Challenges