The Most Important Chart For Understanding Coronavirus
The Most Important Chart For Understanding Coronavirus
Share this:


Whitney Tilson’s email to investors discussing the best chart EVER on how the coronavirus developed in China and the implications for us; What happens after big first-quarter declines?; Luckin Coffee collapses.

Q4 2019 hedge fund letters, conferences and more
How The Coronavirus Developed In China
1) STOP THE PRESSES!
The chart below, which shows how the coronavirus developed in China, may be the best, most important one I've ever shared...
As you know, the virus follows a fairly predictable pattern that can last for more than a month. First, a certain number of people get infected. Then, over many days, some of them begin to show symptoms. Then, subsequent days later, some need to be hospitalized. Finally, often weeks later, patients either recover (albeit some with long-term issues like lung damage) or die. There's a lag effect – like a pig in a python. It's critical to understand this... but most people don't.
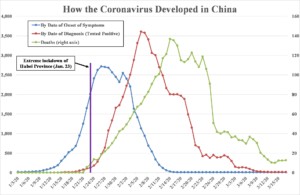
In this chart, for each person who tested positive, there are three dates: When they said they first started feeling sick (the blue line shows the total number of such people in China each day), when they tested positive (red line), and when a small fraction of them died (green line). Each data point is a three-day average. Take a look...

Source: JAMA (symptoms) (original source here); Worldometers (tests and deaths).
For each metric, you can see a surge and then rapid decline, but at different times.
The number of new people showing symptoms peaked on January 26, but the peak in the number of new cases per day wasn't until 11 days later on February 6.
This reflects two things: first, most people don't rush to get tested the day they first start having symptoms like a mild sore throat, cough, and fever. Most probably figure it's just a regular cold, so they don't seek treatment – much less get tested – until they're really feeling lousy a week or two later. Then, compounding the delay, there were testing delays in China, just like we're seeing here.
And the peak in deaths wasn't for another eight days on February 14.
Look at what happened in how coronavirus developed in China (mostly the city of Wuhan): the number of infected people rose rapidly, about 10 times, from 190 to 2,008 (trailing three-day average) – in only nine days from January 14 to January 23. That's when the Chinese government did an about-face and implemented an extreme lockdown of the entire province, shown by the purple vertical line in the chart above.
And it worked – almost immediately! As you can see, the number of newly infected people only rose slightly the next three days, peaking at 2,717, and then, in less than three weeks, steadily dropped to almost zero!
But here's the key: nobody could see this.
Instead, people could only see the number of reported new cases – the red line. Looking at the data, one would no doubt be convinced (wrongly!) that the lockdown wasn't working because reported new cases were skyrocketing.
To repeat: whereas the actual number of new cases peaked almost immediately after the lockdown, the peak in the reported number of new cases didn't occur for another 14 days!
In summary, as soon as China locked down Hubei province, the growth of actual new cases plateaued and started to fall within days, dropping to almost zero within three weeks. Yet reported new cases soared for another two weeks as testing caught up with what was really happening.
And deaths – which is what really generates headlines and panic – didn't peak until eight days after that.
I'm cautiously optimistic that the same phenomenon is playing out right now in the U.S.
I can't prove it, though. It's an educated guess, nothing more.
The reality is, until there is more widespread testing and we get another week or two of data, we're all flying blind. Nobody knows how many people are actually infected here in the U.S. right now, where they are, and how rapidly that number is growing.
Because we can't answer these questions, those who are making the most extreme predictions are getting the most attention – and nobody can prove them wrong.
But what I do know is, because of the lag effect, even if the measures we've taken in the past couple weeks are working well (as I believe they are), bringing the virus's replication rate well below 1.0, we won't know it.
As a result, the number of new cases, hospitalizations, and deaths will almost certainly continue to go up for at least a couple of weeks, almost certainly leading to universally bad headlines in the U.S. and Europe during this period.
So, fasten your seat - belt - based on how coronavirus developed – it's going to be a wild ride going forward.
But don't panic and don't lose hope!
What Happens After Big First-Quarter Declines?
2) Here's some more evidence that it's time to buy, even with the terrible headlines and uncertainty (if you want to wait for a clear outlook, stocks will be 30% higher!)... Ryan Detrick at LPL Financial looked at the returns for the S&P 500 Index after big declines in the first quarter:

Luckin Coffee Collapses
3) China's Luckin Coffee (LK) collapsed by 76% yesterday to $6.40 after the company admitted that it's investigating "fabricated sales" that could total more than $300 million, and said its prior guidance and sales figures from the second quarter of 2019 to the fourth quarter of 2019 are no longer reliable.
I trust none of my readers got caught in this debacle – and maybe some even profited on the short side – because in my February 11 e-mail, with the stock at $38.15, I warned my readers about it. As I said:
Speaking of stocks to avoid, investors have fallen hard for the growth story surrounding China's Luckin Coffee (LK)... awarding the company a $9.3 billion market cap, which is equal to a nosebleed 19.5 times trailing revenues. I saw Luckin's presentation at the ICR Conference last month and have to admit that I was impressed.
But as with so many other Chinese companies (it remains the Wild West over there), Luckin may not be all that it claims to be, as MarketWatch highlights: Luckin Coffee stock sinks after anonymous report alleges fraud.
For more color on this, I e-mailed my friend, famed short-seller Carson Block of Muddy Waters Research, who released the report on behalf of the author (who wishes to remain anonymous for good reason: China has been known to harass and even imprison those who publish negative articles about companies, no matter how accurate the information).
Carson e-mailed me the full 89-page report and said I could share it, so I've posted it here. He added:
I know who wrote it, so when I Tweeted it, I wrote "unattributed" as opposed to "anonymous." He's a serious, smart money guy.
Here's the Executive Summary:
When Luckin Coffee (Nasdaq: LK) ("Luckin" or the "Company") went public in May 2019, it was a fundamentally broken business that was attempting to instill the culture of drinking coffee into Chinese consumers through cut-throat discounts and free giveaway coffee. Right after its $645 million IPO, the Company had evolved into a fraud by fabricating financial and operating numbers starting in third quarter 2019. It delivered a set of results that showcased a dramatic business inflection point and sent its stock price up over 160% in a little over two months. Not surprisingly, it wasted no time to successfully raise another $1.1 billion (including secondary placement) in January 2020. Luckin knows exactly what investors are looking for, how to position itself as a growth stock with a fantastic story, and what key metrics to manipulate to maximize investor confidence. This report consists of two parts: the fraud and the fundamentally broken business, where we separately demonstrate how Luckin faked its numbers and why its business model is inherently flawed.
I haven't done any research on Luckin, but after reading the report, I think it's very well done.
Luckin stockholders, beware!
The post The Most Important Chart For Understanding Coronavirus appeared first on ValueWalk.
Government
Low Iron Levels In Blood Could Trigger Long COVID: Study
Low Iron Levels In Blood Could Trigger Long COVID: Study
Authored by Amie Dahnke via The Epoch Times (emphasis ours),
People with inadequate…
Share this:


Authored by Amie Dahnke via The Epoch Times (emphasis ours),
People with inadequate iron levels in their blood due to a COVID-19 infection could be at greater risk of long COVID.
A new study indicates that problems with iron levels in the bloodstream likely trigger chronic inflammation and other conditions associated with the post-COVID phenomenon. The findings, published on March 1 in Nature Immunology, could offer new ways to treat or prevent the condition.
Long COVID Patients Have Low Iron Levels
Researchers at the University of Cambridge pinpointed low iron as a potential link to long-COVID symptoms thanks to a study they initiated shortly after the start of the pandemic. They recruited people who tested positive for the virus to provide blood samples for analysis over a year, which allowed the researchers to look for post-infection changes in the blood. The researchers looked at 214 samples and found that 45 percent of patients reported symptoms of long COVID that lasted between three and 10 months.
In analyzing the blood samples, the research team noticed that people experiencing long COVID had low iron levels, contributing to anemia and low red blood cell production, just two weeks after they were diagnosed with COVID-19. This was true for patients regardless of age, sex, or the initial severity of their infection.
According to one of the study co-authors, the removal of iron from the bloodstream is a natural process and defense mechanism of the body.
But it can jeopardize a person’s recovery.
“When the body has an infection, it responds by removing iron from the bloodstream. This protects us from potentially lethal bacteria that capture the iron in the bloodstream and grow rapidly. It’s an evolutionary response that redistributes iron in the body, and the blood plasma becomes an iron desert,” University of Oxford professor Hal Drakesmith said in a press release. “However, if this goes on for a long time, there is less iron for red blood cells, so oxygen is transported less efficiently affecting metabolism and energy production, and for white blood cells, which need iron to work properly. The protective mechanism ends up becoming a problem.”
The research team believes that consistently low iron levels could explain why individuals with long COVID continue to experience fatigue and difficulty exercising. As such, the researchers suggested iron supplementation to help regulate and prevent the often debilitating symptoms associated with long COVID.
“It isn’t necessarily the case that individuals don’t have enough iron in their body, it’s just that it’s trapped in the wrong place,” Aimee Hanson, a postdoctoral researcher at the University of Cambridge who worked on the study, said in the press release. “What we need is a way to remobilize the iron and pull it back into the bloodstream, where it becomes more useful to the red blood cells.”
The research team pointed out that iron supplementation isn’t always straightforward. Achieving the right level of iron varies from person to person. Too much iron can cause stomach issues, ranging from constipation, nausea, and abdominal pain to gastritis and gastric lesions.
1 in 5 Still Affected by Long COVID
COVID-19 has affected nearly 40 percent of Americans, with one in five of those still suffering from symptoms of long COVID, according to the U.S. Centers for Disease Control and Prevention (CDC). Long COVID is marked by health issues that continue at least four weeks after an individual was initially diagnosed with COVID-19. Symptoms can last for days, weeks, months, or years and may include fatigue, cough or chest pain, headache, brain fog, depression or anxiety, digestive issues, and joint or muscle pain.
Uncategorized
February Employment Situation
By Paul Gomme and Peter Rupert The establishment data from the BLS showed a 275,000 increase in payroll employment for February, outpacing the 230,000…
Share this:


By Paul Gomme and Peter Rupert
The establishment data from the BLS showed a 275,000 increase in payroll employment for February, outpacing the 230,000 average over the previous 12 months. The payroll data for January and December were revised down by a total of 167,000. The private sector added 223,000 new jobs, the largest gain since May of last year.

Temporary help services employment continues a steep decline after a sharp post-pandemic rise.


Average hours of work increased from 34.2 to 34.3. The increase, along with the 223,000 private employment increase led to a hefty increase in total hours of 5.6% at an annualized rate, also the largest increase since May of last year.

The establishment report, once again, beat “expectations;” the WSJ survey of economists was 198,000. Other than the downward revisions, mentioned above, another bit of negative news was a smallish increase in wage growth, from $34.52 to $34.57.

The household survey shows that the labor force increased 150,000, a drop in employment of 184,000 and an increase in the number of unemployed persons of 334,000. The labor force participation rate held steady at 62.5, the employment to population ratio decreased from 60.2 to 60.1 and the unemployment rate increased from 3.66 to 3.86. Remember that the unemployment rate is the number of unemployed relative to the labor force (the number employed plus the number unemployed). Consequently, the unemployment rate can go up if the number of unemployed rises holding fixed the labor force, or if the labor force shrinks holding the number unemployed unchanged. An increase in the unemployment rate is not necessarily a bad thing: it may reflect a strong labor market drawing “marginally attached” individuals from outside the labor force. Indeed, there was a 96,000 decline in those workers.


Earlier in the week, the BLS announced JOLTS (Job Openings and Labor Turnover Survey) data for January. There isn’t much to report here as the job openings changed little at 8.9 million, the number of hires and total separations were little changed at 5.7 million and 5.3 million, respectively.

As has been the case for the last couple of years, the number of job openings remains higher than the number of unemployed persons.

Also earlier in the week the BLS announced that productivity increased 3.2% in the 4th quarter with output rising 3.5% and hours of work rising 0.3%.

The bottom line is that the labor market continues its surprisingly (to some) strong performance, once again proving stronger than many had expected. This strength makes it difficult to justify any interest rate cuts soon, particularly given the recent inflation spike.
unemployment pandemic unemploymentSpread & Containment
Another beloved brewery files Chapter 11 bankruptcy
The beer industry has been devastated by covid, changing tastes, and maybe fallout from the Bud Light scandal.
Share this:


Before the covid pandemic, craft beer was having a moment. Most cities had multiple breweries and taprooms with some having so many that people put together the brewery version of a pub crawl.
It was a period where beer snobbery ruled the day and it was not uncommon to hear bar patrons discuss the makeup of the beer the beer they were drinking. This boom period always seemed destined for failure, or at least a retraction as many markets seemed to have more craft breweries than they could support.
Related: Fast-food chain closes more stores after Chapter 11 bankruptcy
The pandemic, however, hastened that downfall. Many of these local and regional craft breweries counted on in-person sales to drive their business.
And while many had local and regional distribution, selling through a third party comes with much lower margins. Direct sales drove their business and the pandemic forced many breweries to shut down their taprooms during the period where social distancing rules were in effect.
During those months the breweries still had rent and employees to pay while little money was coming in. That led to a number of popular beermakers including San Francisco's nationally-known Anchor Brewing as well as many regional favorites including Chicago’s Metropolitan Brewing, New Jersey’s Flying Fish, Denver’s Joyride Brewing, Tampa’s Zydeco Brew Werks, and Cleveland’s Terrestrial Brewing filing bankruptcy.
Some of these brands hope to survive, but others, including Anchor Brewing, fell into Chapter 7 liquidation. Now, another domino has fallen as a popular regional brewery has filed for Chapter 11 bankruptcy protection.
Image source: Shutterstock
Covid is not the only reason for brewery bankruptcies
While covid deserves some of the blame for brewery failures, it's not the only reason why so many have filed for bankruptcy protection. Overall beer sales have fallen driven by younger people embracing non-alcoholic cocktails, and the rise in popularity of non-beer alcoholic offerings,
Beer sales have fallen to their lowest levels since 1999 and some industry analysts
"Sales declined by more than 5% in the first nine months of the year, dragged down not only by the backlash and boycotts against Anheuser-Busch-owned Bud Light but the changing habits of younger drinkers," according to data from Beer Marketer’s Insights published by the New York Post.
Bud Light parent Anheuser Busch InBev (BUD) faced massive boycotts after it partnered with transgender social media influencer Dylan Mulvaney. It was a very small partnership but it led to a right-wing backlash spurred on by Kid Rock, who posted a video on social media where he chastised the company before shooting up cases of Bud Light with an automatic weapon.
Another brewery files Chapter 11 bankruptcy
Gizmo Brew Works, which does business under the name Roth Brewing Company LLC, filed for Chapter 11 bankruptcy protection on March 8. In its filing, the company checked the box that indicates that its debts are less than $7.5 million and it chooses to proceed under Subchapter V of Chapter 11.
"Both small business and subchapter V cases are treated differently than a traditional chapter 11 case primarily due to accelerated deadlines and the speed with which the plan is confirmed," USCourts.gov explained.
Roth Brewing/Gizmo Brew Works shared that it has 50-99 creditors and assets $100,000 and $500,000. The filing noted that the company does expect to have funds available for unsecured creditors.
The popular brewery operates three taprooms and sells its beer to go at those locations.
"Join us at Gizmo Brew Works Craft Brewery and Taprooms located in Raleigh, Durham, and Chapel Hill, North Carolina. Find us for entertainment, live music, food trucks, beer specials, and most importantly, great-tasting craft beer by Gizmo Brew Works," the company shared on its website.
The company estimates that it has between $1 and $10 million in liabilities (a broad range as the bankruptcy form does not provide a space to be more specific).
Gizmo Brew Works/Roth Brewing did not share a reorganization or funding plan in its bankruptcy filing. An email request for comment sent through the company's contact page was not immediately returned.
bankruptcy pandemic social distancing


Walmart launches clever answer to Target’s new membership program


EyePoint poaches medical chief from Apellis; Sandoz CFO, longtime BioNTech exec to retire


Wendy’s has a new deal for daylight savings time haters


Watch Live: President Biden Reminds Americans Just How Good They’ve Got It Thanks To Him


Catastrophic Risk: Investing and Business Implications


When Military Rule Supplants Democracy


The Digest #187


Racial and Ethnic Wealth Inequality in the Post‑Pandemic Era


Redefining Poverty: Towards a Transpartisan Approach


Watch: President Biden Delivers The “Darkest, Most Un-American Speech Given By A President”
-

 Uncategorized2 weeks ago
All Of The Elements Are In Place For An Economic Crisis Of Staggering Proportions
-

 Uncategorized1 month ago
Cathie Wood sells a major tech stock (again)
-

 Uncategorized3 weeks ago
California Counties Could Be Forced To Pay $300 Million To Cover COVID-Era Program
-

 Uncategorized2 weeks ago
Apparel Retailer Express Moving Toward Bankruptcy
-

 Uncategorized3 weeks ago
Industrial Production Decreased 0.1% in January
-
International1 day ago
Walmart launches clever answer to Target’s new membership program
-

 Uncategorized3 weeks ago
RFK Jr: The Wuhan Cover-Up & The Rise Of The Biowarfare-Industrial Complex
-

 Uncategorized3 weeks ago
GOP Efforts To Shore Up Election Security In Swing States Face Challenges