Uncategorized
The Housing Market Just Hit Its Most Grim Milestone Yet
Only one in five homes listed in 2022 was affordable for a typical U.S. household.
Share this:


Only one in five homes listed in 2022 was affordable for a typical U.S. household.
Over the last year, many people interested in a move or a home bought as an investment have scrolled online listings only to find that there's nothing affordable on the market. U.S. home prices rose by 32% in the last three years while homes that fall below a given area's median tend to spike even more dramatically, while new inventory is also not being built fast enough.
All this has come together to create a record low when it comes to affordability -- according to an annual report by real estate platform Redfin (RDFN) - Get Free Report, only 21% of the homes on the market in 2022 were affordable for a typical U.S. household.
DON'T MISS: This City Is Overtaking New York, LA and London in Luxury Real Estate
That number was at two in five (40%) in 2021 and 45% in 2020. At 50%, affordability was highest in 2013 when Redfin first began doing this study.
Shutterstock
This Is What Affordability Means When It Comes To Home-Buying
"Affordable" is classified as having an "estimated monthly mortgage payment is no more than 30% of the local county's median income." By March 2023, the number of such listings was down 53% from a year ago.
Prices are 12% below the peak in May but still extremely high after years of astronomical home price growth. Cities with the biggest drops in affordable listings include Idaho's Boise (86% drop), San Diego (85% drop) and Salt Lake City (84%).
People who have less starting wealth, such as younger or first-time buyers or historically marginalized groups, find themselves in a particularly challenging situation -- Redfin's data shows that only 9% of homes on the market in 2022 was affordable for a typical Black American household while that number is at 28% for white households and 34% for Asian households.
"Housing affordability is at the lowest level in history, which will widen the wealth gap -- especially between millennials," Taylor Marr, deputy chief economist at Redfin, said in a statement. "Many millennials were able to buy their first home before or during the pandemic home buying boom, but many others were priced out of homeownership and forced to keep renting. That means a lot of young adults missed out on a major wealth building opportunity: the value of homes owned by millennials has risen nearly 30% in the past year."
There Is Some Good News When It Comes To The Housing Market
Cities high on this list are generally extremely expensive to begin with, like San Diego, or places that have been seeing an inflow of new residents during the pandemic such as Boise.
The current situation is also exacerbated by high mortgage rates given that the average one for a 30-year-fixed mortgage rose from 2.65% in 2021 to 5.34% in 2022 and 6.65% now. This sent the mortgage payment on a median-priced home up by $500 and pushed out another group of buyers.
While the current numbers reflect years of sky-high home price growth, the mortgage rates are more of a fluctuating factor and a response to inflation. Redfin's prediction that it will improve slightly even if more construction is needed to truly improve the current situation.
"The good news is that housing affordability should improve," Marr said. "Mortgage rates will eventually come down as the Fed makes progress fighting inflation, and home prices have already begun falling. Incomes are also growing faster than the historical norm."
fed pandemic mortgage rates real estate housing marketUncategorized
Stock indexes are breaking records and crossing milestones – making many investors feel wealthier
The S&P 500 topped 5,000 on Feb. 9, 2024, for the first time. The Dow Jones Industrial Average will probably hit a new big round number soon t…
Share this:


The S&P 500 stock index topped 5,000 for the first time on Feb. 9, 2024, exciting some investors and garnering a flurry of media coverage. The Conversation asked Alexander Kurov, a financial markets scholar, to explain what stock indexes are and to say whether this kind of milestone is a big deal or not.
What are stock indexes?
Stock indexes measure the performance of a group of stocks. When prices rise or fall overall for the shares of those companies, so do stock indexes. The number of stocks in those baskets varies, as does the system for how this mix of shares gets updated.
The Dow Jones Industrial Average, also known as the Dow, includes shares in the 30 U.S. companies with the largest market capitalization – meaning the total value of all the stock belonging to shareholders. That list currently spans companies from Apple to Walt Disney Co.
The S&P 500 tracks shares in 500 of the largest U.S. publicly traded companies.
The Nasdaq composite tracks performance of more than 2,500 stocks listed on the Nasdaq stock exchange.
The DJIA, launched on May 26, 1896, is the oldest of these three popular indexes, and it was one of the first established.
Two enterprising journalists, Charles H. Dow and Edward Jones, had created a different index tied to the railroad industry a dozen years earlier. Most of the 12 stocks the DJIA originally included wouldn’t ring many bells today, such as Chicago Gas and National Lead. But one company that only got booted in 2018 had stayed on the list for 120 years: General Electric.
The S&P 500 index was introduced in 1957 because many investors wanted an option that was more representative of the overall U.S. stock market. The Nasdaq composite was launched in 1971.
You can buy shares in an index fund that mirrors a particular index. This approach can diversify your investments and make them less prone to big losses.
Index funds, which have only existed since Vanguard Group founder John Bogle launched the first one in 1976, now hold trillions of dollars .
Why are there so many?
There are hundreds of stock indexes in the world, but only about 50 major ones.
Most of them, including the Nasdaq composite and the S&P 500, are value-weighted. That means stocks with larger market values account for a larger share of the index’s performance.
In addition to these broad-based indexes, there are many less prominent ones. Many of those emphasize a niche by tracking stocks of companies in specific industries like energy or finance.
Do these milestones matter?
Stock prices move constantly in response to corporate, economic and political news, as well as changes in investor psychology. Because company profits will typically grow gradually over time, the market usually fluctuates in the short term, while increasing in value over the long term.
The DJIA first reached 1,000 in November 1972, and it crossed the 10,000 mark on March 29, 1999. On Jan. 22, 2024, it surpassed 38,000 for the first time. Investors and the media will treat the new record set when it gets to another round number – 40,000 – as a milestone.
The S&P 500 index had never hit 5,000 before. But it had already been breaking records for several weeks.
Because there’s a lot of randomness in financial markets, the significance of round-number milestones is mostly psychological. There is no evidence they portend any further gains.
For example, the Nasdaq composite first hit 5,000 on March 10, 2000, at the end of the dot-com bubble.
The index then plunged by almost 80% by October 2002. It took 15 years – until March 3, 2015 – for it return to 5,000.
By mid-February 2024, the Nasdaq composite was nearing its prior record high of 16,057 set on Nov. 19, 2021.
Index milestones matter to the extent they pique investors’ attention and boost market sentiment.
Investors afflicted with a fear of missing out may then invest more in stocks, pushing stock prices to new highs. Chasing after stock trends may destabilize markets by moving prices away from their underlying values.
When a stock index passes a new milestone, investors become more aware of their growing portfolios. Feeling richer can lead them to spend more.
This is called the wealth effect. Many economists believe that the consumption boost that arises in response to a buoyant stock market can make the economy stronger.
Is there a best stock index to follow?
Not really. They all measure somewhat different things and have their own quirks.
For example, the S&P 500 tracks many different industries. However, because it is value-weighted, it’s heavily influenced by only seven stocks with very large market values.
Known as the “Magnificent Seven,” shares in Amazon, Apple, Alphabet, Meta, Microsoft, Nvidia and Tesla now account for over one-fourth of the S&P 500’s value. Nearly all are in the tech sector, and they played a big role in pushing the S&P across the 5,000 mark.
This makes the index more concentrated on a single sector than it appears.
But if you check out several stock indexes rather than just one, you’ll get a good sense of how the market is doing. If they’re all rising quickly or breaking records, that’s a clear sign that the market as a whole is gaining.
Sometimes the smartest thing is to not pay too much attention to any of them.
For example, after hitting record highs on Feb. 19, 2020, the S&P 500 plunged by 34% in just 23 trading days due to concerns about what COVID-19 would do to the economy. But the market rebounded, with stock indexes hitting new milestones and notching new highs by the end of that year.
Panicking in response to short-term market swings would have made investors more likely to sell off their investments in too big a hurry – a move they might have later regretted. This is why I believe advice from the immensely successful investor and fan of stock index funds Warren Buffett is worth heeding.
Buffett, whose stock-selecting prowess has made him one of the world’s 10 richest people, likes to say “Don’t watch the market closely.”
If you’re reading this because stock prices are falling and you’re wondering if you should be worried about that, consider something else Buffett has said: “The light can at any time go from green to red without pausing at yellow.”
And the opposite is true as well.
Alexander Kurov does not work for, consult, own shares in or receive funding from any company or organization that would benefit from this article, and has disclosed no relevant affiliations beyond their academic appointment.
dow jones sp 500 nasdaq stocks covid-19Uncategorized
Marriage is not as effective an anti-poverty strategy as you’ve been led to believe
Marriage on its own won’t do away with child poverty, and in fact it can create even more instability for low-income families.
Share this:


Brides.com predicts that 2024 will be the “year of the proposal” as engagements tick back up after a pandemic-driven slowdown.
Meanwhile, support for marriage has found new grist in recent books, including sociologist Brad Wilcox’s “Get Married: Why Americans Must Defy the Elites, Forge Strong Families and Save Civilization” and economist Melissa Kearney’s “The Two-Parent Privilege.”
Kearney’s book was hailed by economist Tyler Cowen as possibly “the most important economics and policy book of this year.” This is not because it treads new ground but because, as author Kay Hymowitz writes, it breaks the supposed “taboo about an honest accounting of family decline.”
These developments are good news for the marriage promotion movement, which for decades has claimed that marriage supports children’s well-being and combats poverty. The movement dates back at least to the U.S. Department of Labor’s Moynihan Report of 1965, which argued that family structure aggravated Black poverty.
Forty years after the Moynihan Report, George W. Bush-era programs such as the Healthy Marriage Initiative sought to enlist churches and other community groups in an effort to channel childbearing back into marriage. These initiatives continue today, with the federally subsidized Healthy Marriage and Responsible Fatherhood programs.
Still, nearly 30% of U.S. children live in single-parent homes today, compared with 10% in 1965.
We are law professors who have written extensively about family structure and poverty. We, and others, have found that there is almost no evidence that federal programs that promote marriage have made a difference in encouraging two-parent households. That’s in large part because they forgo effective solutions that directly address poverty for measures that embrace the culture wars.

Marriage and social class
Today’s marriage promoters claim that marriage should not be just for elites. The emergence of marriage as a marker of class, they believe, is a sign of societal dysfunction.
According to census data released in 2021, 9.5% of children living with two parents – and 7.5% with married parents – lived below the poverty level, compared with 31.7% of children living with a single parent.
Kearney’s argument comes down to: 1 + 1 = 2. Two parents have more resources, including money and time to spend with children, than one. She marshals extensive research designed to show that children from married couple families are more likely to graduate from high school, complete college and earn higher incomes as adults than the children of single parents.
It is undoubtedly true that two parents – that is, two nonviolent parents with reliable incomes and cooperative behavior – have more resources for their children than one parent who has to work two jobs to pay the rent. However, this equation does not address causation. In other words, parents who have stable incomes and behaviors are more likely to stay together than parents who don’t.
Ethnographic studies indicate, for example, that the most common reasons unmarried women are no longer with the fathers of their children are the men’s violent behavior, infidelity and substance abuse.
Moreover, income volatility disproportionately affects parents who don’t go to college. So while they may have more money to invest in children together than apart, when one of these parents experiences a substantial drop in income, the other parent may have to decide whether to support the partner or the children on what is often a meager income.
The impact of having single parents also plays out differently by race and class. As sociologist and researcher Christina Cross explains, “Living apart from a biological parent does not carry the same cost for Black youths as for their white peers, and being raised in a two-parent family is not equally beneficial.”
For example, Cross found that living in a single-mother family is less likely to affect high school completion rates for Black children than for white children. Also, Black families tend to be more embedded in extended family than white families, and this additional support system may help protect children from negative outcomes associated with single-parent households.
Making men more ‘marriageable’
Kearney, to her credit, does note that economic insecurity largely explains what is happening to working-class families, and that no parent should have to tolerate violence or substance abuse. But she doubles down on the need to restore a norm of two-parent families.
Many of her policy prescriptions are sensible. She advocates for better opportunities for low-income men – to make them, in the words of sociologist William Julius Wilson, “marriageable.” Such policies would include wage subsidies to improve their job opportunities, investment in community colleges that provide skills training, and the removal of questions about criminal histories from job applications, so that candidates who have previously been incarcerated are not immediately disqualified.
A new marriage model
What marriage promotion efforts overlook, however, are the underlying changes in what marriage has become – both legally and practically.
The new marriage model rests on three premises.
The first is a moral command: Have sex if you want to, but don’t have children until you are ready. While the shotgun marriage once served as the primary response to unplanned pregnancy, such marriages today often derail education and careers and are more likely to result in divorce than other marriages. Research shows that lower-income women’s pregnancies are much more likely to be unplanned.
The second is the ability to pick a partner who will support you and assume joint responsibility for parenting. As women have attained more economic independence, they are less in need of men to raise children, particularly if their partners are insensitive or abusive. With healthy relationships, couples pick partners based on trust, commitment and equal respect. This is more difficult to do in communities with high rates of incarceration and few opportunities for stable employment.
And the third is economic and behavioral stability. Instability undermines even committed unions. Parents who wait until they find the right partner and have stable lives bring a lot more to parenting, whether they marry or not.
We believe that creating opportunities for low-income parents to reach this middle-class model is likely to be the most effective marriage promotion policy.
Economic support is key
In relationships that fall outside of these premises, 1 + 1 often becomes 1 + -1, which equals 0.
Being committed to a partner who can’t pay speeding tickets, runs up credit card bills, comes home drunk or can’t be relied on to pick up the children after school is not a recipe for success.
Economic principles suggest that businesses with more volatile income streams need a stronger capital base to withstand the downturns. Working-class couples who face economic insecurity see commitment as similarly misguided; without a capital base, a downturn for one partner can wipe out the other.
The Biden administration’s child tax credit expansion included in the American Rescue Plan Act of 2021 helped cut the child poverty rate – after accounting for government assistance – to a record low that year. It did more to address child poverty than marriage promotion efforts have ever done.
Researchers have described such income-support policies as the “ultimate multipurpose policy instrument.” They improve the economic circumstances of single-parent families and, in doing so, may also provide greater support for two-parent relationships.
Policymakers know how to solve child poverty – and these measures are far more effective than efforts to put two married parents in every household.
The authors do not work for, consult, own shares in or receive funding from any company or organization that would benefit from this article, and have disclosed no relevant affiliations beyond their academic appointment.
subsidies pandemicUncategorized
Apples Magic- Are Buybacks Worth Paying Up For?
Apple’s valuations are near their most expensive levels of the last ten years. Now consider that today’s valuation premiums are amidst a much higher risk-free…
Share this:

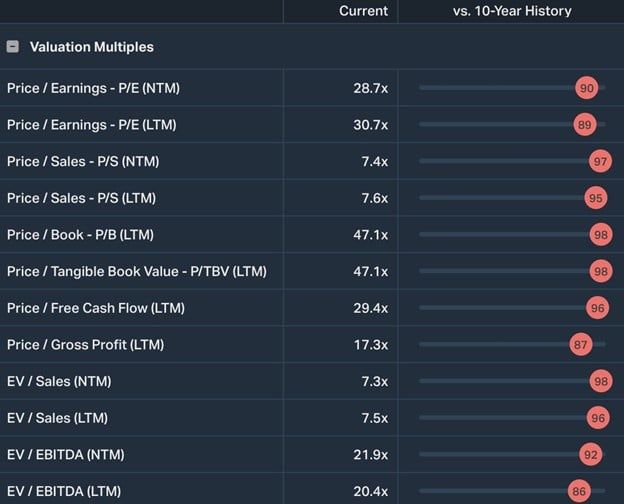
Apple’s valuations are near their most expensive levels of the last ten years. Now consider that today’s valuation premiums are amidst a much higher risk-free bond yield than during most of the previous ten years.

Apple has a market cap of $2.8 trillion. Assuming its price-to-earnings ratio and margins remain stable, Apple must sell nearly $400 billion of products and services each year to keep its share price stable. To fathom that, consider that every man, woman, and child on planet Earth must spend about $45 on Apple products yearly.
The point of sharing those statistics and the valuation premium is to contextualize whether Apple can grow at the growth rate implied by its investors. Further, if its earnings growth alone doesn’t support a valuation premium to the market’s valuation, can the continued use of stock buybacks support the premium?
Apple’s Track Record
The graph below shows Apple shares have provided its investors with a fantastic 20% annualized growth rate for the last 39 years. That is more than double the 8.7% growth rate for the S&P 500 over the same period.

Its exceptional outperformance versus the market is warranted. Since 1993, Apple’s earnings per share have grown at over 3x the rate of the S&P 500.
Apple’s Recent Trends
While Apple may have an incredible record of earnings growth and share price appreciation, current investors must avoid the temptation to rest on prior trends. Instead, their focus should be on what may lie ahead.
The following graph shows the running 3-year annualized growth rates for sales, net earnings, and earnings per share. Recent growth rates are much lower than they have been. We truncated the graph to the last ten years to better highlight the more recent trends.

Earnings and sales were boosted in 2021 and 2022 by the stimulus-related spending and inflation caused by the massive pandemic-related fiscal stimulus. Many companies, including Apple, saw demand increase and could expand profit margins, as inflation was easy to pass on to customers.
However, Apple’s earnings and sales growth are returning to pre-pandemic levels. To better appreciate what the future may hold, consider the five pre-pandemic years highlighted in blue. During that period, sales grew by 4.2% annually. Net earnings grew by 4.3% and EPS by 10.4%
The Magic of Stock Buybacks
The price of a stock is not meaningful. Apple stock trades for $182 a share. Its market cap is roughly $2.85 trillion. If the company repurchased all but one share, its market cap would be unchanged, but its share price would be $2.85 trillion.
That simple example highlights how valuable buying back shares can be for investors.
Back to Apple’s recent EPS, net earnings and sales trends. Its EPS grew roughly double that of sales or net earnings. The graph below helps explain how they pulled off such a feat. Once Apple started buying back shares in late 2013, its EPS grew 4-6% more than its actual earnings.

The following graph compares Apple’s annual EPS versus its EPS if it had not repurchased shares. The graph starts in 2013 when Apple began to aggressively buy back shares.

Why The Premium Versus The Market?
Apple has recently grown its earnings and sales at an approximate 5% growth rate. This is only about 1% higher than the approximate 4% nominal GDP growth from 2017 to 2019. But less than the approximate 9% EPS and sales per share growth of the S&P 500.
So why are Apple investors willing to pay a premium for subpar growth?
Apple is an incredibly successful and innovative company with a long history of rewarding investors. Investors are willing to pay for the future potential of new products and services with enormous income potential. Such investor goodwill is hard to put a price on.
Passive investment strategies are a second reason. Apple and Microsoft are the two largest stocks by market cap. The increased popularity of passive investment strategies feeds the most extensive market cap stocks disproportionately to smaller companies.
Consider the holdings of XLK, the $52 billion tech sector ETF. Apple and Microsoft make up almost 50% of the ETF. If an investor buys $1,000 of XLK, approximately $500 will go to Apple and Microsoft, and the remaining 62 companies will get the rest.

Finally, and most importantly, are share buybacks. While we can’t quantify what future innovation, goodwill, and passive investment strategies are worth, we can grasp Apple’s ability to continue forward with buybacks.
Future Buyback Funding
The chart below shows Apple has been spending between $60 and $80 billion per year on stock buybacks. Keep that figure in mind as we walk through its sources of cash to continue buying back shares.

Debt, cash, and earnings are their predominant sources to fund buybacks.
Debt Funded Buybacks
Apple came to market with its first long-term debt offering in 2013, commensurate with its initiation of share buybacks. Apple’s debt peaked eight years later at $109 billion. Using debt to fund share buybacks made sense, with borrowing rates in the very low single digits. However, the calculus has changed, with rates now at 4% and higher.
Cash and Marketable Securities on Apple’s balance sheet are at $61.5 billion, about a year’s worth of buyback potential. While a massive amount of money, it is off its peak of $107 billion.

Lastly are earnings. Apple has been earning about $100 billion a year since 2021. Even if they regress to pre-pandemic levels ($50-$60 billion), earnings are enough to continue supporting its buyback program. However, if earnings are employed to buy back shares, it comes at the expense of investments toward innovations and product upgrades. Furthermore, Apple pays about $15 billion yearly in dividends, which also requires funding.
The graph below shows that from 2018 to 2020, Apple spent more on buybacks than it made. It was relying on debt and cash to make up the difference.

Over the last two years, buybacks only account for 60% of earnings, allowing cash to grow for future buybacks and investments. Hence, if $100 billion a year in earnings is sustainable, even without growth, $60 to $80 billion a year in buybacks is entirely possible. If earnings retreat to their pre-pandemic level, debt and cash will be required. If interest rates stay at their current levels, debt may not be financially sensible.
Summary
Unlike most “growth” companies, a bet on Apple is a bet on their ability to buy back shares. It appears that Apple can continue to buy back its shares with earnings and cash. Such would maintain their higher-than-market EPS growth with or without above-market earnings growth.
Other than negative earnings growth and high-interest rates, a buyback tax on corporations, as is being proposed, could also reduce or eliminate their buyback program. If such a bill were to pass or Apple cuts back on buybacks for another reason, its premium valuation may wither away.
The post Apples Magic- Are Buybacks Worth Paying Up For? appeared first on RIA.
stimulus pandemic sp 500 stocks etf gdp interest rates

Watch Live: President Biden Reminds Americans Just How Good They’ve Got It Thanks To Him


Liquidity Problems Are Closer Than You Think


Watch: President Biden Delivers The “Darkest, Most Un-American Speech Given By A President”


Interest rates, the best it gets. It’s time to deploy cash


Is the biotech market rally real? Data suggest comeback in private, public markets


Normalise the underlying conditions when “rating” a company’s share price


COVID-19 Lockdowns Had High Health, Economic Costs: Swedish Study


People Who Received Ivermectin Were Better Off, Study Finds


Stock Market’s Top Will Outlast Your Disbelief
Democrats “Nervous” Ahead Of Biden’s State Of The Union Address
-

 Uncategorized2 weeks ago
All Of The Elements Are In Place For An Economic Crisis Of Staggering Proportions
-

 Uncategorized1 month ago
Cathie Wood sells a major tech stock (again)
-

 Uncategorized3 weeks ago
California Counties Could Be Forced To Pay $300 Million To Cover COVID-Era Program
-

 Uncategorized2 weeks ago
Apparel Retailer Express Moving Toward Bankruptcy
-

 Uncategorized3 weeks ago
Industrial Production Decreased 0.1% in January
-

 Government1 month ago
War Delirium
-

 Uncategorized3 weeks ago
RFK Jr: The Wuhan Cover-Up & The Rise Of The Biowarfare-Industrial Complex
-

 Uncategorized3 weeks ago
GOP Efforts To Shore Up Election Security In Swing States Face Challenges