Savage: Even with sales down, home prices up 10.8% 
Even with the significant decline in sales since January of 2022, the median sales price is up 10.8% year over year.
The post Savage: Even with sales down,…
Share this:

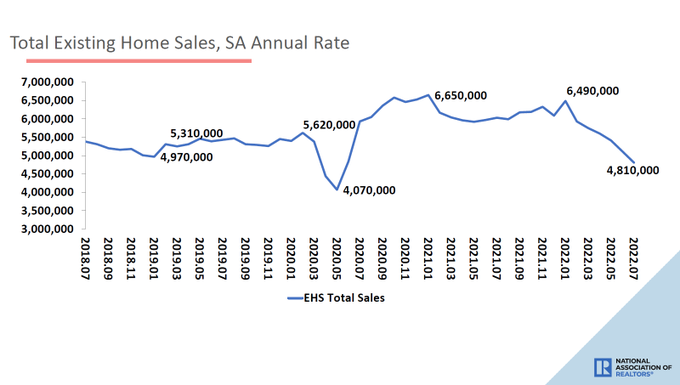
Today the National Association of Realtors reported that the trend of declining existing home sales, which we have seen since mortgage rates rose, is getting worse. But that isn’t the worst part of the data line! The shocking stat (for some, not for me) is that even with the significant decline in sales since January of 2022, the median sales price is up 10.8% year over year. The savagely unhealthy housing market continues — a function of starting the year at all-time lows in inventory.
From NAR: Total existing-home sales slipped 5.9% from June to a seasonally adjusted annual rate of 4.81 million in July.
I was concerned about 2022 home-price growth because by October of 2021, I knew we would start 2022 at all-time lows in inventory, which can create forced bidding action. I am not a fan of forced bidding action under any circumstances, but when it’s due to a raw shortage of homes and not a credit boom, as we saw from 2002-2005, it’s even worse.
NAR: The median existing-home price for all housing types in June was $403,800, up 10.8% from July 2021 ($364,600), as prices increased in all regions. This marks 125 consecutive months of year-over-year increases, the longest-running streak on record.

On the good news, inventory is rising, which is a positive. The parts of the country where inventory levels are at peak-2019 levels or higher are officially off the savagely unhealthy market list because they have plenty of inventory to have a more functional housing market. However, as a nation, we aren’t there yet.
NAR: The inventory of unsold existing homes rose to 1.31 million by the end of July, or the equivalent of 3.3 months at the current monthly sales pace.
My rule of thumb is that I will take the savagely unhealthy housing market theme off once we can touch 2019 peak levels of 1.93 million homes for sale and have at least four months of supply, which would mean a balanced housing market in my book. I am looking for a range of 1.52-1.93 million, something I have talked about for some time post-COVID-19. Because inventory is very seasonal — it falls in the fall and winter and then rises in the spring and summer — it’s not going to happen in 2022, but hopefully, we can get there next year.
NAR lists total current inventory at 1.31 million. Historically we are between 2-2.5 million. The peak in 2007 was roughly 4 million.
One of the most painful data lines to watch over the last two months has been the median days on the market, which have now broken to all-time lows. In a regular housing market, we are over 30 days, which is why I want the total inventory to get back to 2019 levels to have more balance nationally.
NAR: First-time buyers were responsible for 29% of sales in June; Individual investors purchased 14% of homes; All-cash sales accounted for 24% of transactions; Distressed sales represented approximately 1% of sales; Properties typically remained on the market for 14 days.

To give you some historical perspective here, you can see why I am using the term savagely unhealthy, as the median days on the market have never been lower in history.
Higher days on market mean choices for buyers and sellers. We never focus on the seller aspect because it’s easy to forget that a traditional primary recent home seller is also a buyer. Now that rates are up a lot, some sellers can’t afford to move or have delayed moving.
However, this is a good thing for others that need to move, as it means more inventory and more choices. This is one of the reasons I haven’t been the biggest fan of the housing market in recent years: we lacked options and time for people to have a more traditional home-buying and selling process. Over 30 days is preferable; anything that is a teenager isn’t a good thing at all.
This year, we saw that housing acted poorly when mortgage rates exceeded 6%. Of course, we have seen a 1% move lower and a lot of back-and-forth action on rates daily. If mortgage rates can head toward 4% again, the market should act better. However, until then, the market is still dealing with the affordability shock to demand as rates jumped massively this year. This, on top of the 44% + home-price growth since 2020, is a meaningful hit on affordability.
Purchase application data was down 1% weekly and down 18% year over year. The four-week moving average is down 17.75%. I had anticipated four-week moving average declines of 18%-22% once mortgage rates got above 4%. That didn’t happen, but rates above 5% did the trick.
We will soon enter a time where the year-over-year comps will be more challenging because we will have a higher bar to work from. Last year starting in October, mortgage demand started to pick up noticeably and pushed the existing home sales data toward 6.49 million at the start of this year. Some of the year-over-year data can look weaker than the 18% decline trend we have recently just due to higher comps.
Today’s existing home sales report isn’t the best due to home-price growth still being in the double digits. We should see less price growth in the upcoming months. However, this year, even with the big hit on demand and the housing market recession, we are still seeing unhealthy home price growth. I talked about this recently on CNBC.
We still have home prices growing faster this year than what we saw in the previous decade, and this has to do with the fact that we started the year at all-time lows in inventory, and we are working our way back to normal. Remember, normal inventory levels is a good thing, not a bad thing, because we all want a B&B housing market — boring and balanced — not savagely unhealthy.
We’re covering this important topic at our HousingWire Annual event Oct. 3-5 where Logan is a featured speaker. Register here to join us in Scottsdale, Arizona.
The post Savage: Even with sales down, home prices up 10.8%  appeared first on HousingWire.
recession covid-19 home sales mortgage rates housing marketGovernment
Low Iron Levels In Blood Could Trigger Long COVID: Study
Low Iron Levels In Blood Could Trigger Long COVID: Study
Authored by Amie Dahnke via The Epoch Times (emphasis ours),
People with inadequate…
Share this:


Authored by Amie Dahnke via The Epoch Times (emphasis ours),
People with inadequate iron levels in their blood due to a COVID-19 infection could be at greater risk of long COVID.
A new study indicates that problems with iron levels in the bloodstream likely trigger chronic inflammation and other conditions associated with the post-COVID phenomenon. The findings, published on March 1 in Nature Immunology, could offer new ways to treat or prevent the condition.
Long COVID Patients Have Low Iron Levels
Researchers at the University of Cambridge pinpointed low iron as a potential link to long-COVID symptoms thanks to a study they initiated shortly after the start of the pandemic. They recruited people who tested positive for the virus to provide blood samples for analysis over a year, which allowed the researchers to look for post-infection changes in the blood. The researchers looked at 214 samples and found that 45 percent of patients reported symptoms of long COVID that lasted between three and 10 months.
In analyzing the blood samples, the research team noticed that people experiencing long COVID had low iron levels, contributing to anemia and low red blood cell production, just two weeks after they were diagnosed with COVID-19. This was true for patients regardless of age, sex, or the initial severity of their infection.
According to one of the study co-authors, the removal of iron from the bloodstream is a natural process and defense mechanism of the body.
But it can jeopardize a person’s recovery.
“When the body has an infection, it responds by removing iron from the bloodstream. This protects us from potentially lethal bacteria that capture the iron in the bloodstream and grow rapidly. It’s an evolutionary response that redistributes iron in the body, and the blood plasma becomes an iron desert,” University of Oxford professor Hal Drakesmith said in a press release. “However, if this goes on for a long time, there is less iron for red blood cells, so oxygen is transported less efficiently affecting metabolism and energy production, and for white blood cells, which need iron to work properly. The protective mechanism ends up becoming a problem.”
The research team believes that consistently low iron levels could explain why individuals with long COVID continue to experience fatigue and difficulty exercising. As such, the researchers suggested iron supplementation to help regulate and prevent the often debilitating symptoms associated with long COVID.
“It isn’t necessarily the case that individuals don’t have enough iron in their body, it’s just that it’s trapped in the wrong place,” Aimee Hanson, a postdoctoral researcher at the University of Cambridge who worked on the study, said in the press release. “What we need is a way to remobilize the iron and pull it back into the bloodstream, where it becomes more useful to the red blood cells.”
The research team pointed out that iron supplementation isn’t always straightforward. Achieving the right level of iron varies from person to person. Too much iron can cause stomach issues, ranging from constipation, nausea, and abdominal pain to gastritis and gastric lesions.
1 in 5 Still Affected by Long COVID
COVID-19 has affected nearly 40 percent of Americans, with one in five of those still suffering from symptoms of long COVID, according to the U.S. Centers for Disease Control and Prevention (CDC). Long COVID is marked by health issues that continue at least four weeks after an individual was initially diagnosed with COVID-19. Symptoms can last for days, weeks, months, or years and may include fatigue, cough or chest pain, headache, brain fog, depression or anxiety, digestive issues, and joint or muscle pain.
Uncategorized
February Employment Situation
By Paul Gomme and Peter Rupert The establishment data from the BLS showed a 275,000 increase in payroll employment for February, outpacing the 230,000…
Share this:


By Paul Gomme and Peter Rupert
The establishment data from the BLS showed a 275,000 increase in payroll employment for February, outpacing the 230,000 average over the previous 12 months. The payroll data for January and December were revised down by a total of 167,000. The private sector added 223,000 new jobs, the largest gain since May of last year.

Temporary help services employment continues a steep decline after a sharp post-pandemic rise.


Average hours of work increased from 34.2 to 34.3. The increase, along with the 223,000 private employment increase led to a hefty increase in total hours of 5.6% at an annualized rate, also the largest increase since May of last year.

The establishment report, once again, beat “expectations;” the WSJ survey of economists was 198,000. Other than the downward revisions, mentioned above, another bit of negative news was a smallish increase in wage growth, from $34.52 to $34.57.

The household survey shows that the labor force increased 150,000, a drop in employment of 184,000 and an increase in the number of unemployed persons of 334,000. The labor force participation rate held steady at 62.5, the employment to population ratio decreased from 60.2 to 60.1 and the unemployment rate increased from 3.66 to 3.86. Remember that the unemployment rate is the number of unemployed relative to the labor force (the number employed plus the number unemployed). Consequently, the unemployment rate can go up if the number of unemployed rises holding fixed the labor force, or if the labor force shrinks holding the number unemployed unchanged. An increase in the unemployment rate is not necessarily a bad thing: it may reflect a strong labor market drawing “marginally attached” individuals from outside the labor force. Indeed, there was a 96,000 decline in those workers.


Earlier in the week, the BLS announced JOLTS (Job Openings and Labor Turnover Survey) data for January. There isn’t much to report here as the job openings changed little at 8.9 million, the number of hires and total separations were little changed at 5.7 million and 5.3 million, respectively.

As has been the case for the last couple of years, the number of job openings remains higher than the number of unemployed persons.

Also earlier in the week the BLS announced that productivity increased 3.2% in the 4th quarter with output rising 3.5% and hours of work rising 0.3%.

The bottom line is that the labor market continues its surprisingly (to some) strong performance, once again proving stronger than many had expected. This strength makes it difficult to justify any interest rate cuts soon, particularly given the recent inflation spike.
unemployment pandemic unemploymentSpread & Containment
Another beloved brewery files Chapter 11 bankruptcy
The beer industry has been devastated by covid, changing tastes, and maybe fallout from the Bud Light scandal.
Share this:


Before the covid pandemic, craft beer was having a moment. Most cities had multiple breweries and taprooms with some having so many that people put together the brewery version of a pub crawl.
It was a period where beer snobbery ruled the day and it was not uncommon to hear bar patrons discuss the makeup of the beer the beer they were drinking. This boom period always seemed destined for failure, or at least a retraction as many markets seemed to have more craft breweries than they could support.
Related: Fast-food chain closes more stores after Chapter 11 bankruptcy
The pandemic, however, hastened that downfall. Many of these local and regional craft breweries counted on in-person sales to drive their business.
And while many had local and regional distribution, selling through a third party comes with much lower margins. Direct sales drove their business and the pandemic forced many breweries to shut down their taprooms during the period where social distancing rules were in effect.
During those months the breweries still had rent and employees to pay while little money was coming in. That led to a number of popular beermakers including San Francisco's nationally-known Anchor Brewing as well as many regional favorites including Chicago’s Metropolitan Brewing, New Jersey’s Flying Fish, Denver’s Joyride Brewing, Tampa’s Zydeco Brew Werks, and Cleveland’s Terrestrial Brewing filing bankruptcy.
Some of these brands hope to survive, but others, including Anchor Brewing, fell into Chapter 7 liquidation. Now, another domino has fallen as a popular regional brewery has filed for Chapter 11 bankruptcy protection.
Image source: Shutterstock
Covid is not the only reason for brewery bankruptcies
While covid deserves some of the blame for brewery failures, it's not the only reason why so many have filed for bankruptcy protection. Overall beer sales have fallen driven by younger people embracing non-alcoholic cocktails, and the rise in popularity of non-beer alcoholic offerings,
Beer sales have fallen to their lowest levels since 1999 and some industry analysts
"Sales declined by more than 5% in the first nine months of the year, dragged down not only by the backlash and boycotts against Anheuser-Busch-owned Bud Light but the changing habits of younger drinkers," according to data from Beer Marketer’s Insights published by the New York Post.
Bud Light parent Anheuser Busch InBev (BUD) faced massive boycotts after it partnered with transgender social media influencer Dylan Mulvaney. It was a very small partnership but it led to a right-wing backlash spurred on by Kid Rock, who posted a video on social media where he chastised the company before shooting up cases of Bud Light with an automatic weapon.
Another brewery files Chapter 11 bankruptcy
Gizmo Brew Works, which does business under the name Roth Brewing Company LLC, filed for Chapter 11 bankruptcy protection on March 8. In its filing, the company checked the box that indicates that its debts are less than $7.5 million and it chooses to proceed under Subchapter V of Chapter 11.
"Both small business and subchapter V cases are treated differently than a traditional chapter 11 case primarily due to accelerated deadlines and the speed with which the plan is confirmed," USCourts.gov explained.
Roth Brewing/Gizmo Brew Works shared that it has 50-99 creditors and assets $100,000 and $500,000. The filing noted that the company does expect to have funds available for unsecured creditors.
The popular brewery operates three taprooms and sells its beer to go at those locations.
"Join us at Gizmo Brew Works Craft Brewery and Taprooms located in Raleigh, Durham, and Chapel Hill, North Carolina. Find us for entertainment, live music, food trucks, beer specials, and most importantly, great-tasting craft beer by Gizmo Brew Works," the company shared on its website.
The company estimates that it has between $1 and $10 million in liabilities (a broad range as the bankruptcy form does not provide a space to be more specific).
Gizmo Brew Works/Roth Brewing did not share a reorganization or funding plan in its bankruptcy filing. An email request for comment sent through the company's contact page was not immediately returned.
bankruptcy pandemic social distancing


Walmart launches clever answer to Target’s new membership program


EyePoint poaches medical chief from Apellis; Sandoz CFO, longtime BioNTech exec to retire


Wendy’s has a new deal for daylight savings time haters


Watch Live: President Biden Reminds Americans Just How Good They’ve Got It Thanks To Him


Catastrophic Risk: Investing and Business Implications


When Military Rule Supplants Democracy


Racial and Ethnic Wealth Inequality in the Post‑Pandemic Era


Redefining Poverty: Towards a Transpartisan Approach


The Digest #187


Dropping Like a Stone: ON RRP Take‑up in the Second Half of 2023
-

 Uncategorized2 weeks ago
All Of The Elements Are In Place For An Economic Crisis Of Staggering Proportions
-

 Uncategorized1 month ago
Cathie Wood sells a major tech stock (again)
-

 Uncategorized3 weeks ago
California Counties Could Be Forced To Pay $300 Million To Cover COVID-Era Program
-

 Uncategorized2 weeks ago
Apparel Retailer Express Moving Toward Bankruptcy
-

 Uncategorized3 weeks ago
Industrial Production Decreased 0.1% in January
-
International1 day ago
Walmart launches clever answer to Target’s new membership program
-

 Uncategorized3 weeks ago
RFK Jr: The Wuhan Cover-Up & The Rise Of The Biowarfare-Industrial Complex
-

 Uncategorized3 weeks ago
GOP Efforts To Shore Up Election Security In Swing States Face Challenges