Government
Low Interest Rates and Government Debt
This is a talk I gave for IGIER at Bocconi (zoom, sadly) Jan 11 2021. Olivier Blanchard also gave a talk and a good discussion followed. Yes, some content is recycled, but on an important topic one must go back to refine and rethink ideas. This post has..
Share this:

This is a talk I gave for IGIER at Bocconi (zoom, sadly) Jan 11 2021. Olivier Blanchard also gave a talk and a good discussion followed. Yes, some content is recycled, but on an important topic one must go back to refine and rethink ideas. This post has mathjax equations and graphs. If you don't see them, come back to the blog or read the pdf version
Low Interest Rates and Government Debt
John H. Cochrane
Hoover Institution
Prepared for the IGIER policy seminar, January 11 2021
1. Why are real interest rates so low? (And thus, when and how will that change?)
 |
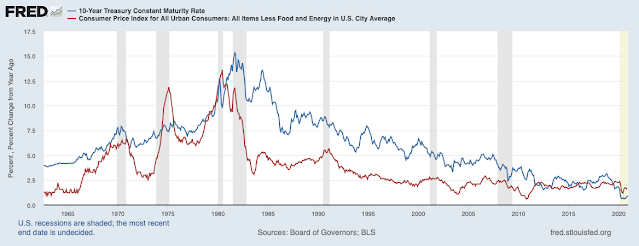
| Figure 1. 10 year US treasury rate and core CPI. |
As Figure 1 shows, real and nominal interest rates have been on a steady downward trend since 1980. The size, steadiness and durability of that trend mean that we must look for large basic economic forces. “Savings gluts,” foreign exchange reserves, quantitative easing, lower bounds, forward guidance bond market frictions and so forth may be important icing on the cake, but they are not the cake. They cannot account for such a long-lasting steady trend.
The most basic economics states that the real interest rate equals people’s rate of impatience, plus growth times a coefficient usually thought to be between one and two. The interest rate is also equal to the marginal product of capital. In equations*, [r = delta + gamma g ].
 |
| Figure 2. Real potential GDP growth. |
Figure 2 presents the growth of potential GDP, as one easy way to look at long run growth trends. Potential GDP grew 4.5% in the 1960s, 3% in the 1970s, had a spurt in the late 1990s, and then settled down to less than 2% now. This slowdown in long-term growth is the great and unheralded economic disaster of our time. But that’s for another day.
The most natural explanation for the decline in real interest rates, then, is that growth has declined. A coefficient greater than one brings interest rates down faster than growth rates, opening the question that the interest rate r might even be below the growth rate g.
Basic supply and demand suggests that lower growth, driven by a lower marginal product of capital, or “supply” is the cause. People often allude to extra savings, or demographics, changing “demand.” That force would be captured by a decline in (delta), an increase in patience. That would lower interest rates without changing growth, or would raise growth without changing interest rates. Changing growth g and constant (delta) produces what we see.
Why did the marginal product of capital decline, and what would change this event? There are three common stories: First, as we move to services and away from capital-intensive goods, we just need less capital. I’m not persuaded. We need different capital, and a lot of the world looks like it could use capital. Second, we are simply running out of ideas, growth is over, is lower. I’m still a techno-optimist. Third, ever-growing marginal tax rates, protections, and regulations are hamstringing the innovation and ruthless competition that it takes to get new ideas into practice. That’s my favorite explanation.
But this is beside the point today. The point: declining growth is a plausible cake, a usually overlooked basic economic force that accounts for the four-decade steady decline in interest rates. More generally, to describe a steady 40 year trend, we should start with basics, the neoclassical growth model.
Looking again at Figure 1, we cannot have a successful understanding of lower interest rates without saying something about what changed in 1980. Well, obviously, inflation changed. Here is a second basic economic force: average return is proportional to risk, measured by beta, [ E(R_i) = R^f + beta_i lambda.] In the recessions of the 1970s, inflation went up (stagflation) and bond prices went down (yields went up). Government bonds lost real and nominal value. Government bonds were a risky, positive-beta security. In the recessions since 1980, and especially recently, inflation went down, bond prices went up, and the dollar went up, while private securities collapsed in value. There was a “flight to quality,” and government bonds were quality. Government bonds became a negative beta security, a hedge against recessions and financial crises. That insurance value drives average bond returns even below the “risk free rate.” With an equity premium of 5% or more, it doesn’t take much negative beta to seriously drive down a return.
Underlying this transformation, inflation expectations have become “anchored.” But by what? Better speeches by central bankers promising what they might do in the future? Everyone admits this “anchoring” is poorly understood. We must then admit it is tenuous, and the pattern of the 1970s could return. (One story with some ring to it is that it is the high ex-post real rates of the 1980s that are unusual and we are only going back to normal, like the late 19th century. It is still puzzling that one year rates were higher than inflation for so long -- markets were apparently betting on inflation and wrong for 20 years in a row.)
Most discussions are much more fun, involving more interesting economics and lots of frictions. I think these are at best icing on the cake.
 |
| Figure 3. 30 year treasury (black), Moody’s AAA (blue), and 30 year mortgage rates (red). |
Perhaps US Treasury debt is special, due to its liquidity and use in financial transactions. Figure 3 presents the 30-year Treasury against the Moody’s AAA and 30-year mortgage rates, which are quite illiquid. There might be a percent of spread here, some of which is credit spread. It isn’t obviously getting bigger over time. Spreads in shorter-term maturities are similar. Widening liquidity spreads do not account for the huge trend seen in Figure 1.
 |
| Figure 4. US and Euro 10 year government bonds. |
Perhaps the dollar is special, the “reserve currency” that gets “exorbitant privilege.” That may be true in quantities but it does not show up in prices. As shown in Figure 4, Euro bond yields are now 1% lower than US Treasury yields, and have drifted down more. Inflation is a bit lower but not that much lower, so European real rates are lower. Japanese rates show the same patter. Sadly, but consistent with my story, European and Japanese growth rates are even lower than the US. This also suggests that government debt, not the dollar per se, is the negative-beta security.
I don't want to pretend this is a solved question. If you want an indication of just how right Haeyek was, the fact that economists don't have a solid answer to why this most important of all prices has moved slowly down for 40 years it is. On the other hand, solid quantitative exploration of the options still has plenty of room to go, if you're writing a PhD thesis.
2. Low rates, r<g, and government finances
What do these low rates mean for government finances? The debt/GDP ratio B/Y grows at the difference between interest rate and growth rate, less any real primary surpluses.[ frac{d}{dt} left(frac{B}{Y} right) = (r-g) left(frac{B}{Y} right) - frac{s}{Y}.]
This equation, and the possibility that r<g, leads to some tantalizing possibilities.
First, if r<g, then the government can run a steady primary deficit, s less than zero, forever, and the debt/GDP ratio will not change.
Second, if r<g, the government can run a big one-time fiscal expansion, borrowing a lot of money, and then simply grow out of it without running any surpluses. With s=0, the debt/GDP ratio will revert all on its own at rate r-g. In that sense the fiscal expansion does not have to be repaid with later surpluses!
The latter is not a money machine, meaning nobody ever has to work or pay taxes again. It only works as far as the opportunity scales, if borrowing a ton of money and spending it does not drive up r or drive down g. The marginal r is higher than the average r. At some point we all recognize that more borrowing must drive up r, by a variety of mechanisms. But that point may be far above today’s debt.
And we still have to pay taxes! Zero surplus means zero surplus, not deficits forever. After the one-time expansion, future spending is fully paid with future taxes.
These are tantalizing possibilities and technically very interesting. If you have not done so, you should immediately read Olivier Blanchard’s brilliant AEA presidential address which analyzes these issues. Written just before the US embarked on a $5 Trillion borrowing binge, with larger fiscal plans on the table, I believe Blanchard’s fiscal policy address will be as influential in our age as Milton Friedman’s 1968 monetary policy address was in his. Almost all our current and projected borrowing is going to transfers -- writing checks to people and businesses -- and I am curious to hear is view of that fact. And if you read his last section, you will see a suggestion of how it could all go wrong, which I repeat much more loudly later today.
We do not diagree on analysis. However, I put different weight on different possibilities. My bottom line: though the r<g possibility is tantalizing and technically fun, I argue that it is quantitatively irrelevant to the fiscal issues facing the US and the eurozone today.
 |
| Figure 5. Deficits. Source: CBO 2020 Long-Run Budget Outlook |
Figure 5 presents projected deficits from the latest CBO long-term budget outlook.
An r-g equal to 1% means that, at 100% debt/GDP, the US can run 1% deficit to GDP forever. That’s nice. But the US has been running 5% deficit to GDP in good times, 10% in bad times, and 20% in this crisis. (Figure 6 is clearer about the total increase in debt to the 2008 and 2020 recessions.) The CBO forecast starts close to 5% after recovery, but then grows unboundedly as unfunded entitlements kick in. And this forecast is before one adds big new spending programs — green energy subsidies, medicare for all, universal basic income, infrastructure, and so on. And this forecast does not count the 20% that each decades’ once-in-a-century crisis seems to engender. And this forecast presumes GDP continues to grow at an anemic but positive pace of 1.6% per year. Lower makes it all worse.
The chance to have 1% debt to GDP deficit forever is simply couch change compared to these numbers. R greater or less than g by one percentage point is truly irrelevant to the fiscal challenge at hand.
 |
| Figure 6. Debt to GDP ratio |
Figure 6 presents the CBO debt forecast. Again, this forecast is before the contemplated “one time” expansion to spend on worthy causes (mostly transfers), and does not include 25% in the next crises. There will be more crises, you know. I indicated a line that suggests a path extrapolating from the last two crises.
This is not the backdrop — steady debt/GDP, zero primary surplus or deficit — on which one contemplates a one-time expansion which we grow out of with continued zero primary surpluses.
r<g of 1% or so does not justify exponentially growing debt/GDP! That is the fiscal challenge today.

Growing out of debt also takes an awfully long time. Table 1 calculates the path of debt if the US borrows up to 150% debt/GDP and 200% debt/GDP, and then “grows out” of the debt with zero surpluses. As you can see it takes over 100 years to get back to normal values, 50% debt/GDP ratio.
If you want to bring debt down faster, what do you do? Run surpluses! In that sense, though the technical issues right around r just above and r just below g — transversality conditions, limits, and so forth — are fascinating, that question does not make any difference to our fiscal issues. At r-g of negative one basis point the opportunity to grow out of debt in 1000 years is simply of no practical importance.
And r-g of negative one percent is of almost no practical importance to current fiscal questions. Deficits of 5, 10 and occasionally 20% of GDP will have to be repaid by subsequent surpluses, sooner or later, more or less painfully. An extra 1% of fiscal space is nice, but does not fundamentally change our fiscal challenges.
3. The iceberg ahead.
So how will r rise, and what does that mean for government finances?
My first mechanism, that interest rates are low because growth is low, turns around if we return to robust, innovation-driven supply side growth. That’s the only kind that lasts 20 or 50 years. Forget stimulus. That growth needs the techno-optimists to be right, and the growth-is-over crows to be wrong. That growth needs the regulation-and-protection-is-strangling-growth crowd to be right, and our governments to finally get around to structural reform. If as g grows r grows more, reversing the path we came down, that fact will put some strain on government finances. But that strain will be easy to accommodate in an economy growing 4% or more. We should have such problems. And higher growth need not mean higher government bond returns, through a variety of mechanisms.
My second mechanism, negative beta, disappears when inflation expectations become a bit unglued, or nominal bonds to stop being safe havens in recessions. That is a more tenuous phenomenon. It could change quickly, as it did in 1972 an again in 1980. I think of this possibility as an element of the larger danger.
The larger danger is a doom loop, or sovereign debt crisis, a lot more r with a lot less g, all of a sudden.
Suppose we have run our “one time” final expansion and are at 200% debt to GDP ratio. The next big crisis hits — a war, pandemic, financial mess, or all three. The US wants to borrow another 20% of GDP, and roll over the outstanding debt. Markets get worried and demand, say, 5% rates. That means 10% of GDP more primary deficit, or 10% of GDP more borrowing, 30% of GDP, plus the roll-over. Moreover, the consequent write-down of asset values leads inevitably to another big Wall Street bailout and asset purchases, all with more borrowed money. Markets get more worried, and demand 10% rates. And so on. When this spirals out of control, you have a debt crisis. It must lead to sharp inflation, or default. And there is no Germany to bail us out, no Mario Draghi to “do what it takes.”
Default is not impossible, just because the US and eurozone print our own currencies. Imagine my scenario and add policy chaos. The US is just getting going on political chaos. Bond markets are demanding 5% or 10%. Are the US Congress and Administration, really going to put interest payments to the Chinese central bank, “the rich,” and “Wall Street” ahead of writing checks to needy Americans? Don’t bet on it. It won’t be a simple default. It will be a complex restructuring, as it always is. T bills may get forcibly rolled over to low-coupon long term debt for example.
But this would be a financial and economic catastrophe. “Riskless” US debt and the US ability to bail out any financial institution in trouble are at the heart of our current financial system. And discussions of such a haircut would lead to an immense run and inflation, provoking the event.
(This is not a novel, or crazy scenario. Read "Greater risk of a financial crisis" in the CBO long-term budget outlook.)
No, financial markets do not see this coming. But financial markets never see it coming. Look at Figure 1 again. Interest rates did not force the swings in 1970s inflation, nor the end of inflation in the 1980s.
As Olivier pointed out, there is no magic debt/GDP ratio dividing safe from dangerous. Debt crises have happened with 50% debt/GDP. Japan is trundling along at 250% of GDP. A crisis blends current debt with a look at the future. At the end of WWII, the US had more than 100% debt/GDP ratio. But the war was over, we headed into an era of unparalleled supply-side growth, fiscal policy ran steady primary surpluses, politics was much more united, there was considerable financial repression, much of the debt was long-term, and we still had two bouts of inflation. None of that applies now. Markets now must look not just at today's debt/GDP ratio but the looming entitlements crisis, out of control spending, sclerotic growth at best and political chaos.
How should we avoid this? Well, again, there is nothing like unleashing faster productivity-led growth to solve all wounds. But growth is blocked as it has always been by politically important constituencies who make money from the old way of doing things. And no political movement in the US or Europe has any interest in growth-oriented structural reform at the moment.
At a minimum, our politicians should could again start spending as if they have to pay back borrowed money. They do. We do.
It would help enormously if our Treasuries funded their governments with long-term debt, ideally perpetuities. Long-term financing makes my doom loop debt crisis much less likely, and will give our political systems some space for well-structured fiscal reforms when the end comes. (The long-term debt should not be held, leveraged, by too big to fail banks however!)
And finally, don’t count on r one percent less than g to bail us out. It needs zero surpluses, which represent an immense fiscal contraction already, and it needs markets to be patient for centuries, through all the upheavals to come.
4. Last words
Why are long term rates low? It’s a good question. My simple graphs and equations are just a suggestion, not an answer by themselves. Real understanding needs real models and quantitative evaluation. There is a lot of work on this topic, which I do not survey here. But too much of this pursuit, in my opinion, searches for novel models with sexy frictions, ignoring the sort of basic neoclassical growth theory and simple finance that should be the starting point for understanding a 40 year trend.
We need a real, solid, simple, and communicable understanding. Only real understanding will let us know how long it will last.
The low interest rate trend has been going on for a long time. But we should not count on trends without solid economic foundations. Remember Irving Fisher, who said in 1929, “Stocks are at a permanently higher plateau.” Unless we really understand why, “r is on a permanently low trend” has a similar ring to it.
****
*Yes, a better equation is [r = delta + gamma(g-n) - gamma(gamma-1)sigma^2/2] where n is population growth and (sigma) is consumption volatility. The difference is not important for issues in this post. You need n to get r<g, but changes in n are not driving the decline in r. Also, in many models the slope of individual consumption is not the same as aggregate consumption. For example, in an OLG model without population growth, individual consumption slopes up but aggregate consumption may not grow at all. But we're talking about 10-20 year horizons, not 80 year horizons, and this does not seem to me a force that changed dramatically in the last decades, accounting for the steady downward trend. As above, however, this is the beginning of an exploration, not the end. Even these alternatives are basic econ 101 sorts of stories we should investigate first. Thanks to Olivier for a nice discussion on the latter points.
Government
Low Iron Levels In Blood Could Trigger Long COVID: Study
Low Iron Levels In Blood Could Trigger Long COVID: Study
Authored by Amie Dahnke via The Epoch Times (emphasis ours),
People with inadequate…
Share this:


Authored by Amie Dahnke via The Epoch Times (emphasis ours),
People with inadequate iron levels in their blood due to a COVID-19 infection could be at greater risk of long COVID.
A new study indicates that problems with iron levels in the bloodstream likely trigger chronic inflammation and other conditions associated with the post-COVID phenomenon. The findings, published on March 1 in Nature Immunology, could offer new ways to treat or prevent the condition.
Long COVID Patients Have Low Iron Levels
Researchers at the University of Cambridge pinpointed low iron as a potential link to long-COVID symptoms thanks to a study they initiated shortly after the start of the pandemic. They recruited people who tested positive for the virus to provide blood samples for analysis over a year, which allowed the researchers to look for post-infection changes in the blood. The researchers looked at 214 samples and found that 45 percent of patients reported symptoms of long COVID that lasted between three and 10 months.
In analyzing the blood samples, the research team noticed that people experiencing long COVID had low iron levels, contributing to anemia and low red blood cell production, just two weeks after they were diagnosed with COVID-19. This was true for patients regardless of age, sex, or the initial severity of their infection.
According to one of the study co-authors, the removal of iron from the bloodstream is a natural process and defense mechanism of the body.
But it can jeopardize a person’s recovery.
“When the body has an infection, it responds by removing iron from the bloodstream. This protects us from potentially lethal bacteria that capture the iron in the bloodstream and grow rapidly. It’s an evolutionary response that redistributes iron in the body, and the blood plasma becomes an iron desert,” University of Oxford professor Hal Drakesmith said in a press release. “However, if this goes on for a long time, there is less iron for red blood cells, so oxygen is transported less efficiently affecting metabolism and energy production, and for white blood cells, which need iron to work properly. The protective mechanism ends up becoming a problem.”
The research team believes that consistently low iron levels could explain why individuals with long COVID continue to experience fatigue and difficulty exercising. As such, the researchers suggested iron supplementation to help regulate and prevent the often debilitating symptoms associated with long COVID.
“It isn’t necessarily the case that individuals don’t have enough iron in their body, it’s just that it’s trapped in the wrong place,” Aimee Hanson, a postdoctoral researcher at the University of Cambridge who worked on the study, said in the press release. “What we need is a way to remobilize the iron and pull it back into the bloodstream, where it becomes more useful to the red blood cells.”
The research team pointed out that iron supplementation isn’t always straightforward. Achieving the right level of iron varies from person to person. Too much iron can cause stomach issues, ranging from constipation, nausea, and abdominal pain to gastritis and gastric lesions.
1 in 5 Still Affected by Long COVID
COVID-19 has affected nearly 40 percent of Americans, with one in five of those still suffering from symptoms of long COVID, according to the U.S. Centers for Disease Control and Prevention (CDC). Long COVID is marked by health issues that continue at least four weeks after an individual was initially diagnosed with COVID-19. Symptoms can last for days, weeks, months, or years and may include fatigue, cough or chest pain, headache, brain fog, depression or anxiety, digestive issues, and joint or muscle pain.
Government
Walmart joins Costco in sharing key pricing news
The massive retailers have both shared information that some retailers keep very close to the vest.
Share this:


As we head toward a presidential election, the presumed candidates for both parties will look for issues that rally undecided voters.
The economy will be a key issue, with Democrats pointing to job creation and lowering prices while Republicans will cite the layoffs at Big Tech companies, high housing prices, and of course, sticky inflation.
The covid pandemic created a perfect storm for inflation and higher prices. It became harder to get many items because people getting sick slowed down, or even stopped, production at some factories.
Related: Popular mall retailer shuts down abruptly after bankruptcy filing
It was also a period where demand increased while shipping, trucking and delivery systems were all strained or thrown out of whack. The combination led to product shortages and higher prices.
You might have gone to the grocery store and not been able to buy your favorite paper towel brand or find toilet paper at all. That happened partly because of the supply chain and partly due to increased demand, but at the end of the day, it led to higher prices, which some consumers blamed on President Joe Biden's administration.
Biden, of course, was blamed for the price increases, but as inflation has dropped and grocery prices have fallen, few companies have been up front about it. That's probably not a political choice in most cases. Instead, some companies have chosen to lower prices more slowly than they raised them.
However, two major retailers, Walmart (WMT) and Costco, have been very honest about inflation. Walmart Chief Executive Doug McMillon's most recent comments validate what Biden's administration has been saying about the state of the economy. And they contrast with the economic picture being painted by Republicans who support their presumptive nominee, Donald Trump.
Image source: Joe Raedle/Getty Images
Walmart sees lower prices
McMillon does not talk about lower prices to make a political statement. He's communicating with customers and potential customers through the analysts who cover the company's quarterly-earnings calls.
During Walmart's fiscal-fourth-quarter-earnings call, McMillon was clear that prices are going down.
"I'm excited about the omnichannel net promoter score trends the team is driving. Across countries, we continue to see a customer that's resilient but looking for value. As always, we're working hard to deliver that for them, including through our rollbacks on food pricing in Walmart U.S. Those were up significantly in Q4 versus last year, following a big increase in Q3," he said.
He was specific about where the chain has seen prices go down.
"Our general merchandise prices are lower than a year ago and even two years ago in some categories, which means our customers are finding value in areas like apparel and hard lines," he said. "In food, prices are lower than a year ago in places like eggs, apples, and deli snacks, but higher in other places like asparagus and blackberries."
McMillon said that in other areas prices were still up but have been falling.
"Dry grocery and consumables categories like paper goods and cleaning supplies are up mid-single digits versus last year and high teens versus two years ago. Private-brand penetration is up in many of the countries where we operate, including the United States," he said.
Costco sees almost no inflation impact
McMillon avoided the word inflation in his comments. Costco (COST) Chief Financial Officer Richard Galanti, who steps down on March 15, has been very transparent on the topic.
The CFO commented on inflation during his company's fiscal-first-quarter-earnings call.
"Most recently, in the last fourth-quarter discussion, we had estimated that year-over-year inflation was in the 1% to 2% range. Our estimate for the quarter just ended, that inflation was in the 0% to 1% range," he said.
Galanti made clear that inflation (and even deflation) varied by category.
"A bigger deflation in some big and bulky items like furniture sets due to lower freight costs year over year, as well as on things like domestics, bulky lower-priced items, again, where the freight cost is significant. Some deflationary items were as much as 20% to 30% and, again, mostly freight-related," he added.
bankruptcy pandemic trumpGovernment
Walmart has really good news for shoppers (and Joe Biden)
The giant retailer joins Costco in making a statement that has political overtones, even if that’s not the intent.
Share this:

As we head toward a presidential election, the presumed candidates for both parties will look for issues that rally undecided voters.
The economy will be a key issue, with Democrats pointing to job creation and lowering prices while Republicans will cite the layoffs at Big Tech companies, high housing prices, and of course, sticky inflation.
The covid pandemic created a perfect storm for inflation and higher prices. It became harder to get many items because people getting sick slowed down, or even stopped, production at some factories.
Related: Popular mall retailer shuts down abruptly after bankruptcy filing
It was also a period where demand increased while shipping, trucking and delivery systems were all strained or thrown out of whack. The combination led to product shortages and higher prices.
You might have gone to the grocery store and not been able to buy your favorite paper towel brand or find toilet paper at all. That happened partly because of the supply chain and partly due to increased demand, but at the end of the day, it led to higher prices, which some consumers blamed on President Joe Biden's administration.
Biden, of course, was blamed for the price increases, but as inflation has dropped and grocery prices have fallen, few companies have been up front about it. That's probably not a political choice in most cases. Instead, some companies have chosen to lower prices more slowly than they raised them.
However, two major retailers, Walmart (WMT) and Costco, have been very honest about inflation. Walmart Chief Executive Doug McMillon's most recent comments validate what Biden's administration has been saying about the state of the economy. And they contrast with the economic picture being painted by Republicans who support their presumptive nominee, Donald Trump.
Image source: Joe Raedle/Getty Images
Walmart sees lower prices
McMillon does not talk about lower prices to make a political statement. He's communicating with customers and potential customers through the analysts who cover the company's quarterly-earnings calls.
During Walmart's fiscal-fourth-quarter-earnings call, McMillon was clear that prices are going down.
"I'm excited about the omnichannel net promoter score trends the team is driving. Across countries, we continue to see a customer that's resilient but looking for value. As always, we're working hard to deliver that for them, including through our rollbacks on food pricing in Walmart U.S. Those were up significantly in Q4 versus last year, following a big increase in Q3," he said.
He was specific about where the chain has seen prices go down.
"Our general merchandise prices are lower than a year ago and even two years ago in some categories, which means our customers are finding value in areas like apparel and hard lines," he said. "In food, prices are lower than a year ago in places like eggs, apples, and deli snacks, but higher in other places like asparagus and blackberries."
McMillon said that in other areas prices were still up but have been falling.
"Dry grocery and consumables categories like paper goods and cleaning supplies are up mid-single digits versus last year and high teens versus two years ago. Private-brand penetration is up in many of the countries where we operate, including the United States," he said.
Costco sees almost no inflation impact
McMillon avoided the word inflation in his comments. Costco (COST) Chief Financial Officer Richard Galanti, who steps down on March 15, has been very transparent on the topic.
The CFO commented on inflation during his company's fiscal-first-quarter-earnings call.
"Most recently, in the last fourth-quarter discussion, we had estimated that year-over-year inflation was in the 1% to 2% range. Our estimate for the quarter just ended, that inflation was in the 0% to 1% range," he said.
Galanti made clear that inflation (and even deflation) varied by category.
"A bigger deflation in some big and bulky items like furniture sets due to lower freight costs year over year, as well as on things like domestics, bulky lower-priced items, again, where the freight cost is significant. Some deflationary items were as much as 20% to 30% and, again, mostly freight-related," he added.
bankruptcy pandemic trump

Walmart launches clever answer to Target’s new membership program


EyePoint poaches medical chief from Apellis; Sandoz CFO, longtime BioNTech exec to retire


When Military Rule Supplants Democracy


Catastrophic Risk: Investing and Business Implications


Where Is R‑Star and the End of the Refi Boom: The Top 5 Posts of 2023


The Digest #187


Dropping Like a Stone: ON RRP Take‑up in the Second Half of 2023


The Coming Of The Police State In America


Redefining Poverty: Towards a Transpartisan Approach


Gather ’round the crystal ball: A multi-commodity outlook from PDAC 2024
-

 Uncategorized2 weeks ago
All Of The Elements Are In Place For An Economic Crisis Of Staggering Proportions
-

 Uncategorized1 month ago
Cathie Wood sells a major tech stock (again)
-

 Uncategorized3 weeks ago
California Counties Could Be Forced To Pay $300 Million To Cover COVID-Era Program
-

 Uncategorized2 weeks ago
Apparel Retailer Express Moving Toward Bankruptcy
-

 Uncategorized3 weeks ago
Industrial Production Decreased 0.1% in January
-
International1 day ago
Walmart launches clever answer to Target’s new membership program
-

 Uncategorized3 weeks ago
RFK Jr: The Wuhan Cover-Up & The Rise Of The Biowarfare-Industrial Complex
-

 Uncategorized3 weeks ago
GOP Efforts To Shore Up Election Security In Swing States Face Challenges