Uncategorized
Futures Rise On Hope China’s Deflation Will Lead To More Policy Easing
Futures Rise On Hope China’s Deflation Will Lead To More Policy Easing
S&P futures point to a higher open after China officially entered…
Share this:

S&P futures point to a higher open after China officially entered into deflation with -0.4% CPI print, continuing the buying momentum from the second half of yesterday’s session while European stocks rebound sharply from yesterday's rout led by a rebound in Italian banks after the government backtracked on part of its new windfall tax on lenders. As of 7:45am ET, both S&P and Nasdaq 100 futures are 0.2% higher with other global markets also in risk-on mode, with the euro strengthening, copper rebounding, 10Y TSY yields rising to 4.03% ahead of another closely watched bond auction later today (US government is selling $38 billion of new 10-year notes, $3 billion larger than the last 10-year note debut in May) and oil rising by $1, just inches away from 2023 highs. Rice in Asia soared to its highest level since 2008.
China’s CPI - coming one day before the US inflation number - printed negatively for the first time in two years which is likely to produce a deflationary impulse on core goods inflation, and which according to JPM's trading desk could prove useful to the Fed (and markets) if we see the US Consumer shift back from Services demand to Goods demand this year (more in the full JPM trading desk note this morning available to pro subs). Today’s macro data and earnings focus is on mortgage applications (down 3.1% after sliding 3.0% last week) and DIS earnings. Homebuilders have outperformed the SPX by 23% YTD.
In premarket trading, all the megacap techs are higher, with both KRE and XLF indicated marginally higher. Commodities are higher led by Energy, which also saw a late day rally. WeWork shares crashed 17% after the co-working business said there is “substantial doubt” about its ability to continue operating. Here are some other notable premarket movers:
- Lyft falls as much as 8% after the ride-hailing company reported its slowest revenue growth since the pandemic.
- Penn Entertainment shares rise 9.6% after the sports-entertainment company announced a long-term exclusive partnership with Disney’s ESPN.
- DraftKings fell as much as 6.7% on concern the tie-up between Penn Entertainment and Disney’s ESPN will increase competition.
- Rivian shares rise as much as 2.2% after the electric-vehicle startup raised its full-year production forecast to 52,000 vehicles from 50,000. The company also reported better-than-expected second-quarter results.
- Twilio shares rise as much as 7.9% after the software company reported second-quarter results that beat analysts’ expectations and raised its profit outlook for the year.
- Marqeta jumps 17% after second-quarter revenue at the commerce payments platform beat analyst estimates and analysts flagged the renewal of the Cash App contract with Block (SQ US) as a positive.
- Tango Therapeutics jumps as much as 80%, on track for its biggest rise on record if gains hold, after data was published on competitor Mirati Therapeutics Inc.’s cancer drug candidate MRTX1719.
- Coupang gains 4% after the online retailer reported second-quarter earnings per share that beat estimates. Citi said the company had a “solid” beat on the top-line and Ebitda.
The tentative improvement in sentiment faces a test on Thursday when the latest US CPI data is published. It takes place as a closely watched bond-market gauge of inflation expectations is rising back toward a nine-year high, signaling elevated price pressures for years. The US five-year inflation breakeven - which basically is a proxy for oil prices - has risen to around 2.5%, just shy of the peak in April 2022, when it reached the highest since 2014.
The “inflation report will be key if today’s rally is to be sustained.” said Lewis Grant, a senior portfolio manager at Federated Hermes. “Investor risk aversion has started to wane but remains volatile and investors are anxiously searching for the next signal.”
European stocks are ahead, led by a rebound in Italian banks after the government backtracked on part of its new windfall tax on lenders. The Stoxx 600 is up 1% while the Euro Stoxx Banks Index adds 1.7% after falling 3.5% on Tuesday. UniCredit SpA and Intesa Sanpaolo SpA, at the center of Tuesday’s declines when the new tax was unveiled, became some of Wednesday’s biggest gainers, boosting the Stoxx Europe 600 as much as 1% Wednesday. Here are some of Europe's top movers:
- Delivery Hero gains as much as 10% after the food delivery company demonstrated its path to profitability with a positive adj. Ebitda in the first half
- Vestas Wind Systems rises as much as 3.8% after it published earnings analysts said showed a stronger-than-expected performance for the firm’s Services business
- Sampo shares rise as much as 5.9%, the most since March 2022, after the insurance company owner’s second-quarter earnings came in better than feared
- Italian banks rebound from Tuesday’s slump after the government issued a clarification of its new tax on banks’ windfall profits, saying it will be capped
- Fraport rises as much as 5.2% after Morgan Stanley boosted its price target for the German airport operator as second- quarter earnings provided much-wanted relief
- E.On gain as much as 2.3% after the German energy networks operator reported first- half results in line with an earlier update
- TP ICAP surges as much as 16%, the most since 2020, after the financial services firm delivered results which Canaccord says “give comfort,” and announced a buyback
- Hill & Smith rises as much as 10% as analysts highlights good first-half results and balance sheet strength for the infrastructure and transport company
- Flutter Entertainment drops as much as 6.1% as a new partnership between Penn Entertainment and Disney’s ESPN stoked concern over rising competition
- Ahold Delhaize shares slip as much as 3.6% in early trading after revenue and adjusted operating profit in the US came in below expectations
Asian stocks were mixed after two days of declines, weighed by losses in some Chinese stocks as latest economic data showed further acceleration of deflationary pressures in the economy. The MSCI Asia Pacific Index was up 0.1% for the day. “Investors are clamoring for broad-based stimulus in China. I don’t think we are going to get that,” David Chao, strategist at Investec Asset Management, said on Bloomberg Television. Chao sees China moving ahead with piecemeal measures to support consumption and private investment that may result in “a pop in Chinese equities later this year.”
- Chinese stocks in Hong Kong erased a drop of as much as 0.9%, while the CSI-300 was down about 0.2%, as markets reflected on the mixed inflation data from China which showed CPI Y/Y slipped into deflation territory, albeit at a narrower-than-expected drop in prices, while factory gate prices continued to fall at a steeper than forecast pace. Property stocks in the mainland rebounded after a report said that tier-1 cities are discussing potential measures to ease the malaise in the sector. Property stocks have taken a beating this week over potential default at Country Garden Holdings.
- Japan's Nikkei 225 weakened with trade initially indecisive amid an influx of earnings releases and with the biggest winners and losers all driven by corporate results including SoftBank which was near the bottom end of the spectrum after its surprise loss.
- Meanwhile, Korean stocks were set to snap a five-day selling spree, with retail and foreign investors nibbling in the market. An EV-led selloff in the market has sapped risk sentiment this week, but technology stocks are leading the rebound.
- Indian stocks reversed earlier losses and closed higher on Wednesday, helped by advances in shares of automobile and metal producers. The S&P BSE Sensex rose 0.2% to 65,995.81 in Mumbai, while the NSE Nifty 50 Index advanced 0.3% to 19,632.55. Technology stocks and Reliance Industries also helped benchmarks reverse earlier losses as they recovered in late buying by investors. The BSE IT index closed 0.3% higher.
In FX, the Bloomberg Dollar Index falls 0.1%. The Swedish krona and Norwegian krone are the best performers among the G-10 currencies. The Aussie climbed as much as 0.3% to 65.64 US cents after the People’s Bank of China set the dollar-yuan rate at 548 pips below traders’ estimate, signaling it’s in no rush to withdraw support for the currency. China’s state-owned banks were also seen selling dollars, according to Asia-based FX traders.
In rates, 10-year Treasury yields ticked up ahead of another closely watched bond auction later today, while the treasuries curve was flatter with front-end yields modestly cheaper and long-end little changed vs Tuesday’s closing levels, outperforming bunds and gilts. The US government is expected to sell $38 billion of new 10-year notes, $3 billion larger than the last 10-year note debut in May. Treasury 10-year yields around 4.03%, marginally cheaper on the day with bunds and gilts lagging by additional 2.5bp and 1.5bp in the sector; long-end outperforms ahead of 10- and 30-year supply over Wednesday and Thursday, with 2s10s and 5s30s spreads flatter by 1bp and 1.5bp on the day. Japan bonds drew support during Asia session from data showing China experiencing deflation. Focal point of US session is upsized 10-year note auction, following strong demand for Tuesday’s 3-year note sale. The Treasury auction cycle resumes with $38b 10-year new issue at 1pm New York time and concludes with $23b 30-year bond sale Thursday. WI 10-year at around 4.03% is ~17bp cheaper than July’s stop-out and above auction stops since November.
The week's debt auctions will gauge how concerned investors are about a rising US budget deficit, a week after Fitch Ratings decided to strip the US of its top credit rating. Tuesday’s $42 billion sale of three-year notes had a lower-than-expected yield, a sign that demand was stronger than anticipated.
In crypto, the Fed announced the creation of an activities supervision program to oversee bank tech initiatives which will focus on activities related to crypto, blockchain tech and non-bank tech partnerships, while the Fed said state member banks should receive written non-objection from the Fed before issuing, holding or transacting in dollar tokens, according to Reuters.
In commodities, US crude futures advance, with WTI rising 1% to trade near $83.70. Spot gold adds 0.1%. Bitcoin is down 0.6%.
Looking ahead to today, it will be quiet in terms of data, with weekly mortgage applications in the US and Canada’s monthly building permits. Meanwhile, as the earnings season starts to wind down, we will hear from the likes of Walt Disney, Sony, Vestas and Illumina.
Market Snapshot
- S&P 500 futures up 0.3% to 4,533.75
- MXAP up 0.1% to 165.09
- MXAPJ up 0.5% to 522.35
- Nikkei down 0.5% to 32,204.33
- Topix down 0.4% to 2,282.57
- Hang Seng Index up 0.3% to 19,246.03
- Shanghai Composite down 0.5% to 3,244.49
- Sensex down 0.3% to 65,640.89
- Australia S&P/ASX 200 up 0.4% to 7,337.96
- Kospi up 1.2% to 2,605.12
- STOXX Europe 600 up 0.9% to 462.95
- German 10Y yield little changed at 2.47%
- Euro up 0.2% to $1.0975
- Brent Futures up 0.3% to $86.41/bbl
- Gold spot up 0.2% to $1,929.02
- U.S. Dollar Index down 0.12% to 102.40
Top Overnight News
- A US plan to restrict investment in China will probably only apply to companies that get at least half their revenue from sectors such as quantum computing and AI, people familiar said, allowing PE and VC firms to still put money into bigger conglomerates. The proposal, expected in coming days, will take about a year to go into force. BBG
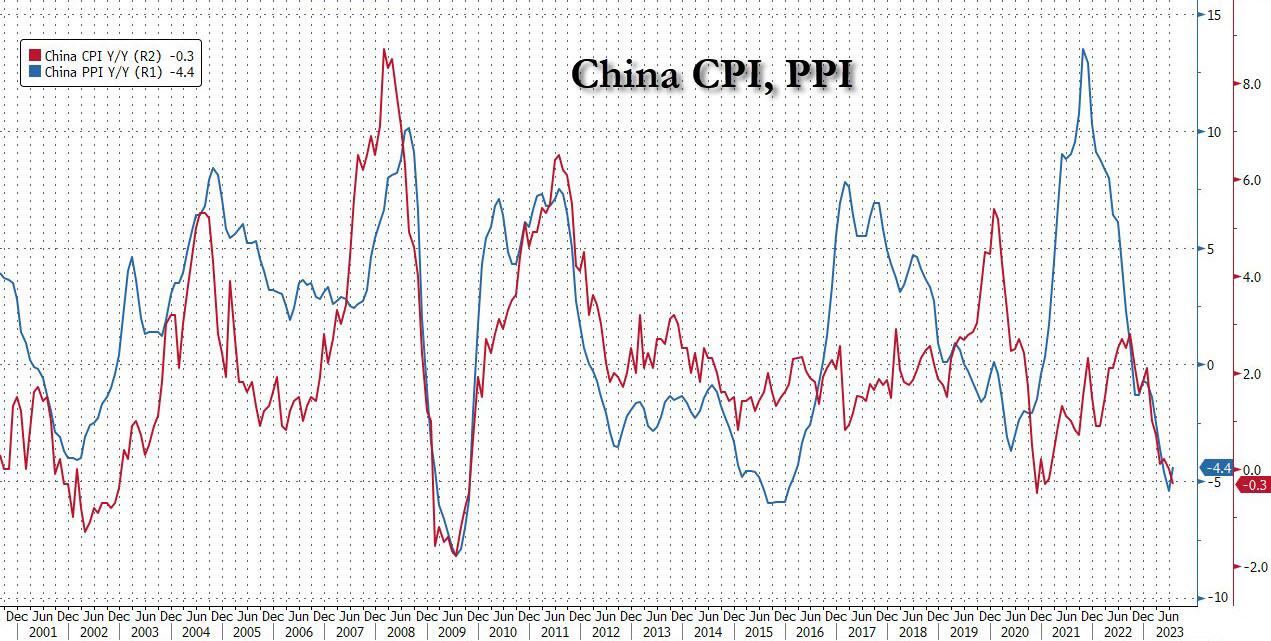
- China’s CPI falls into deflation in Jul (it came in at -0.3% vs. flat in June but not as bad as the Street’s -0.4% forecast) while the PPI sank 4.4% (better than -5.4% in June, but worse than the Street’s -4% forecast). BBG
- Italy backtracks on its planned bank windfall tax as the gov’t looks to calm market jitters, stating that the levy would be capped at 0.1% of RWAs, much smaller than some analysts had feared (the tax will only raise about EU1.8B). FT
- Talks are ongoing to restart the deal that allowed Ukraine to export grain via a safe corridor on the Black Sea, Turkish President Recep Tayyip Erdogan said late Tuesday after speaking with Russian leader Vladimir Putin. BBG
- US banks suffered almost $19bn of losses on soured loans in the second quarter, the highest level in more than three years as lenders contend with rising defaults among credit card and commercial real estate borrowers. FT
- The CBO paints a challenging fiscal picture for the US and now expects that the total deficit for 2023 will be $1.7 trillion, or about $200 billion larger than the estimate it published in May. CBO
- New contract demands made by the United Auto Workers union would add more than $80 billion to each of the biggest US automakers’ labor costs, according to people familiar with the companies’ estimates. BBG
- WeWork on Tuesday raised doubt about its ability to stay in business as the co-working space provider faces losses and a dwindling cash pile amid major changes in the way people work. WSJ
- Amazon is in talks to join other tech companies as an anchor investor in the Arm IPO, a person familiar said. The offering is expected next month and may raise $10 billion. Amazon is already one of Arm's biggest clients. BBG
A more detailed look at global markets courtesy of Newsquawk
APAC stocks traded mixed as participants digested a deluge of earnings releases and the latest inflation data from China which was mixed but showed consumer prices in deflationary territory for the first time in more than two years. ASX 200 was just about kept afloat by the outperformance in its top-weighted financial sector after Australia’s largest lender CBA posted a record FY profit. Nikkei 225 ultimately weakened with trade initially indecisive amid an influx of earnings releases and with the biggest winners and losers all driven by corporate results including SoftBank which was near the bottom end of the spectrum after its surprise loss. Hang Seng and Shanghai Comp were subdued as markets reflected on the mixed inflation data from China which showed CPI Y/Y slipped into deflation territory, albeit at a narrower-than-expected drop in prices, while factory gate prices continued to fall at a steeper than forecast pace.
Top Asian News
- US is set to limit the scope of the China investment ban with a revenue rule and the order limiting investments is expected in the approaching days, according to Bloomberg.
- US lawmakers asked the FCC to address potential threats from Chinese cellular Internet of Things modules in US networks.
- China's National Bureau of Statistics said the Y/Y decline in consumer prices is only temporary.
- China government considering holding leaders with Japan on the sidelines of the ASEAN meeting in Indonesia, according to Kyodo.
European bourses are firmer across the board, Euro Stoxx 50 +1.4%, with newsflow light and the main mover being banks clawing back downside from the Italian windfall tax following an adjustment. As such, the FTSE MIB +1.9% outperforms while the OMX Copenhagen +0.4% is the relatively underperformer as Novo Nordisk pares some of Tuesday's pronounced gains. Stateside, futures are on the front foot and making up for some of the prior session's downside, ES +0.3%, as risk sentiment improves and was further assisted by Fed's Harker.
Top European News
- UK government is pushing back against attempts by some members of the House of Lords for tighter corporate transparency and warned that publishing all trust data could be problematic, according to FT.
- Cap on Italy bank windfall tax halves the estimated hit on average CET1 to 30bps with Fineco (FBK IM) and Bper (BPE IM) among banks benefiting the most, according to Jefferies; elsewhere, cap at 0.1% of assets for new Italian bank tax equates into an aggregate total impact of EUR 1.9bln for banks/asset gatherers, via UBS.
- Swedish NIER Forecasts (July): economy heading for a downturn. Riksbank Rate, end-2023: 4.0% (prev. 3.75%)
FX
- DXY dips under 102.50 to a 102.29 session trough, but price action overall remains contained in quiet trade and newsflow.
- Yuan was in focus during APAC hours given Chinese inflation, with the CNH benefitting post-release and spurred further by reports China's major state-owned banks are seen selling dollars to buy Yuan.
- Antipodeans are the relative outperformers given the week's hefty losses thus far, as sentiment improves slightly and the USD pulls back as mentioned.
- EUR and GBP are both benefiting from the tone/broader USD action, with specifics limited and EUR perhaps deriving support from the Italian government altering its windfall tax.
- PBoC set USD/CNY mid-point at 7.1588 vs exp. 7.2198 (prev. 7.1565)
- China's major state-owned banks were seen selling dollars to buy yuan in the onshore spot FX market.
Fixed Income
- Core benchmarks are relatively contained and yet to deviate much from the unchanged mark in limited newsflow ex-supply; though, there is a minor discrepancy between the performance of core and periphery EGBs.
- Gilts have been the relative outperformers throughout the session with specifics limited though it is worth highlighting that UK debt didn’t benefit quite as much from the week’s initial bullish price action; the 10yr DMO outing was well received and spurred a fresh session high.
- Bunds have been in-fitting but came under some pressure following a relatively tepid German sale, though it is worth caveating that summer conditions apply and desks point out the timing coincided with large volumes going through, which are likely sell orders.
- Stateside, USTs are in-fitting and given the action, there is little of note occurring across the curve where yields are under very modest pressure.
Commodities
- Energy tilts firmer after an overnight session of sideways trade, complex continuing to derive support from Saudi commentary earlier in the week.
- Crude benchmarks are currently above the USD 83.00/bbl and USD 86.50/bbl marks for WTI Sep'23 and Brent Oct'23 respectively.
- Spot gold sees marginal gains, albeit as a function of the softer USD with the yellow metal in a tight range.
- LME copper trades with modest gains but remains under the USD 8,500/t mark in a USD 8,487.50-347.50/t range.
- Iranian oil official says Iran is to produce an extra 250k BPD of oil by the end of summer, according to Tasim.
- India Food Secretary says India has adequate stocks of rice and wheat. Follows on from rice prices within Asia lifting to their highest since 2008.
Geopolitics
- Russia's Defence Minister says Russia is to build up forces at the Western borders, according to Tass.
- Russia shot down two combat drones that were headed towards its capital, according to AFP News Agency citing the Moscow Mayor.
- Polish Deputy Interior Minister says 2k troops to be sent to the Belarus border, via PAP.
US Event Calendar
- 07:00: Aug. MBA Mortgage Applications -3.1%, prior -3.0%
DB's Jim Reid concludes the overnight wrap
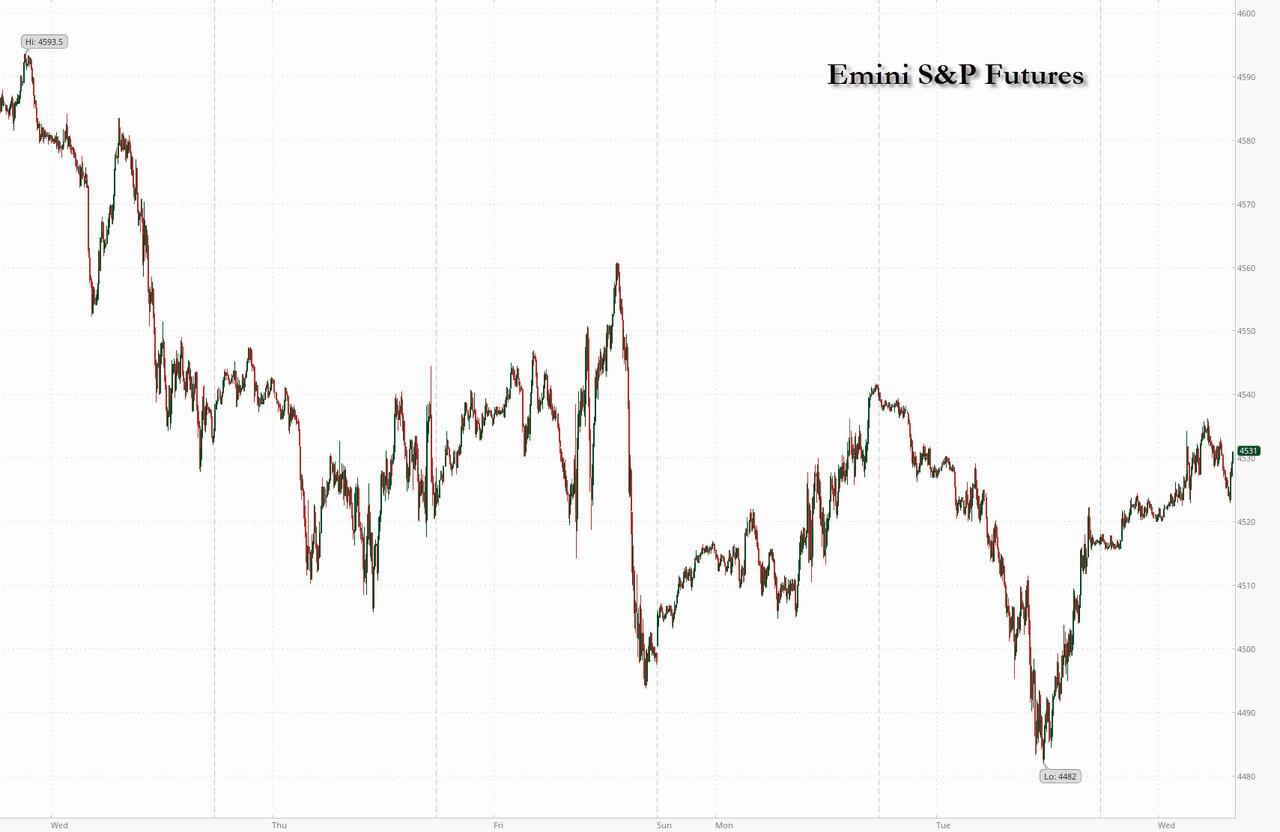
In what is proving to be a volatile August so far, with negative headlines outpacing positive ones, yesterday saw a return to risk-off leaving the S&P 500 down -0.42% on the day, and -1.95% for the month so far. This occurred on the back of weaker Chinese trade data we reported yesterday coupled with negative news on both sides of the Atlantic for the banking sector. However, sentiment improved during the US session, with S&P 500 recovering after being -1.2% down at the lows, in part following a strong 3yr Treasury auction. China has slipped into deflation this morning as expected but the data was broadly inline so there been no additional sell-off momentum so far, with fresh stimulus hopes still in the background.
In the US, the regional banking story reappeared in the headlines after Moody’s downgraded ten small and midsize banks and put a number of larger firms on review or negative outlook. 29 banks in total saw some kind of action. The US regional bank index traded more than -4% lower following the news but recovered to close at -1.38%. The broader banking sector also underperformed, with S&P 500 banks down -1.07%. The regional banking index had reached a post-SVB high the previous day, with a +34% increase since its low in mid-May, having reversed about two thirds of the post-SVB decline. Moody’s cited higher funding costs, potential regulatory capital weakness and increasing commercial real estate risks. In my mind, until we truly know where CRE will bottom its impossible to call the all clear for this cycle. This story won’t fully play out for some time though.
Over in Europe, Italian banks saw a sharp decline (-8.27%) after the Italian government announced a one-off windfall tax of banks that will amount to 40% of the excess net interest margin earned in 2023 (or 2022 if that is higher). However, in the evening the government issued a clarification that the levy would not exceed 0.1% of a firm’s assets. In an update published overnight, our European bank analysts estimate that such a cap would reduce the overall size of the tax by over 40%, though it would still take more than 10% from 2023 profits. See here for more. So this adjustment should improve sentiment today. The broader European banking index had declined -3.54% yesterday, though it is still up +13.6% year-to-date (versus + 7.93% ytd for the broader STOXX 600). The Italian FTSE-MIB (-2.12%) led the declines in Europe with the DAX and CAC -1.10% and -0.69% respectively. Beyond the immediate market impact, the story is a reminder that the burden-sharing of the costs and benefits from higher rates has a habit of becoming a political issue.
The risk-off mood led a decline in long-term yields, with 10yr treasuries down -6.7bps and 30yr -6.3bp (4-5bps up from the day’s lows though). The 2yr had seen a modest sell-off earlier in the day, but ended up closing -1.3bp lower, falling a few bps after a strong 3yr Treasury auction. This saw $42bn of 3yr notes issued at 4.398%, nearly 2bps below its pre-auction trading, with strong indirect demand and record low primary dealer take down. So a successful start to the increased refunding supply of Treasuries. This will be tested more with the 10yr auction today and 30yr auction tomorrow. Yesterday, our US rates strategists published a chart that nicely visualises the large increase in supply that’s due in the coming months – see here for more.
Back in Europe, yields saw an even stronger bull flattening rally. 2yr bund yields were down -6.9bps, while the 10yr yield declined by -13.3bps, its sharpest daily fall since mid-June as the China and banking story dominated.
As discussed earlier, it was a bad day for US equities, but better than it might have been, with the S&P 500 closing -0.42% down. Financials (-0.88%) led the decline. Tech also had a bad day, with the NASDAQ down -0.79% and tech mega caps underperforming, although Apple managed to stem its losses (+0.53%) after five days of decline. A notable outperformer was healthcare, led by a positive reaction to Eli Lilly & Co results the previous evening, which saw its shares jump up by +14.9%. Energy also gained (+0.49%), as oil moved higher during the day (WTI crude +1.20% to $82.92/bl). Comments by Ukraine’s President Zelensky warning that it could target Russian ports if Russia continues to block Ukrainian waters added to oil supply concerns.
In Fed speak, we heard from Philadelphia Fed President Harker. For someone generally perceived to be around the median on the FOMC (and a voter this year), his comments leaned dovish, noting that “we may be at the point where we can be patient and hold rates steady and let the monetary policy actions we have taken do their work”. He also spoke in favour of a soft landing path, saying that “I expect only a modest slowdown in economic activity to go along with a slow but sure disinflation”. Meanwhile, Richmond Fed President Thomas Barkin (non-voter) gave little colour on the policy front, saying he was “leaning toward waiting until September to decide” if another hike is appropriate. In terms of Fed fund expectations, the market continued to see a 34% chance of a hike across the next two meeting but moved to price slightly more cuts for 2024, with end-24 pricing down -2.6bps to 3.97%, its lowest in nearly three weeks.
Overnight, Chinese annual CPI fell in July for the first time in 28 months, slipping -0.3% y/y (v/s -0.4% expected), having flatlined in the previous month. Additionally, PPI extended its decline for the 10th straight month, down -4.4% y/y in July following a -5.4% drop in June as against a market forecast for a -4.0% fall. With CPI and the PPI both falling simultaneously for the first time since 2020, it confirms economy wide deflation which will increase the drumbeat for more stimulus.
Given the inflation data was pretty much inline, Asian equities are more playing catch down to the US move rather than starting a fresh sell-off. The Nikkei (-0.42%), Hang Seng (-0.12%), CSI (-0.19%) and the Shanghai Composite (-0.36%) are seeing losses whilst the KOSPI (+1.08%) is actually higher. S&P 500 (+0.08%) and NASDAQ 100 (+0.18%) futures are trading slightly higher. Meanwhile, yields on the 10yr USTs (-0.6bps) are broadly steady, trading at 4.02% as we go to press.
Looking back at the data yesterday, US data was sparce. The NFIB small optimism ticked up to 91.9 in July (91.3 exp, 91.0 prev.), its highest since last autumn. On the other hand, wholesale trade sales saw a larger-than-expected decline in June (-0.7% vs -0.2% exp).
Over in Europe, we had the ECB’s latest consumer expectations survey. This showed a further moderate decline in inflation expectations in June. However, our economists’ dbDIG consumer survey shows inflation expectations stabilising in July, suggesting that yesterday’s print may mark the end of the decline in the ECB survey. Elsewhere, Germany’s July CPI print was confirmed at +6.2% yoy.
Looking ahead to today, it will be quiet in terms of data, with weekly mortgage applications in the US and Canada’s monthly building permits. Meanwhile, as the earnings season starts to wind down, we will hear from the likes of Walt Disney, Sony, Vestas and Illumina.
Uncategorized
Mortgage rates fall as labor market normalizes
Jobless claims show an expanding economy. We will only be in a recession once jobless claims exceed 323,000 on a four-week moving average.
Share this:


Everyone was waiting to see if this week’s jobs report would send mortgage rates higher, which is what happened last month. Instead, the 10-year yield had a muted response after the headline number beat estimates, but we have negative job revisions from previous months. The Federal Reserve’s fear of wage growth spiraling out of control hasn’t materialized for over two years now and the unemployment rate ticked up to 3.9%. For now, we can say the labor market isn’t tight anymore, but it’s also not breaking.
The key labor data line in this expansion is the weekly jobless claims report. Jobless claims show an expanding economy that has not lost jobs yet. We will only be in a recession once jobless claims exceed 323,000 on a four-week moving average.
From the Fed: In the week ended March 2, initial claims for unemployment insurance benefits were flat, at 217,000. The four-week moving average declined slightly by 750, to 212,250
Below is an explanation of how we got here with the labor market, which all started during COVID-19.
1. I wrote the COVID-19 recovery model on April 7, 2020, and retired it on Dec. 9, 2020. By that time, the upfront recovery phase was done, and I needed to model out when we would get the jobs lost back.
2. Early in the labor market recovery, when we saw weaker job reports, I doubled and tripled down on my assertion that job openings would get to 10 million in this recovery. Job openings rose as high as to 12 million and are currently over 9 million. Even with the massive miss on a job report in May 2021, I didn’t waver.
Currently, the jobs openings, quit percentage and hires data are below pre-COVID-19 levels, which means the labor market isn’t as tight as it once was, and this is why the employment cost index has been slowing data to move along the quits percentage.

3. I wrote that we should get back all the jobs lost to COVID-19 by September of 2022. At the time this would be a speedy labor market recovery, and it happened on schedule, too
Total employment data
4. This is the key one for right now: If COVID-19 hadn’t happened, we would have between 157 million and 159 million jobs today, which would have been in line with the job growth rate in February 2020. Today, we are at 157,808,000. This is important because job growth should be cooling down now. We are more in line with where the labor market should be when averaging 140K-165K monthly. So for now, the fact that we aren’t trending between 140K-165K means we still have a bit more recovery kick left before we get down to those levels.

From BLS: Total nonfarm payroll employment rose by 275,000 in February, and the unemployment rate increased to 3.9 percent, the U.S. Bureau of Labor Statistics reported today. Job gains occurred in health care, in government, in food services and drinking places, in social assistance, and in transportation and warehousing.
Here are the jobs that were created and lost in the previous month:

In this jobs report, the unemployment rate for education levels looks like this:
- Less than a high school diploma: 6.1%
- High school graduate and no college: 4.2%
- Some college or associate degree: 3.1%
- Bachelor’s degree or higher: 2.2%

Today’s report has continued the trend of the labor data beating my expectations, only because I am looking for the jobs data to slow down to a level of 140K-165K, which hasn’t happened yet. I wouldn’t categorize the labor market as being tight anymore because of the quits ratio and the hires data in the job openings report. This also shows itself in the employment cost index as well. These are key data lines for the Fed and the reason we are going to see three rate cuts this year.
recession unemployment covid-19 fed federal reserve mortgage rates recession recovery unemploymentUncategorized
Inside The Most Ridiculous Jobs Report In History: Record 1.2 Million Immigrant Jobs Added In One Month
Inside The Most Ridiculous Jobs Report In History: Record 1.2 Million Immigrant Jobs Added In One Month
Last month we though that the January…
Share this:


Last month we though that the January jobs report was the "most ridiculous in recent history" but, boy, were we wrong because this morning the Biden department of goalseeked propaganda (aka BLS) published the February jobs report, and holy crap was that something else. Even Goebbels would blush.
What happened? Let's take a closer look.
On the surface, it was (almost) another blockbuster jobs report, certainly one which nobody expected, or rather just one bank out of 76 expected. Starting at the top, the BLS reported that in February the US unexpectedly added 275K jobs, with just one research analyst (from Dai-Ichi Research) expecting a higher number.
Some context: after last month's record 4-sigma beat, today's print was "only" 3 sigma higher than estimates. Needless to say, two multiple sigma beats in a row used to only happen in the USSR... and now in the US, apparently.

Before we go any further, a quick note on what last month we said was "the most ridiculous jobs report in recent history": it appears the BLS read our comments and decided to stop beclowing itself. It did that by slashing last month's ridiculous print by over a third, and revising what was originally reported as a massive 353K beat to just 229K, a 124K revision, which was the biggest one-month negative revision in two years!

Of course, that does not mean that this month's jobs print won't be revised lower: it will be, and not just that month but every other month until the November election because that's the only tool left in the Biden admin's box: pretend the economic and jobs are strong, then revise them sharply lower the next month, something we pointed out first last summer and which has not failed to disappoint once.
In the past month the Biden department of goalseeking stuff higher before revising it lower, has revised the following data sharply lower:
— zerohedge (@zerohedge) August 30, 2023
- Jobs
- JOLTS
- New Home sales
- Housing Starts and Permits
- Industrial Production
- PCE and core PCE
To be fair, not every aspect of the jobs report was stellar (after all, the BLS had to give it some vague credibility). Take the unemployment rate, after flatlining between 3.4% and 3.8% for two years - and thus denying expectations from Sahm's Rule that a recession may have already started - in February the unemployment rate unexpectedly jumped to 3.9%, the highest since February 2022 (with Black unemployment spiking by 0.3% to 5.6%, an indicator which the Biden admin will quickly slam as widespread economic racism or something).

And then there were average hourly earnings, which after surging 0.6% MoM in January (since revised to 0.5%) and spooking markets that wage growth is so hot, the Fed will have no choice but to delay cuts, in February the number tumbled to just 0.1%, the lowest in two years...

... for one simple reason: last month's average wage surge had nothing to do with actual wages, and everything to do with the BLS estimate of hours worked (which is the denominator in the average wage calculation) which last month tumbled to just 34.1 (we were led to believe) the lowest since the covid pandemic...

... but has since been revised higher while the February print rose even more, to 34.3, hence why the latest average wage data was once again a product not of wages going up, but of how long Americans worked in any weekly period, in this case higher from 34.1 to 34.3, an increase which has a major impact on the average calculation.

While the above data points were examples of some latent weakness in the latest report, perhaps meant to give it a sheen of veracity, it was everything else in the report that was a problem starting with the BLS's latest choice of seasonal adjustments (after last month's wholesale revision), which have gone from merely laughable to full clownshow, as the following comparison between the monthly change in BLS and ADP payrolls shows. The trend is clear: the Biden admin numbers are now clearly rising even as the impartial ADP (which directly logs employment numbers at the company level and is far more accurate), shows an accelerating slowdown.

But it's more than just the Biden admin hanging its "success" on seasonal adjustments: when one digs deeper inside the jobs report, all sorts of ugly things emerge... such as the growing unprecedented divergence between the Establishment (payrolls) survey and much more accurate Household (actual employment) survey. To wit, while in January the BLS claims 275K payrolls were added, the Household survey found that the number of actually employed workers dropped for the third straight month (and 4 in the past 5), this time by 184K (from 161.152K to 160.968K).

This means that while the Payrolls series hits new all time highs every month since December 2020 (when according to the BLS the US had its last month of payrolls losses), the level of Employment has not budged in the past year. Worse, as shown in the chart below, such a gaping divergence has opened between the two series in the past 4 years, that the number of Employed workers would need to soar by 9 million (!) to catch up to what Payrolls claims is the employment situation.

There's more: shifting from a quantitative to a qualitative assessment, reveals just how ugly the composition of "new jobs" has been. Consider this: the BLS reports that in February 2024, the US had 132.9 million full-time jobs and 27.9 million part-time jobs. Well, that's great... until you look back one year and find that in February 2023 the US had 133.2 million full-time jobs, or more than it does one year later! And yes, all the job growth since then has been in part-time jobs, which have increased by 921K since February 2023 (from 27.020 million to 27.941 million).

Here is a summary of the labor composition in the past year: all the new jobs have been part-time jobs!

But wait there's even more, because now that the primary season is over and we enter the heart of election season and political talking points will be thrown around left and right, especially in the context of the immigration crisis created intentionally by the Biden administration which is hoping to import millions of new Democratic voters (maybe the US can hold the presidential election in Honduras or Guatemala, after all it is their citizens that will be illegally casting the key votes in November), what we find is that in February, the number of native-born workers tumbled again, sliding by a massive 560K to just 129.807 million. Add to this the December data, and we get a near-record 2.4 million plunge in native-born workers in just the past 3 months (only the covid crash was worse)!

The offset? A record 1.2 million foreign-born (read immigrants, both legal and illegal but mostly illegal) workers added in February!

Said otherwise, not only has all job creation in the past 6 years has been exclusively for foreign-born workers...

... but there has been zero job-creation for native born workers since June 2018!

This is a huge issue - especially at a time of an illegal alien flood at the southwest border...

... and is about to become a huge political scandal, because once the inevitable recession finally hits, there will be millions of furious unemployed Americans demanding a more accurate explanation for what happened - i.e., the illegal immigration floodgates that were opened by the Biden admin.
Which is also why Biden's handlers will do everything in their power to insure there is no official recession before November... and why after the election is over, all economic hell will finally break loose. Until then, however, expect the jobs numbers to get even more ridiculous.
Uncategorized
Economic Earthquake Ahead? The Cracks Are Spreading Fast
Economic Earthquake Ahead? The Cracks Are Spreading Fast
Authored by Brandon Smith via Alt-Market.us,
One of my favorite false narratives…
Share this:


Authored by Brandon Smith via Alt-Market.us,
One of my favorite false narratives floating around corporate media platforms has been the argument that the American people “just don’t seem to understand how good the economy really is right now.” If only they would look at the stats, they would realize that we are in the middle of a financial renaissance, right? It must be that people have been brainwashed by negative press from conservative sources…
I have to laugh at this notion because it’s a very common one throughout history – it’s an assertion made by almost every single political regime right before a major collapse. These people always say the same things, and when you study economics as long as I have you can’t help but throw up your hands and marvel at their dedication to the propaganda.
One example that comes to mind immediately is the delusional optimism of the “roaring” 1920s and the lead up to the Great Depression. At the time around 60% of the U.S. population was living in poverty conditions (according to the metrics of the decade) earning less than $2000 a year. However, in the years after WWI ravaged Europe, America’s economic power was considered unrivaled.
The 1920s was an era of mass production and rampant consumerism but it was all fueled by easy access to debt, a condition which had not really existed before in America. It was this illusion of prosperity created by the unchecked application of credit that eventually led to the massive stock market bubble and the crash of 1929. This implosion, along with the Federal Reserve’s policy of raising interest rates into economic weakness, created a black hole in the U.S. financial system for over a decade.
There are two primary tools that various failing regimes will often use to distort the true conditions of the economy: Debt and inflation. In the case of America today, we are experiencing BOTH problems simultaneously and this has made certain economic indicators appear healthy when they are, in fact, highly unstable. The average American knows this is the case because they see the effects everyday. They see the damage to their wallets, to their buying power, in the jobs market and in their quality of life. This is why public faith in the economy has been stuck in the dregs since 2021.
The establishment can flash out-of-context stats in people’s faces, but they can’t force the populace to see a recovery that simply does not exist. Let’s go through a short list of the most faulty indicators and the real reasons why the fiscal picture is not a rosy as the media would like us to believe…
The “miracle” labor market recovery
In the case of the U.S. labor market, we have a clear example of distortion through inflation. The $8 trillion+ dropped on the economy in the first 18 months of the pandemic response sent the system over the edge into stagflation land. Helicopter money has a habit of doing two things very well: Blowing up a bubble in stock markets and blowing up a bubble in retail. Hence, the massive rush by Americans to go out and buy, followed by the sudden labor shortage and the race to hire (mostly for low wage part-time jobs).
The problem with this “miracle” is that inflation leads to price explosions, which we have already experienced. The average American is spending around 30% more for goods, services and housing compared to what they were spending in 2020. This is what happens when you have too much money chasing too few goods and limited production.
The jobs market looks great on paper, but the majority of jobs generated in the past few years are jobs that returned after the covid lockdowns ended. The rest are jobs created through monetary stimulus and the artificial retail rush. Part time low wage service sector jobs are not going to keep the country rolling for very long in a stagflation environment. The question is, what happens now that the stimulus punch bowl has been removed?
Just as we witnessed in the 1920s, Americans have turned to debt to make up for higher prices and stagnant wages by maxing out their credit cards. With the central bank keeping interest rates high, the credit safety net will soon falter. This condition also goes for businesses; the same businesses that will jump headlong into mass layoffs when they realize the party is over. It happened during the Great Depression and it will happen again today.
Cracks in the foundation
We saw cracks in the narrative of the financial structure in 2023 with the banking crisis, and without the Federal Reserve backstop policy many more small and medium banks would have dropped dead. The weakness of U.S. banks is offset by the relative strength of the U.S. dollar, which lures in foreign investors hoping to protect their wealth using dollar denominated assets.
But something is amiss. Gold and bitcoin have rocketed higher along with economically sensitive assets and the dollar. This is the opposite of what’s supposed to happen. Gold and BTC are supposed to be hedges against a weak dollar and a weak economy, right? If global faith in the dollar and in the U.S. economy is so high, why are investors diving into protective assets like gold?
Again, as noted above, inflation distorts everything.
Tens of trillions of extra dollars printed by the Fed are floating around and it’s no surprise that much of that cash is flooding into the economy which simply pushes higher right along with prices on the shelf. But, gold and bitcoin are telling us a more honest story about what’s really happening.
Right now, the U.S. government is adding around $600 billion per month to the national debt as the Fed holds rates higher to fight inflation. This debt is going to crush America’s financial standing for global investors who will eventually ask HOW the U.S. is going to handle that growing millstone? As I predicted years ago, the Fed has created a perfect Catch-22 scenario in which the U.S. must either return to rampant inflation, or, face a debt crisis. In either case, U.S. dollar-denominated assets will lose their appeal and their prices will plummet.
“Healthy” GDP is a complete farce
GDP is the most common out-of-context stat used by governments to convince the citizenry that all is well. It is yet another stat that is entirely manipulated by inflation. It is also manipulated by the way in which modern governments define “economic activity.”
GDP is primarily driven by spending. Meaning, the higher inflation goes, the higher prices go, and the higher GDP climbs (to a point). Eventually prices go too high, credit cards tap out and spending ceases. But, for a short time inflation makes GDP (as well as retail sales) look good.
Another factor that creates a bubble is the fact that government spending is actually included in the calculation of GDP. That’s right, every dollar of your tax money that the government wastes helps the establishment by propping up GDP numbers. This is why government spending increases will never stop – It’s too valuable for them to spend as a way to make the economy appear healthier than it is.
The REAL economy is eclipsing the fake economy
The bottom line is that Americans used to be able to ignore the warning signs because their bank accounts were not being directly affected. This is over. Now, every person in the country is dealing with a massive decline in buying power and higher prices across the board on everything – from food and fuel to housing and financial assets alike. Even the wealthy are seeing a compression to their profit and many are struggling to keep their businesses in the black.
The unfortunate truth is that the elections of 2024 will probably be the turning point at which the whole edifice comes tumbling down. Even if the public votes for change, the system is already broken and cannot be repaired without a complete overhaul.
We have consistently avoided taking our medicine and our disease has gotten worse and worse.
People have lost faith in the economy because they have not faced this kind of uncertainty since the 1930s. Even the stagflation crisis of the 1970s will likely pale in comparison to what is about to happen. On the bright side, at least a large number of Americans are aware of the threat, as opposed to the 1920s when the vast majority of people were utterly conned by the government, the banks and the media into thinking all was well. Knowing is the first step to preparing.
The second step is securing your own financial future – that’s where physical precious metals can play a role. Diversifying your savings with inflation-resistant, uninflatable assets whose intrinsic value doesn’t rely on a counterparty’s promise to pay adds resilience to your savings. That’s the main reason physical gold and silver have been the safe haven store-of-value assets of choice for centuries (among both the elite and the everyday citizen).
* * *
As the world moves away from dollars and toward Central Bank Digital Currencies (CBDCs), is your 401(k) or IRA really safe? A smart and conservative move is to diversify into a physical gold IRA. That way your savings will be in something solid and enduring. Get your FREE info kit on Gold IRAs from Birch Gold Group. No strings attached, just peace of mind. Click here to secure your future today.


Wendy’s has a new deal for daylight savings time haters


Watch Live: President Biden Reminds Americans Just How Good They’ve Got It Thanks To Him


Watch: President Biden Delivers The “Darkest, Most Un-American Speech Given By A President”


These Are The 5 Charts The FDIC Does Not Want You Paying Attention To


Interest rates, the best it gets. It’s time to deploy cash


Is the biotech market rally real? Data suggest comeback in private, public markets


People Who Received Ivermectin Were Better Off, Study Finds


Stock Market’s Top Will Outlast Your Disbelief


COVID-19 May Lead To Persistent Cognitive Impairment, Brain Fog, And Lower IQ Scores


Wealth Inequality by Age in the Post‑Pandemic Era
-

 Uncategorized2 weeks ago
All Of The Elements Are In Place For An Economic Crisis Of Staggering Proportions
-

 Uncategorized1 month ago
Cathie Wood sells a major tech stock (again)
-

 Uncategorized3 weeks ago
California Counties Could Be Forced To Pay $300 Million To Cover COVID-Era Program
-

 Uncategorized2 weeks ago
Apparel Retailer Express Moving Toward Bankruptcy
-

 Uncategorized3 weeks ago
Industrial Production Decreased 0.1% in January
-

 International13 hours ago
Walmart launches clever answer to Target’s new membership program
-

 Uncategorized3 weeks ago
RFK Jr: The Wuhan Cover-Up & The Rise Of The Biowarfare-Industrial Complex
-

 Uncategorized3 weeks ago
GOP Efforts To Shore Up Election Security In Swing States Face Challenges