Spread & Containment
Farnam Street October 2020 Letter: Even Professional Investors Are Neglecting Investment Hygiene
Farnam Street October 2020 Letter: Even Professional Investors Are Neglecting Investment Hygiene
Share this:


Farnam Street Investments letter to investors for the month ended October 2020, titled, “The Day You Became a Better Investor,” discussing the investment hygiene checklist.

Q3 2020 hedge fund letters, conferences and more
This client letter is really a reminder to myself to appreciate the blocking and tackling of sound decisionmaking. It may help others who want to improve as investors, but the lessons are generalizable to knowledge workers of nearly any stripe.
It’s a reasonably safe assumption that you bathe regularly and brush your teeth. You probably floss, comb your hair, and apply concoctions to make yourself smell good. Personal hygiene is evidently essential to humans; the U.S. cosmetics market generated $90 billion in revenue in 2018.
Yet there’s a type of hygiene that I bet you’re ignoring. Most people are.
There are numerous methods to prepare yourself for investment success. You can earn a CFA Level 3 or get your MBA. You can learn accounting, business models, Porter’s Five Forces, unit economics, and discounted cash flows. You can study market structures, Greek-letter-infused options, and historical booms and busts. You can learn about returns on capital, share buybacks, and reinvestment runways.
Don't get me wrong, all of the above are table stakes for investment competence.
Even Professional Investors Are Neglecting Investment Hygiene
But what if I told you there’s a whole world of considerations that even professional investors are neglecting?
I’m speaking specifically about your investment hygiene. It’s the habits, routines, and mindsets that make up your investment process. It’s all the stuff outside the 10Ks, earnings calls, and slide decks. The rest of this letter will discuss best practices and methods for improvement.
For starters, we can split the hygiene universe into a matrix with four categories: internal vs. external, and mental vs. physical.

Internal + Physical = Health
Think about the last time you had a nasty cold. You probably felt tired, foggy-headed, and low energy. The last thing you wanted to do was put in a solid day’s work. Or even worse, can you imagine making a big decision when you were hiding from the world under your covers?
Let’s borrow Munger’s principle of inversion: imagine feeling the exact opposite of sick. Your body is coursing with vibrance and strength. You feel clear-headed and purposeful. You draw in a deep, confident breath and smile.
Which of these physical states would you imagine giving you the best odds at making a sound decision? You already know the answer, yet when was the last time you checked for a peak state before placing a buy or sell order? Sadly, due to unexamined habits and a mismatch between our genes and our modern environments, it’s likely more of us exist toward the sick side of the spectrum. We’ve grown numb to our ailments. When you get yourself to full health, you realize it’s frankly an unfair advantage to be above that mental fog. Frequent readers may remember we wrote about health as an investment differentiator in a previous client letter.
Researchers have found our physical state dramatically affects our decision-making. The wetware of our brains is based on electrical impulses and interacting chemistry. The balance of brain chemicals like serotonin, dopamine, oxytocin, and endorphins are radically altered by our sleep, diet, exertion, and stress. These chemical building blocks act as lenses through which we interpret the sensory data flow of our worlds.
- Get the unfair advantage of health and make decisions with peak energy.
Even our posture impacts our chemistry. Researchers had people assume either a confident or submissive posture for just two minutes. In the confident posture group, testosterone levels increased by 20% and the stress hormone cortisol went down by 10%. Conversely, after the submissive pose, testosterone went down by 25% and cortisol up by 15%. Your posture is affecting your interpretation of the world. Did you sit up a little in your chair after reading this?
- Be aware of body language.
“All life is an experiment. The more experiments you make the better.” - Ralph Waldo Emerson
I’m hesitant to offer any definitive health prescriptions—everyone has opinions and we’re all different. What will work is unique to you, so my suggestion is to experiment until you find what makes you feel fantastic.
Charlie Munger gave us some hint at what not-to-do when he said, “Three things ruin people: drugs, liquor, and leverage.” (I would posit that we can substitute “stress” for “leverage” in this instance.)
- Find what works for you so you feel fantastic.
External + Physical = Environment
In the previous section, we explored how we can control what’s going on inside our bodies to give us a chance at peak decision-making and investment results. Now let’s look outside. Literally.
Existing within four walls is a new phenomenon for our species. The U.S. EPA estimates Americans spend 93% of their time inside. Yet your distant ancestors spent most of their time outside. And they walked. A lot. Current estimates are they covered between 6 to 16 km (4 to 10 miles) per day to make their ancient livings.
It’s little wonder great minds throughout history from Aristotle to Einstein to Steve Jobs credited long walks for their creativity. The famed mathematician, Andrew Wiles, proved Fermat’s last theorem in 1995. He solved a fiendishly difficult math riddle which had stumped literal geniuses for more than 350 years. His advice is to get outside, but don’t forget your pencil: "When I'm walking I find I can concentrate my mind on one very particular aspect of a problem, focusing on it completely. I'd always have a pencil and paper ready, so if I had an idea I could sit down at a bench and start scribbling away."
The Japanese have a practice called shinrin-yoku which translates into “forest bathing.” A 2016 study found forest bathing “significantly reduced pulse rate and significantly increased the score for vigor and decreased the scores for depression, fatigue, anxiety, and confusion.” Being in nature is the rough antithesis of social media. Make sure you defrag your mental hard drive with plenty of time in the verdant outdoors.
- Get outside and walk, preferably in nature.
Your work space deserves thoughtful environmental design. Winston Churchill wisely observed, “We shape our buildings and afterwards our buildings shape us.” You can tinker to find what works for you, but I personally like a lot of natural light and quiet background music when I’m doing heads-down deep work. My office is also overstuffed with Warren Buffett and Berkshire paraphernalia. It serves as a constant reminder to imagine myself in my hero’s shoes. #WWWD
- Thoughtfully design your environment.
In 1729, French astronomer Jean-Jacques de Mairan made a wild discovery. He noticed that the leaves of plants opened in the morning to catch sunlight and closed at twilight to protect themselves overnight. Seems like an obvious adaptation, but here’s where it gets interesting. The plants did this same opening and closing routine, even when hidden in total darkness inside his cabinet. It wasn’t the light that triggered the plant’s actions. The implication was that a humble house plant has a built-in clock.
Humans are equally equipped. Our clock sits inside our hypothalamus and is called the suprachiasmatic nucleus. It’s a cluster of 20,000 cells--the size of a grain of rice. Our internal clock regulates hormones, changes our body temperature, and helps us fall asleep and wake up over a 24-hour cycle.
Your clock affects more than just how you feel. It affects your performance. Researchers found that time-of-day effects can explain 20 percent of the variation in human output. “The performance change between the daily high point and daily low point can be equivalent to the effect on performance of drinking the legal limit of alcohol,” says neuroscientist Russell Foster. You may be “drunk-working” right now depending on the time of day you're reading this.
Our chronotypes change as we age, showing up as cliches: young kids tend to wake up at ungodly early hours, teenagers stay up all night and can’t do anything before lunch, and the elderly are up before the sun and ready for dinner at 4pm, Matlock at 6pm, and bed at 7pm.
It’s not just about energy or feeling mentally sharp. Vigilance is a more apt description. At our peak, our vigilance is highest. This limited reserve helps our brains solve analytical problems and block out distractions. We stay vigilant to the task at hand rather than bouncing around inside our scattered minds.
Depending on the task, vigilance can be an unwanted hindrance. An unconstrained mind is the ticket to outside-the-box thinking. We need a soft and diffuse gaze, not laser focus. Insights usually come when we’re distracted, with fewer inhibitions and less vigilance. #showerthoughts
Here’s our math wizard Andrew Wiles again:
“Leading up to that new idea there has to be a long period of tremendous focus on the problem without any distractions. You have to really think about nothing but that problem--just concentrate on it. Then you stop. Afterwards there seems to be a kind of period of relaxation during which the subconscious appears to take over, and it's during that time that some new insight comes."
Each of us has a physiological chronotype which creates our own personal daily pattern of peak (alert, high energy, high vigilance), trough (tired, slow, easily distracted), and rebound (renewed energy, but limited vigilance). About 75% of us who are early risers and middle-packers follow this archetypal peaktrough-rebound pattern. The remaining 25% are night owls and follow a different pattern: rebound-troughpeak.
To figure out your chronotype, you can use Daniel Pink’s handy questionnaire: http://www.danpink.com/MCTQ
The most important thing you can do is protect your peak. Save your highest-leverage, heads-down work for when you have your fullest reserve of vigilance. Don’t fritter it away with administrative or mundane tasks.
- Be aware of when you work.
I’m a fan of the “Pomodoro Method.” Set a timer for twenty minutes, close the distractions of email, social media, and a thousand browser tabs, and focus on your most important task. When the timer goes off, take a guilt-free break. Get some water, stretch a little, close your eyes and let your brain drift into neutral.
After five minutes of letting go, set the timer and get back to the grindstone. After three or four cycles, reward yourself with a walk outside. Don’t be surprised if inspiration strikes when you’re out there. You’ll be amazed at what you can accomplish within these structured cycles.
- Set a timer.
Internal + Mental = Sharpening the Saw
Mental errors are born from our blindspots. We make mistakes when we miss something important. One way to make sure you don’t make the same investment mistake twice is to use a checklist. Every slip-up becomes a new checklist item for the next evaluation. If you’re really smart like Mohnish Pabrai, you’ll catalog the mistakes of others and learn vicariously through their painful losses. There are simply too many different permutations of investment mistakes and mental models to keep straight in your head. Get them into a checklist and out of the working RAM of your brain.
Checklists have been used to great effect in other industries like airlines and medicine where real lives are at stake. A well-crafted checklist adapts to your investment style over time and is the quickest path to improving your process. The sooner you start failing and cataloging, the sooner you’ll get good.
- Use an investment checklist.
Researcher Robin Hogarth divides the world into kind and wicked learning environments. Kind learning environments link feedback directly to the appropriate actions or judgments and are both accurate and plentiful. Think about riding a bike: you learn quickly (and painfully) when you make a mistake. There’s no ambiguity in crashing and skinning your knee.
In wicked domains, feedback from your actions and decisions is poor, misleading, or even missing. The investment world is about as wicked as it gets. You can be right on your analysis and something unforeseen (like say, a global pandemic) produces an awful result. Perhaps even worse, you could conduct shoddy analysis and yet watch your stock rocket higher for reasons you’ll invent after the fact (maybe global pandemics produce healthy stock market returns?). People are at their most dangerous after dumb-luck smiles upon them. Perhaps unsurprising, separating luck versus skill in the investment world is fiendishly difficult. Fortunately, a weatherman of all people has the answer.
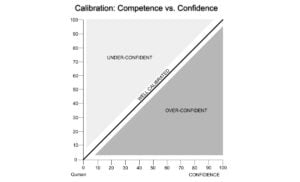
In 1950, a statistician-turned-meterologist named Glenn Brier developed a simple methodology for scoring predictions. The score is based on two factors: the probability assigned to a particular future outcome, and whether it actually happened. Combining these two is called a Brier Score in his honor. It relays the accuracy of your predictions, as well as a calibration of your confidence about the prediction. Check this out for a fun calibration test of your own confidence versus accuracy.
Determining if you are a good investor (or not) can take literally a decade or longer if you’re only observing annual returns. We need to measure ourselves in a different way to speed up the process. One smart hack is to make predictions about the companies you’re interested in and then track the accuracy and your confidence. For instance, you could record that you think there’s a 70% chance that $AAPL’s earnings will be 10% higher in 12 months. You’ll know in a year if that turned out to be true or not, independent of where the stock price goes. You could make five similar predictions about a company’s fundamentals for every one return data point you get in a given year. This can shrink the decade-plus evaluation period considerably, and give you a sense of your own luck versus skill.
Brier scores are the missing element to close the feedback loop and tame the wicked investing environment into submission.

- Make and track probabilistic predictions and get calibrated.
If 2020 has taught us anything, it’s that markets can whipsaw our emotions harder than the most mercurial of lovers. Do you remember the fear permeating March when the S&P 500 plunged more than 25%? How about the euphoria of August as we made new highs?
Chances are, we’re all misremembering key elements of the past. Human memory is based on storytelling. Our memories are only as reliable as the last version of the story we told ourselves. That was good enough for our ancestors to economize brain power and survive on the linear savannah. Yet our story-telling memories can be a liability in a complex world where the arrows between cause and effect are suspect.
When DNA testing was first introduced, Innocence Project researchers reported that 73 percent of the convictions overturned through DNA testing were based on eyewitness testimony. One third of those overturned cases rested on the testimony of two or more mistaken eyewitnesses. “I could have sworn I saw…”
The good news is we have a simple fix for our shoddy memories. Nobel prize winner Daniel Kahneman has the answer:
“Go down to a local drugstore and buy a very cheap notebook and start keeping track of your decisions. And the specific idea is whenever you’re making a consequential decision, something going in or out of the portfolio, just take a moment to think, write down what you expect to happen, why you expect it to happen and then actually, and this is optional, but probably a great idea, is write down how you feel about the situation, both physically and even emotionally. Just, how do you feel? I feel tired. I feel good, or this stock is really draining me. Whatever you think.
The key to doing this is that it prevents something called hindsight bias, which is no matter what happens in the world, we tend to look back on our decision-making process, and we tilt it in a way that looks more favorable to us, right? So we have a bias to explain what has happened.”
- Keep an investment journal.
The investment world is full of the ones that got away. “Why didn’t I buy $AMZN at IPO?! And of course $GOOG was going to be a home run!” We could build a killer portfolio with all of our sins of omission.
“The main mistakes we’ve made, some of them big time, are ones when we didn’t invest at all, even when we understood it was cheap. We’re more likely to make mistakes of omission, not commission.” -- Warren Buffett
Hold on a sec, though. Is it possible we’re fooling ourselves? Perhaps we’re only remembering the rocket ships to wealth that we didn’t climb aboard. There are probably just as many rockets we didn’t get on that exploded on the launchpad, but they don’t spring to mind as easily. Near misses are quickly forgotten.
We need a better system to track all of the investments we’ve rejected. Call it your “anti-portfolio.” It measures the true opportunity cost of the investments we didn’t make. I suggest recording the ideas you said no to and periodically checking in on the whole basket. You’ll get the full picture, not just the acutely painful misses that stick out in your memory.
“I would argue that one filter that’s useful in investing is the simple idea of opportunity cost.” -- Charlie Munger
- Track your opportunity cost.
The real magic gets unlocked when you start coding the reason why you said “no” to a particular idea. This feedback will give you a sense of how your filters are impacting your investment process.
Warren Buffett famously has an inbox on his desk labeled “Too Hard Pile.” The box serves as a reminder to only search for obvious investment opportunities he readily understands. But especially when you’re just starting out, it’s difficult to figure out how hard is “too hard.” What if you find your Too Hard Pile of rejects is consistently shooting the lights out? That could be the nudge you need to put in a little more effort on ideas. Perhaps you’re giving up too early, and there’s investment gold waiting for you if you dug just a little deeper.
The same logic can be used to assess your rejection filters for leverage, business quality, and valuation. How else will you ever know if your rejection filters are poorly calibrated unless you keep score of what you discarded and why?
- Calibrate your rejection filters.
I have an exercise I borrowed from Charlie Munger to help me from repeating mistakes. I call it a “Rub My Nose In It” session. Others call it a postmortem.
“I like people admitting they were complete stupid horses' asses. I know I'll perform better if I rub my nose in my mistakes. This is a wonderful trick to learn.” -- Charlie Munger
Performing a serious study of your mistakes can help lessen the sting of an unsuccessful investment--at least you learn something. A postmortem is also a great way to evolve your checklist. It’s counterintuitive, but a mistake caught, documented, and processed can be more valuable than a success early on in your investment journey. Lose the battle to win the war.
It’s not well-known, but famed UCLA coach John Wooden was an early sports stats-geek. He kept meticulous notes on his players and spent considerable time pre-planning and post-examining his practices. He would follow up every practice with pages of notes: ”we need two more minutes on this drill, less on another.” Full post-mortems. He was maniacal about optimization, which allowed him to get better with more data over time. You can do the same with your investment process with a little thought.
- Conduct postmortems and rub your nose in your mistakes.
External + Mental = Signal vs. Noise
Investing is not a game where the guy with the 160 IQ beats the guy with a 130 IQ. Rationality is essential. What you need is emotional stability. You have to be able to think independently.” -- Warren Buffett
Markets are complex adaptive systems. There are millions of buyers and sellers, interpreting and acting on billions of data points any given year. You’d never try to guess the next move of an ant colony, the shifting of storm clouds, or the sudden break of a school of fish. And yet oceans of pointless ink are spilled predicting the market’s next move, and providing explanations for what just happened.
I’m giving you permission now to ignore all that noise. Put yourself on an information diet.
Famed short-seller Jim Chanos describes research as an information onion. The layers move from closest to the truth out toward the noisy outer shell:
SEC Filings - what the company has to tell you.
Company Information - slide decks and conference calls that represent what the company wants to tell you.
Sell Side Research - what others (often conflicted) want you to know.
Rumors / Social Media - what the crowd thinks.
Spend your valuable research time where the signal-to-noise ratio is the most favorable. That means more 10Ks and less twitter.
- Go on an information diet.
Nassim Taleb has a thought experiment that really opened my eyes. Imagine an investment with a 15% return and 10% volatility. Over one year, you’d have a 93% chance of success. Could we all be so lucky! However, that same investment would only have a 54% chance of success on a given day, and a 50.17% of being up any given minute. It would effectively be a coin flip on whether you felt good or bad if you spent all day focused on minute-by-minute ticks of the tape.
We all share a cognitive bias called “loss aversion.” It means that losses hurt at about twice the magnitude as gains feel good. On a dollar-for-dollar basis, pain is twice that of pleasure. Back to our coin flip: if you were to check your stock price every minute, you would get roughly twice as much pain as joy. If you were to only look once per year, you’d have a 93% chance of feeling good.
Your psychological experience of ownership can be directly affected by how often you check the price. Warren Buffett has observed that stocks don’t care who owns them and that we should be willing to have the stock market close for ten years if we’re going to own something for more than ten minutes. No one is saying this is easy; ignoring the market for long periods can be incredibly difficult in practice. But hanging on every tick is a recipe for heartache, even if your long term outcome is favorable.
- Don’t check your stock prices too often.
Final, Most Important Takeaway
"It's waiting that helps you as an investor, and a lot of people just can't stand to wait." -- Charlie Munger
As we’ve detailed, the world of investing is particularly ripe for inducing brain damage. The environment is noisy, groupthink is common, overconfidence runs amok, and the stakes are high. Only sex, drugs, and rock’n’roll are more emotionally charged than money. The fear of missing out is strong and it goes against our human instincts to do something different than the crowd.
There’s one overarching goal to all this investment hygiene: bolstering your patience.
From optimizing the chemicals in your brain, to taking walks, to the desk you sit at, to the investment journal you keep, to your information diet, to minding your filters, it’s all about cultivating the advantage of
patience.
"The stock market is a device for transferring money from the impatient to the patient." -- Warren Buffett
A deeper pool of patience is the biggest edge you have over professional managers, and you can extend that advantage through your investment hygiene.
- Be patient.
- Start tracking and improving your investment hygiene today.
As always, we’re thankful to have such great partners in this wealth creation journey.
Jake
Investment Hygiene Checklist
- Get the unfair advantage of health and make decisions with peak energy.
- Be aware of body language.
- Find what works for you so you feel fantastic.
- Get outside and walk, preferably in nature.
- Thoughtfully design your environment.
- Be aware of when you work.
- Set a timer.
- Use an investment checklist.
- Make and track probabilistic predictions and get calibrated.
- Keep an investment journal.
- Track your opportunity cost.
- Calibrate your rejection filters.
- Conduct postmortems and rub your nose in your mistakes.
- Go on an information diet.
- Don’t check your stock prices too often.
- Be patient.
- Start tracking and improving your investment hygiene today.
The post Farnam Street October 2020 Letter: Even Professional Investors Are Neglecting Investment Hygiene appeared first on ValueWalk.
International
Catastrophic Risk: Investing and Business Implications
In the context of valuing companies, and sharing those valuations, I do get suggestions from readers on companies that I should value next. While…
Share this:

In the context of valuing companies, and sharing those valuations, I do get suggestions from readers on companies that I should value next. While I don't have the time or the bandwidth to value all of the suggested companies, a reader from Iceland, a couple of weeks ago, made a suggestion on a company to value that I found intriguing. He suggested Blue Lagoon, a well-regarded Icelandic Spa with a history of profitability, that was finding its existence under threat, as a result of volcanic activity in Southwest Iceland. In another story that made the rounds in recent weeks, 23andMe, a genetics testing company that offers its customers genetic and health information, based upon saliva sample, found itself facing the brink, after a hacker claimed to have hacked the site and accessed the genetic information of millions of its customers. Stepping back a bit, one claim that climate change advocates have made not just about fossil fuel companies, but about all businesses, is that investors are underestimating the effects that climate change will have on economic systems and on value. These are three very different stories, but what they share in common is a fear, imminent or expected, of a catastrophic event that may put a company's business at risk.
Deconstructing Risk
While we may use statistical measures like volatility or correlation to measure risk in practice, risk is not a statistical abstraction. Its impact is not just financial, but emotional and physical, and it predates markets. The risks that our ancestors faced, in the early stages of humanity, were physical, coming from natural disasters and predators, and physical risks remained the dominant form of risk that humans were exposed to, almost until the Middle Ages. In fact, the separation of risk into physical and financial risk took form just a few hundred years ago, when trade between Europe and Asia required ships to survive storms, disease and pirates to make it to their destinations; shipowners, ensconced in London and Lisbon, bore the financial risk, but the sailors bore the physical risk. It is no coincidence that the insurance business, as we know it, traces its history back to those days as well.
I have no particular insights to offer on physical risk, other than to note that while taking on physical risks for some has become a leisure activity, I have no desire to climb Mount Everest or jump out of an aircraft. Much of the risk that I think about is related to risks that businesses face, how that risk affects their decision-making and how much it affects their value. If you start enumerating every risk a business is exposed to, you will find yourself being overwhelmed by that list, and it is for that reason that I categorize risk into the groupings that I described in an earlier post on risk. I want to focus in this post on the third distinction I drew on risk, where I grouped risk into discrete risk and continuous risk, with the later affecting businesses all the time and the former showing up infrequently, but often having much larger impact. Another, albeit closely related, distinction is between incremental risk, i.e., risk that can change earnings, growth, and thus value, by material amounts, and catastrophic risk, which is risk that can put a company's survival at risk, or alter its trajectory dramatically.
There are a multitude of factors that can give rise to catastrophic risk, and it is worth highlighting them, and examining the variations that you will observe across different catastrophic risk. Put simply, a volcanic eruption, a global pandemic, a hack of a company's database and the death of a key CEO are all catastrophic events, but they differ on three dimensions:
- Source: I started this post with a mention of a volcano eruption in Iceland put an Icelandic business at risk, and natural disasters can still be a major factor determining the success or failure of businesses. It is true that there are insurance products available to protect against some of these risks, at least in some parts of the world, and that may allow companies in Florida (California) to live through the risks from hurricanes (earthquakes), albeit at a cost. Human beings add to nature's catastrophes with wars and terrorism wreaking havoc not just on human lives, but also on businesses that are in their crosshairs. As I noted in my post on country risk, it is difficult, and sometimes impossible, to build and preserve a business, when you operate in a part of the world where violence surrounds you. In some cases, a change in regulatory or tax law can put the business model for a company or many company at risk. I confess that the line between whether nature or man is to blame for some catastrophes is a gray one and to illustrate, consider the COVID crisis in 2020. Even if you believe you know the origins of COVID (a lab leak or a natural zoonotic spillover), it is undeniable that the choices made by governments and people exacerbated its consequences.
- Locus of Damage: Some catastrophes created limited damage, perhaps isolated to a single business, but others can create damage that extends across a sector geographies or the entire economy. The reason that the volcano eruptions in Iceland are not creating market tremors is because the damage is likely to be isolated to the businesses, like Blue Lagoon, in the path of the lava, and more generally to Iceland, an astonishingly beautiful country, but one with a small economic footprint. An earthquake in California will affect a far bigger swath of companies, partly because the state is home to the fifth largest economy in the world, and the pandemic in 2020 caused an economic shutdown that had consequences across all business, and was catastrophic for the hospitality and travel businesses.
- Likelihood: There is a third dimension on which catastrophic risks can vary, and that is in terms of likelihood of occurrence. Most catastrophic risks are low-probability events, but those low probabilities can become high likelihood events, with the passage of time. Going back to the stories that I started this post with, Iceland has always had volcanos, as have other parts of the world, and until recently, the likelihood that those volcanos would become active was low. In a similar vein, pandemics have always been with us, with a history of wreaking havoc, but in the last few decades, with the advance of medical science, we assumed that they would stay contained. In both cases, the probabilities shifted dramatically, and with it, the expected consequences.
Business owners can try to insulate themselves from catastrophic risk, but as we will see in the next sections those protections may not exist, and even if they do, they may not be complete. In fact, as the probabilities of catastrophic risk increase, it will become more and more difficult to protect yourself against the risk.
Dealing with catastrophic risk
It is undeniable that catastrophic risk affects the values of businesses, and their market pricing, and it is worth examining how it plays out in each domain. I will start this section with what, at least for me, I is familiar ground, and look at how to incorporate the presence of catastrophic risk, when valuing businesses and markets. I will close the section by looking at the equally interesting question of how markets price catastrophic risk, and why pricing and value can diverge (again).
Catastrophic Risk and Intrinsic Value
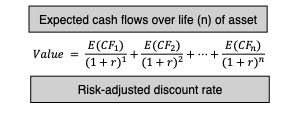
Much as we like to dress up intrinsic value with models and inputs, the truth is that intrinsic valuation at its core is built around a simple proposition: the value of an asset or business is the present value of the expected cash flows on it:

That equation gives rise to what I term the "It Proposition", which is that for "it" to have value, "it" has to affect either the expected cashflows or the risk of an asset or business. This simplistic proposition has served me well when looking at everything from the value of intangibles, as you can see in this post that I had on Birkenstock, to the emptiness at the heart of the claim that ESG is good for value, in this post. Using that framework to analyze catastrophic risk, in all of its forms, its effects can show in almost every input into intrinsic value:

Looking at this picture, your first reaction might be confusion, since the practical question you will face when you value Blue Lagoon, in the face of a volcanic eruption, and 23andMe, after a data hack, is which of the different paths to incorporating catastrophic risks into value you should adopt. To address this, I created a flowchart that looks at catastrophic risk on two dimensions, with the first built around whether you can buy insurance or protection that insulates the company against its impact and the other around whether it is risk that is specific to a business or one that can spill over and affect many businesses.

- Intrinsic Value Effect: If the catastrophic risk is fully insurable, as is sometimes the case, your intrinsic valuation became simpler, since all you have to do is bring in the insurance cost into your expenses, lowering income and cash flows, leave discount rates untouched, and let the valuation play out. Note that you can do this, even if the company does not actually buy the insurance, but you will need to find out the cost of that foregone insurance and incorporate it yourself.
- Pluses: Simplicity and specificity, because all this approach needs is a line item in the income statement (which will either exist already, if the company is buying insurance, or can be estimated).
- Minuses: You may not be able to insure against some risks, either because they are uncommon (and actuaries are unable to estimate probabilities well enough, to set premiums) or imminent (the likelihood of the event happening is so high, that the premiums become unaffordable). Thus, Blue Lagoon (the Icelandic spa that is threatened by a volcanic eruption) might have been able to buy insurance against volcanic eruption a few years ago, but will not be able to do so now, because the risk is imminent. Even when risks are insurable, there is a second potential problem. The insurance may pay off, in the event of the catastrophic event, but it may not offer complete protection. Thus, using Blue Lagoon again as an example, and assuming that the company had the foresight to buy insurance against volcanic eruptions a few years ago, all the insurance may do is rebuild the spa, but it will not compensate the company for lost revenues, as customers are scared away by the fear of volcanic eruptions. In short, while there are exceptions, much of insurance insures assets rather than cash flow streams.
- Applications: When valuing businesses in developed markets, we tend to assume that these businesses have insured themselves against most catastrophic risks and ignore them in valuation consequently. Thus, you see many small Florida-based resorts valued, with no consideration given to hurricanes that they will be exposed to, because you assume that they are fully insured. In the spirit of the “trust, but verity” proposition, you should probably check if that is true, and then follow up by examining how complete the insurance coverage is.
- Intrinsic Value Effect: If the catastrophic risk is not insurable, but the business will survive its occurrence even in a vastly diminished state, you should consider doing two going-concern valuations, one with the assumption that there is no catastrophe and one without, and then attaching a probability to the catastrophic event occurring.Expected Value with Catastrophe = Value without Catastrophe (1 – Probability of Catastrophe) + Value with Catastrophe (Probability of Catastrophe)In these intrinsic valuations, much of the change created by the catastrophe will be in the cash flows, with little or no change to costs of capital, at least in companies where investors are well diversified.
- Pluses: By separating the catastrophic risk scenario from the more benign outcomes, you make the problem more tractable, since trying to adjust expected cash flows and discount rates for widely divergent outcomes is difficult to do.
- Minuses: Estimating the probability of the catastrophe may require specific skills that you do not have, but consulting those who do have those skills can help, drawing on meteorologists for hurricane prediction and on seismologists for earthquakes. In addition, working through the effect on value of the business, if the catastrophe occurs, will stretch your estimation skills, but what options do you have?
- Applications: This approach comes into play for many different catastrophic risks that businesses face, including the loss of a key employee, in a personal-service business, and I used it in my post on valuing key persons in businesses. You can also use it to assess the effect on value of a loss of a big contract for a small company, where that contract accounts for a significant portion of total revenues. It can also be used to value a company whose business models is built upon the presence or absence of a regulation or law, in which case a change in that regulation or law can change value.
- Intrinsic Value Effect: If the catastrophic risk is not insurable, and the business will not survive, if the risk unfolds, the approach parallels the previous one, with the difference being that that the failure value of the business, i.e, what you will generate in cash flows, if it fails, replaces the intrinsic valuation, with catastrophic risk built in:Expected Value with Catastrophe = Value without Catastrophe (1 – Probability of Catastrophe) + Failure Value (Probability of Catastrophe)The failure value will come from liquidation the assets, or what is left of them, after the catastrophe.
- Pluses: As with the previous approach, separating the going concern from the failure values can help in the estimation process. Trying to estimate cash flows, growth rates and cost of capital for a company across both scenarios (going concern and failure) is difficult to do, and it is easy to double count risk or miscount it. It is fanciful to assume that you can leave the expected cash flows as is, and then adjust the cost of capital upwards to reflect the default risk, because discount rates are blunt instruments, designed more to capture going-concern risk than failure risk.
- Minuses: As in the last approach, you still have to estimate a probability that a catastrophe will occur, and in addition, and there can be challenges in estimating the value of a business, if the company fails in the face of catastrophic risk.
- Applications: This is the approach that I use to value highly levered., cyclical or commodity companies, that can deliver solid operating and equity values in periods where they operate as going concerns, but face distress or bankruptcy, in the face of a severe recession. And for a business like the Blue Lagoon, it may be the only pathway left to estimate the value, with the volcano active, and erupting, and it may very well be true that the failure value can be zero.
- Intrinsic Value Effect: The calculations for cashflows are identical to those done when the risks are company-specific, with cash flows estimated with and without the catastrophic risk, but since these risks are sector-wide or market-wide, there will also be an effect on discount rates. Investors will either see more relative risk (or beta) in these companies, if the risks affect an entire sector, or in equity risk premiums, if they are market-wide. Note that these higher discount rates apply in both scenarios.
- Pluses: The risk that is being built into costs of equity is the risk that cannot be diversified away and there are pathways to estimating changes in relative risk or equity risk premiums.
- Minuses: The conventional approaches to estimating betas, where you run a regression of past stock returns against the market, and equity risk premiums, where you trust in historical risk premiums and history, will not work at delivering the adjustments that you need to make.
- Applications: My argument for using implied equity risk premiums is that they are dynamic and forward-looking. Thus, during COVID, when the entire market was exposed to the economic effects of the pandemic, the implied ERP for the market jumped in the first six weeks of the pandemic, when the concerns about the after effects were greatest, and then subsided in the months after, as the fear waned:

In a different vein, one reason that I compute betas by industry grouping, and update them every year, is in the hope that risks that cut across a sector show up as changes in the industry averages. In 2009, for instance, when banks were faced with significant regulatory changes brought about in response to the 2008 crisis, the average beta for banks jumped from 0.71 at the end of 2007 to 0.85 two years later.

The intrinsic value approach assumes that we, as business owners and investors, look at catastrophic risk rationally, and make our assessments based upon how it will play out in cashflows, growth and risk. In truth, is worth remembering key insights from psychology, on how we, as human beings, deal with threats (financial and physical) that we view as existential.
- The first response is denial, an unwillingness to think about catastrophic risks. As someone who lives in a home close to one of California's big earthquake faults, and two blocks from the Pacific Ocean, I can attest to this response, and offer the defense that in its absence, I would wither away from anxiety and fear.
- The second is panic, when the catastrophic risk becomes imminent, where the response is to flee, leaving much of what you have behind.
To see this process at work, consider again how the market initially reacted to the COVID crisis in terms of repricing companies that were at the heart of the crisis. Between February 14, 2020 and March 23, 2020, when fear peaked, the sectors most exposed to the pandemic (hospitality, airlines) saw a decimation in their market prices, during that period:


Government
Redefining Poverty: Towards a Transpartisan Approach
A new report from the National Academies of Science,
Engineering, and Medicine (NASEM), An Updated Measure of
Poverty: (Re)Drawing the Line, has hit…
Share this:


A new report from the National Academies of Science, Engineering, and Medicine (NASEM), An Updated Measure of Poverty: (Re)Drawing the Line, has hit Washington with something of a splash. Its proposals deserve a warm welcome across the political spectrum. Unfortunately, they are not always getting it from the conservative side of the aisle.
The AEI’s Kevin Corinth sees the NASEM proposals as a path to adding billions of dollars to federal spending. Congressional testimony by economist Bruce Meyer takes NASEM to task for outright partisan bias. Yet in their more analytical writing, these and other conservative critics offer many of the same criticisms of the obsolete methods that constitute the current approach to measuring poverty. As I will explain below, many of their recommendations for improvements are in harmony with the NASEM report. Examples include the need for better treatment of healthcare costs, the inclusion of in-kind benefits in resource measures, and greater use of administrative data rather than surveys.
After some reading, I have come to think that the disconnect between the critics’ political negative reaction to the NASEM report and their accurate analysis of flaws in current poverty measures has less to do with the conceptual basis of the new proposals and more with the way they should be put to work. That comes more clearly into focus if we distinguish between what we might call the tracking and the treatment functions, or macro and micro functions, of poverty measurement.
The tracking function has an analytic focus. It is a matter of assessing how many people are poor at a given time and tracing how their number varies in response to changes in policies and economic conditions. The treatment function, in contrast, has an administrative focus. It sets a poverty threshold that can be used to determine who is eligible for specific government programs and what their benefits will be.
There are parallels in the tracking and treatment methods that were developed during the Covid-19 pandemic. By early in 2020, it was clear to public health officials that something big was happening, but slow and expensive testing made it hard to track how and where the SARS-CoV-2 virus was spreading. Later, as tests became faster and more accurate, tracking improved. Wastewater testing made it possible to track the spread of the virus to whole communities even before cases began to show up in hospitals. As time went by, improved testing methods also led to better treatment decisions at the micro level. For example, faster and more accurate home antigen tests enabled effective use of treatments like Paxlovid, which works best if taken soon after symptoms develop.
Poverty measurement, like testing for viruses, also plays essential roles in both tracking and treatment. For maximum effectiveness, what we need is a poverty measure that can be used at both the macro and micro level. The measures now in use are highly flawed in both applications. Both the NASEM report itself and the works of its critics offer useful ideas about where we need to go. The following sections will deal first with the tracking function, then with the treatment function, and then with what needs to be done to devise a poverty measure suitable for both uses.
The tracking function of poverty measurement
As a tracking tool, the purpose of any poverty measure is to improve understanding. Each proposed measure represents the answer to a specific question. To understand poverty fully – what it is, how it has changed, who is poor, and why – we need to ask lots of questions. At this macro level, it is misguided to look for the one best measure of poverty.
First some basics. All of the poverty measures discussed here consist of two elements, a threshold, or measure of needs, and a measure of resources available to meet those needs. The threshold is based on a basic bundle of goods and services considered essential for a minimum acceptable standard of living. The first step in deriving a threshold is to define the basic bundle and determine its cost. The basic bundle can be defined in absolute terms or relative to median standards of living. If absolute, the cost of the basic bundle can be adjusted from year to year to reflect inflation, and if relative, to reflect changes in the median. Once the cost of the basic bundle is established, poverty thresholds themselves may be adjusted to reflect the cost of essentials not explicitly listed in the basic bundle. Further adjustments in the thresholds may be developed to reflect household size and regional differences.
Similarly, a poverty measure can include a narrower or broader definition of resources. A narrow definition might consider only a household’s regular inflows of cash. A broader definition might include the cash-equivalent value of in-kind benefits, benefits provided through the tax system, withdrawals from retirement savings, and other sources of purchasing power.
Finally, a poverty measure needs to specify the economic unit to which it applies. In some cases, that may be an individual. In other cases, it may be a family (a group related by kinship, marriage, adoption, or other legal ties) or a household (a group of people who live together and share resources regardless of kinship or legal relationships). Putting it all together, an individual, family, or household is counted as poor if their available resources are less than the applicable poverty threshold.
The current official poverty measure (OPM), which dates from the early 1960s, includes very simple versions of each of these components. It defines the basic bundle in absolute terms as three times the cost of a “thrifty food plan” determined by the U.S. Department of Agriculture. It then converts that to a set of thresholds for family units that vary by family size, with special adjustments for higher cost of living in Alaska and Hawaii. The OPM defines resources as before-tax regular cash income, including wages, salaries, interest, and retirement income; cash benefits such as Temporary Assistance for Needy Families and Supplemental Security Income; and a few other items. Importantly, the OPM does not include tax credits or the cash-equivalent value of in-kind benefits in its resource measure.
The parameters of the OPM were initially calibrated to produce a poverty rate for 1963 of approximately 20 percent. After that, annual inflation adjustments used the CPI-U, which to this day remains the most widely publicized price index. As nominal incomes rose due to economic growth and inflation, and as cash benefits increased, the share of the population living below the threshold fell. By the early 1970s, it had reached 12 percent. Since then, however, despite some cyclical ups and downs, it has changed little.
Today, nearly everyone views the OPM as functionally obsolete. Some see it as overstating the poverty rate, in that its measure of resources ignores in-kind benefits like the Supplemental Nutrition Assistance Program (SNAP) and tax credits like the Earned Income Tax Credit (EITC). Others see it as understating poverty on the grounds that three times the cost of food is no longer enough to meet minimal needs for shelter, healthcare, childcare, transportation, and modern communication services. Almost no one sees the OPM as just right.
In a recent paper in the Journal of Political Economy, Richard V. Burkhauser, Kevin Corinth, James Elwell, and Jeff Larrimore provide an excellent overview of the overstatement perspective. The question they ask is what percentage of American households today lack the resources they need to reach the original three-times-food threshold. Simply put, was Lyndon Johnson’s “War on Poverty,” on its own terms, a success or failure?
To answer that question, they develop what they call an absolute full-income poverty measure (FPM). Their first step in creating the FPM was to include more expense categories in the basic bundle, but calibrate it to make the FPM poverty rate for 1963 equal to the OPM rate for that year. Next, they expanded the resource measure to reflect the growth of in-kind transfer programs and the effects of taxes and tax credits. They also adopt the household, rather than the family, as their basic unit of analysis. Burkhauser et al. estimate that adding the full value of the EITC and other tax credits to resources, along with all in-kind transfer programs, cuts the poverty rate in 2019 to just 4 percent, far below the official 10.6 percent.
Going further, Burkhauser et al. raise the issue of the appropriate measure of the price level to be used in adjusting poverty thresholds over time. They note that many economists consider that the CPI-U overstates the rate of inflation, at least for the economy as a whole. Instead, they prefer the personal consumption expenditure (PCE) index, which the Fed uses as a guide to monetary policy. Replacing the CPI-U with the PCE reduces the FPM poverty rate for 2019 to just 1.6 percent. It is worth noting, however, that some observers maintain that prices in the basket of goods purchased by poor households tend to rise at a faster rate than the average for all households. In that case, an FPM adjusted for inflation using the PCE would not fully satisfy one of the criteria set by Burkhauser et al., namely, that “the poverty measure should reflect the share of people who lack a minimum level of absolute resources.” (For further discussion of this point, see, e.g., this report to the Office of Management and Budget.)
Burkhauser et al. do not represent 1.6 percent as the “true” poverty rate. As they put it, although the FPM does point to “the near elimination of poverty based on standards from more than half a century ago,” they see that as “an important but insufficient indication of progress.” For a fuller understanding, measuring success or failure of Johnson’s War on Poverty is not enough. A poverty measure for today should give a better picture of the basic needs of today’s households and the resources available to them.
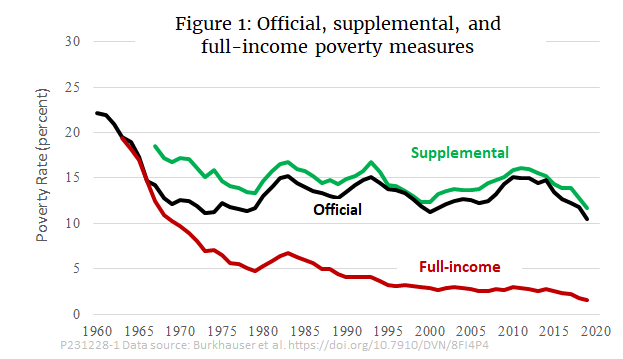
The Supplemental Poverty Measure (SPM), which the Census Bureau has published since 2011, is the best known attempt to modernize the official measure. The SPM enlarges the OPM’s basic bundle of essential goods to include not only food, but also shelter, utilities, telephone, and internet. It takes a relative approach, setting the threshold as a percentage of median expenditures and updating it not just for inflation, but also for the growth in real median household income. On the resource side, the SPM adds many cash and in-kind benefits, although not as many as the FPM. It further adjusts measured resources by deducting some necessary expenses, such as childcare and out-of-pocket healthcare costs. Finally, the SPM moves away from the family as its unit of analysis toward a household concept.
Since the SPM adds items to both thresholds and resources, it could, depending on its exact calibration, have a value either higher or lower than the OPM. In practice, as shown in Figure 1, it has tracked a little higher than the OPM. (For comparison, Burkhauser et al. calculate a variant of their FPM that uses a relative rather than an absolute poverty threshold. The relative FPM, not shown in Figure 1, tracks slightly higher than the SPM in most years.)

That brings us back to our starting point, the NASEM report. Its centerpiece is a recommended revision of the SPM that it calls the principal poverty measure (PPM). The PPM directly addresses several acknowledged shortcomings of the SPM. Some of the most important recommendations include:
- A further movement toward the household as the unit of analysis. To accomplish that, the PPM would place more emphasis on groups of people who live together and less on biological and legal relationships.
- A change in the treatment of healthcare costs. The SPM treats out-of-pocket healthcare spending as a deduction from resources but does not treat healthcare as a basic need. The PPM adds the cost of basic health insurance to its basic package of needs, adds the value of subsidized insurance (e.g., Medicaid or employer-provided) to its list of resources, and (like the SPM) deducts any remaining out-of-pocket healthcare spending from total resources.
- A change in the treatment of the costs of shelter that does a better job of distinguishing between the situation faced by renters and homeowners.
- Inclusion of childcare as a basic need and subsidies to childcare as a resource.
Although Burkhauser et al. do not directly address the PPM, judging by their criticisms of the SPM, it seems likely that they would regard nearly all of these changes as improvements. Many of the changes recommended in the NASEM report make the PPM more similar to the FPM than is the SPM.
Since the NASEM report makes recommendations regarding methodology for the PPM but does not calculate values, the PPM is not shown in Figure 1. In principle, because it modifies the way that both needs and resources are handled, the PPM could, depending on its exact calibration, produce poverty rates either above or below the SPM.
Measurement for treatment
The OPM, FPM, SPM, and PPM are just a few of the many poverty measures that economists have proposed over the years. When we confine our attention to tracking poverty, each of them adds to our understanding. When we turn to treatment, however, things become more difficult. A big part of the reason is that none of the above measures is really suitable for making micro-level decisions regarding the eligibility of particular households for specific programs.
For the OPM, that principle is laid out explicitly in U.S. Office of Management and Budget Statistical Policy Directive No. 14, first issued in 1969 and revised in 1978:
The poverty levels used by the Bureau of the Census were developed as rough statistical measures to record changes in the number of persons and families in poverty and their characteristics, over time. While they have relevance to a concept of poverty, these levels were not developed for administrative use in any specific program and nothing in this Directive should be construed as requiring that they should be applied for such a purpose.
Despite the directive, federal and state agencies do use the OPM, or measures derived from it, to determine eligibility for many programs, including Medicaid, SNAP, the Women, Infants, and Children nutrition program, Affordable Care Act premium subsidies, Medicare Part D low-income subsidies, Head Start, and the National School Lunch Program. The exact eligibility thresholds and the rules for calculating resources vary from program to program. The threshold at which eligibility ends or phase-out begins for a given household may be equal to the Census Bureau’s official poverty threshold, a fraction of that threshold, or a multiple of it. The resource measure may be regular cash income as defined by the OPM, or a modification based on various deductions and add-backs. Some programs include asset tests as well as income tests in their measures of resources. The exact rules for computing thresholds and resources vary not only from one program to another, but from state to state.
That brings us to what is, perhaps, the greatest source of alarm among conservative critics of the NASEM proposals. That is the concern that a new poverty measure such as the PPM would be used in a way that raised qualification thresholds while resource measures remained unchanged. It is easy to understand how doing so by administrative action could be seen as a backdoor way of greatly increasing welfare spending without proper legislative scrutiny.
Kevin Corinth articulates this fear in a recent working paper for the American Enterprise Institute. He notes that while the resource measures that agencies should use in screening applications are usually enshrined in statute, the poverty thresholds are not. If the Office of Management and Budget were to put its official stamp of approval on a new poverty measure such as the SPM or PPM, Corinth maintains that agencies would fall in line and recalculate their thresholds based on the new measure without making any change in the way they measure resources.
Corinth calculates that if the current OPM-based thresholds were replaced by new thresholds derived from the SPM, federal spending for SNAP and Medicaid alone would increase by $124 billion by 2033. No similar calculation can be made for the PPM, since it has not been finalized, but Corinth presumes that it, too, would greatly increase spending if it were used to recalculate thresholds while standards for resources remained unchanged.
Clearly, Corinth is onto a real problem. The whole conceptual basis of the SPM and PPM is to add relevant items in a balanced manner to both sides of the poverty equation, so that they more accurately reflect the balance between the cost of basic needs and the resources available to meet them. Changing one side of the equation while leaving the other untouched makes little sense.
Logically, then, what we need is an approach to poverty measurement that is both conceptually balanced and operationally suitable for use at both the macro and micro levels. Corinth himself acknowledges that at one point, when he notes that “changes could be made to both the SPM resource measure and SPM thresholds.” However, he does not follow up with specific recommendations for doing so. To fill the gap, I offer some ideas of my own in the next section.
Toward a balanced approach to micro-level poverty measurement
To transform the PPM from a tracking tool into one suitable for determining individual households’ eligibility for specific public assistance programs would require several steps.
1. Finalize a package of basic needs. For the PPM, those would include food, clothing, telephone, internet, housing needs based on fair market rents, basic health insurance, and childcare. The NASEM report recommends calibrating costs based on a percentage of median expenditures, but conceptually, they could instead be set in absolute terms, either based on costs in a given year or averaged over a fixed period leading up to the date of implementation of the new approach.
2. Convert the package of needs into thresholds. Thresholds would vary according to the size and composition of the household unit. They could also vary geographically, although there is room for debate on how fine the calibration should be. Thresholds would be updated to reflect changes in the cost of living as measured by changes in median expenditures or (in the absolute version) changes in price levels.
3. Finalize a list of resources. These would include cash income plus noncash benefits that households can use to meet food, clothing, and telecommunication needs; plus childcare subsidies, health insurance benefits and subsidies, rent subsidies, and (for homeowners) imputed rental income; minus tax payments net of refundable tax credits; minus work expenses, nonpremium out-of-pocket medical expenses, homeowner costs if applicable, and child support paid to another household.
4. Centralize collection of data on resources. Determining eligibility of individual households for specific programs would require assembling data from many sources. It would be highly beneficial to centralize the reporting of total resources as much as possible, so that all resource data would be available from a central PPM database. The IRS could provide data on cash income other than public benefits (wages, salaries, interest, dividends, etc.) and payments made to households through refundable tax credits such as the EITC. The federal or state agencies that administer SNAP, Medicaid and other programs could provide household-by-household data directly to the PPM database. Employers could report the cash-equivalent value of employer-provided health benefits along with earnings and taxable benefits.
5. Devise a uniform format for reporting eligible deductions from resources. Individual households applying for benefits from specific programs would be responsible for reporting applicable deductions from resources, such as work expenses, out-of-pocket medical expenses, homeowner costs and so on. A uniform format should be developed for reporting those deductions along with uniform standards for documenting them so that the information could be submitted to multiple benefit programs without undue administrative burden.
6. Use net total resources as the basis for all program eligibility. Decisions on eligibility for individual programs should use net total resources, as determined by steps (4) and (5), to determine eligibility for individual programs.
7. Harmonization of program phase-outs. It would be possible to implement steps (1) through (6) without making major changes to the phase-in and phaseout rules for individual programs. However, once a household-by-household measure of net total resources became available, it would be highly desirable to use it to compute benefit phaseouts from all programs in a harmonized fashion. At present, for example, a household just above the poverty line might face a phaseout rate of 24 percent for SNAP and 21 percent for EITC, giving it an effective marginal tax rate of 45 percent, not counting other programs or income and payroll taxes. As explained in this previous commentary, such high effective marginal tax rates impose severe work disincentives, especially on families that are just making the transition from poverty to self-sufficiency. Replacing the phase-outs for individual programs with a single harmonized “tax” on total resources as computed by the PPM formula could significantly mitigate work disincentives.
Implementing all of these steps would clearly be a major administrative and legislative undertaking. However, the result would be a public assistance system that was ultimately simpler, less prone to error, and less administratively burdensome both for government agencies at all levels and for poor households.
Conclusion
In a recent commentary for the Foundation for Research on Equal Opportunity, Michael Tanner points to the potentially far-reaching significance of proposed revisions to the way poverty is measured. “Congress should use this opportunity to debate even bigger questions,” he writes, such as “what is poverty, and how should policymakers measure it?” Ultimately, he continues, “attempts to develop a statistical measure of poverty venture beyond science, reflecting value judgments and biases. Such measures cannot explain everything about how the poor really live, how easily they can improve their situation, or how policymakers can best help them.”
The “beyond science” caveat is worth keeping in mind for all discussions of poverty measurement. A case in point is the issue of whether to use an absolute or relative approach in defining needs. It is not that one is right and the other wrong. Rather, they reflect fundamentally different philosophies as to what poverty is. For example, as noted earlier, Burkhauser et al. compute both absolute and relative versions of their full-income poverty measure. The absolute version is the right one for answering the historical question they pose about the success or failure of the original War on Poverty, but for purposes of policy today, the choice is not so clear. Some might see an absolute measure, when used in a micro context, as producing too many false negatives, that is, failures to help those truly in need. Others might see the relative approach as producing too many false positives, spending hard-earned taxpayer funds on people who could get by on their own if they made the effort. The choice is more a matter of values than of science.
The choice of a price index for adjusting poverty measures over time also involves values as well as science. Should the index be one based on average consumption patterns for all households, such as the PCE or chained CPI-U, or should it be a special index based on the consumption patterns of low-income households? Should the index be descriptive, that is, based on observed consumption patterns for the group in question? Or should it be prescriptive, that is, based on a subjective estimate of “basics needed to live and work in the modern economy” as is the approach taken by the ALICE Essentials Index?
In closing, I would like to call attention to four additional reasons why conservative critics of existing poverty policy should welcome the proposed PPM, even in its unfinished state, as a major step in the right direction.
The PPM is inherently less prone to error. Bruce Meyer is concerned that “the NAS[EM]-proposed changes to poverty measurement would produce a measure of poverty that does a worse job identifying the most disadvantaged, calling poor those who are better off and not including others suffering more deprivation.” In fact, many features of the PPM make it inherently less prone than either the OPM or the SPM to both false positives and false negatives. The most obvious is its move toward a full-income definition of resources. That avoids one of the most glaring flaws in the OPM, namely, the identification of families as poor who in fact receive sufficient resources in the form of in-kind transfers or tax credits. The PPM also addresses some of the flaws of the SPM that Meyer singles out in his testimony, most notably in the treatment of healthcare. Furthermore, by placing greater emphasis on administrative data sources and less on surveys, the PPM would mitigate underreporting of income and benefits, which Burkhauser et al. identify as a key weakness of the SPM. (See NASEM Recommendations 6.2 and 6.3).
The PPM offers a pathway toward consistency and standardization in poverty policy. In his critique of the PPM, Tanner suggests that “Congress should decouple program eligibility from any single poverty measure, and adopt a broader definition of poverty that examines the totality of the circumstances that low-income people face and their potential to rise above them.” I see that kind of decoupling as exactly the wrong approach. Our existing welfare system is already a clumsy accretion of mutually inconsistent means-tested programs – as many as 80 of them, by one count. It is massively wasteful and daunting to navigate. In large part that is precisely because each component represents a different view of the “totality of circumstances” of the poor as seen by different policymakers at different times. What we need is not decoupling, but standardization and consistency. The proposed system-wide redefinition of poverty offers a perfect opportunity to make real progress in that direction.
The PPM would be more family-friendly. One pro-family feature of the PPM is its recognition of childcare costs on both the needs and the resources sides of the poverty equation. In addition, by moving toward households (defined by resource-sharing) rather than families (defined by legal relationships), the PPM would mitigate the marriage penalties that are built into some of today’s OPM-based poverty programs.
Properly implemented, the PPM would be more work-friendly. As noted above, the benefit cliffs, disincentive deserts, and high effective marginal tax rates of existing OPM-based poverty programs create formidable work disincentives. Moving toward a harmonized phaseout system based on the PPM’s full-income approach to resources could greatly reduce work disincentives, especially for households just above the poverty line that are struggling to take the last steps toward self-sufficiency.
In short, it is wrong to view the proposed PPM as part of a progressive plot to raid the government budget for the benefit of the undeserving, as some conservative critics seem to have done. Rather, both conservatives and progressives should embrace the PPM as a promising step forward and direct their efforts toward making sure it is properly implemented.
Based on a version originally published by Niskanen Center.
subsidies economic growth pandemic covid-19 monetary policy fed irs congress treatment testing spread
Government
Glimpse Of Sanity: Dartmouth Returns Standardized Testing For Admission After Failed Experiment
Glimpse Of Sanity: Dartmouth Returns Standardized Testing For Admission After Failed Experiment
In response to the virus pandemic and nationwide…
Share this:


In response to the virus pandemic and nationwide Black Lives Matter riots in the summer of 2020, some elite colleges and universities shredded testing requirements for admission. Several years later, the test-optional admission has yet to produce the promising results for racial and class-based equity that many woke academic institutions wished.
The failure of test-optional admission policies has forced Dartmouth College to reinstate standardized test scores for admission starting next year. This should never have been eliminated, as merit will always prevail.
"Nearly four years later, having studied the role of testing in our admissions process as well as its value as a predictor of student success at Dartmouth, we are removing the extended pause and reactivating the standardized testing requirement for undergraduate admission, effective with the Class of 2029," Dartmouth wrote in a press release Monday morning.
"For Dartmouth, the evidence supporting our reactivation of a required testing policy is clear. Our bottom line is simple: we believe a standardized testing requirement will improve—not detract from—our ability to bring the most promising and diverse students to our campus," the elite college said.
Who would've thought eliminating standardized tests for admission because a fringe minority said they were instruments of racism and a biased system was ever a good idea?
We’re doomed pic.twitter.com/eNoKVnaOcz
— Clown World ™ ???? (@ClownWorld_) February 5, 2024
Also, it doesn't take a rocket scientist to figure this out. More from Dartmouth, who commissioned the research:
They also found that test scores represent an especially valuable tool to identify high-achieving applicants from low and middle-income backgrounds; who are first-generation college-bound; as well as students from urban and rural backgrounds.
All the colleges and universities that quickly adopted test-optional admissions in 2020 experienced a surge in applications. Perhaps the push for test-optional was under the guise of woke equality but was nothing more than protecting the bottom line for these institutions.
A glimpse of sanity returns to woke schools: Admit qualified kids. Next up is corporate America and all tiers of the US government.


-

 Uncategorized2 weeks ago
All Of The Elements Are In Place For An Economic Crisis Of Staggering Proportions
-

 Uncategorized1 month ago
Cathie Wood sells a major tech stock (again)
-

 Uncategorized3 weeks ago
California Counties Could Be Forced To Pay $300 Million To Cover COVID-Era Program
-

 Uncategorized2 weeks ago
Apparel Retailer Express Moving Toward Bankruptcy
-

 Uncategorized3 weeks ago
Industrial Production Decreased 0.1% in January
-

 International1 month ago
War Delirium
-

 Uncategorized3 weeks ago
RFK Jr: The Wuhan Cover-Up & The Rise Of The Biowarfare-Industrial Complex
-

 Uncategorized3 weeks ago
GOP Efforts To Shore Up Election Security In Swing States Face Challenges