Spread & Containment
Can a hot but smaller labor market keep making gains in participation?
It is simultaneously true that labor supply is not back to its pre-pandemic projected path and that labor demand is strong relative to supply. The result…
Share this:

By Lauren Bauer, Aidan Creeron, Wendy Edelberg, Sara Estep
It is simultaneously true that labor supply is not back to its pre-pandemic projected path and that labor demand is strong relative to supply. The result is a smaller but hot labor market.
In anticipation of the release of this month’s Employment Situation Report, we take stock of the size and composition of the labor force to identify both populations and policies that could contribute to gains in labor force participation. Such gains would increase labor market income and would help the economy grow without creating more inflationary pressure.
As of June 2022, the size of the labor force has shrunk relative to its pre-pandemic path: the labor force is roughly three- to three-and-a-half million workers smaller than its pre-pandemic projection.[1] A large portion of the decrease in the size of the labor force relative to pre-pandemic projections—approximately a third—has nothing to do with labor force participation. First, the population is smaller because of pandemic-related deaths. While those deaths have been concentrated among those 65 and older (three-quarters of a million), more than a quarter of a million pandemic-related deaths are estimated for those between the ages of 18 and 64. Second, there are ongoing pandemic- and policy-related factors that are depressing immigration.
The biggest decline in the labor force has been among those ages 55 and over, with those 65 and older accounting for about a third of the total decline, owing to a combination of death among this group and lower labor force participation. The declines in participation likely reflect early retirements, concerns about health, and to some extent excess disability and lower life expectancy caused by disability due to COVID-19.
The aggregate labor force participation rate (the share of the population over the age of 16 who is working or actively seeking work) remains depressed at 62.2 percent. This piece documents changes in labor force participation between June 2022 and two earlier periods: 2016 (when LFPR began to pick up after a sustained decline) and 2000 (when LFPR peaked). By controlling for the contribution of changing demographics to LFPR, we isolate the contribution of participation to the differences in LFPR from June 2022 to 2016 and 2000. This analysis explores the opportunities that a smaller but hotter labor market afford, identifies populations who could drive labor force growth, and points to public policy interventions that could increase labor force participation.
Trends in labor force participation due to demographics
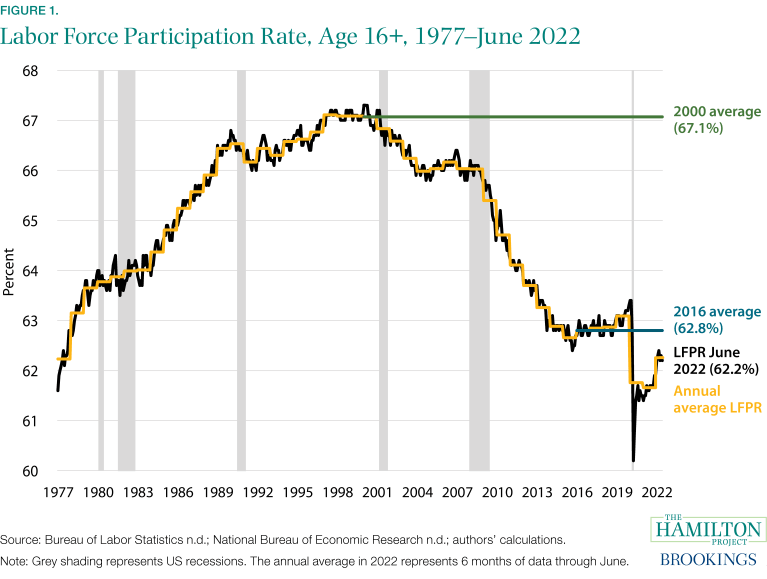
Figure 1 shows monthly and annualized labor force participation rates from the late 1970s to today. As of June 2022, LFPR is 0.9 percentage points below its 2019 average rate.[2] It is also 0.6 percentage points below its 2016 rate—the year the rate began its three-year rebound after 15 years of decline. And, compared to its 2000 peak, LFPR is down 4.9 percentage points; LFPR’s peak in 2000 reflected rising labor force entry among women, whose participation rate grew by more than 20 percentage points between the early 1960s and the turn of the century.
The overall decline in LFPR from the early 2000s has largely reflected the aging of the population and the movement away from work for young adults in school, which more than offset the increase in LFPR from increases in educational attainment (both high school and postsecondary) and from older workers staying in the labor market longer. Labor force participation has also been influenced by the business cycle, declining in the aftermath of the Great Recession and the COVID-19 recession and then recovering as conditions improved. Aaronson et al. find that structural factors (such as aging, the trajectory of participation among certain demographic groups, and disability insurance takeup) could explain almost all of the decline in LFPR between 2007 and 2014.
Figure 2 shows the effects of changing demographics on labor force participation. The figure shows two dashed lines that represent what the labor force participation rate would have been had the age, education, and sex distribution stayed the same but other factors continued to affect LFPR. Holding age, education, and sex constant at 2000 levels (the green line), the LFPR low point would have been 64.5 percent in 2020, rather than 61.8 percent; in other words, population aging and other demographic factors contributed 2.7 percentage points to the difference in LFPR between 2000 and 2020 and changing participation rates within groups 2.5 percentage points.[3] Additionally, even in the relatively short period since 2016, changes in demographics have pulled down LFPR. As shown by the gap between the blue dashed line and the black line, changing demographics lowered, on net, LFPR in June 2022 by 1.1 percentage points.

Changes in participation unrelated to demography
Although demographics explained most of the decline in LFPR from 2000 to 2009, other factors pushing down LFPR became increasingly apparent and important after the Great Recession through 2016. Indeed, at the time, policymakers, economists, and other observers had significant concerns that LFPR was continuing to decline even as other parts of the economy recovered. Then, from 2016 through just before the pandemic, LFPR rose even as demographics, on net, pushed it down. That experience offers evidence that factors can indeed push up labor force participation within demographic groups.
Figure 3a shows how changing labor force participation rates among different demographic groups contributed to the net change in LFPR from 2016 to June 2022 (shown in the blue dashed line in Figure 2). Figure 3b decomposes the change since 2000 (shown in the green dashed line in Figure 2). These decompositions show how LFPR has changed within demographic groups, that is, the portion of the labor force participation rate that changes with the propensity for different demographic groups to work. We find that groups with lower LFPRs than in prior periods have room for further recovery in LFPR, under the right conditions.
The contribution to LFPR of different groups’ propensity to work: 2016-June 2022
While on net LFPR as of June 2022 is still below its 2016 rate, some groups are participating at higher rates while others at lower rates. From 2016 to June 2022, women made the greatest positive contribution to the overall labor force participation rate, netting an increase of 0.4 percentage points, compared to men at 0.1 percentage point. Prime-age (25- to 54-year-old) women increased aggregate LFPR by 0.1 percentage points while prime-age men reduced it by 0.1 percentage points. Among prime-age men, the biggest decline came from men without a bachelor’s degree. The decline for women between 45 and 54 with less than a bachelor’s degree was also sizable.
In 2019, half of all prime-age women who were in the labor force had children under the age of 18. Women handled the brunt of child care responsibilities during COVID-19 and were the most likely to leave the labor force. Based on this analysis, women under 44 are more than back to their pre-COVID participation. Women between the ages of 25 and 44 added about a fifth of a percentage point to LFPR since 2016; more than two-thirds of that gain can be attributed to women with at least a bachelor’s degree.
Young people—those between the ages of 16 and 24—had the largest positive contribution to LFPR from 2016 to June 2022; men and women between the ages of 16 to 24 with less than a college degree added more than 0.6 percentage points to LFPR during that period.
For people 55 and over, a declining propensity to work reduced LFPR by 0.1 percentage points. Men with bachelor’s degrees over the age of 55 and women over the age of 65 collectively reduced LFPR by 0.3 percentage points from 2016 to June 2022; in some cases, these may have been early retirements spurred by COVID-19. Interestingly, less educated men ages 45 and older increased aggregate LFPR by 0.1 percentage point; more than half of this increase came from the 65+ age group.

The contribution to LFPR of different groups’ propensity to work: 2000-June 2022
Figure 3b decomposes the labor force participation rate between 2000 to June 2022 (holding demographics constant), helping to put the changes since 2016 in a longer-term context. Nearly three quarters of the decline since 2000 is attributable to the 16-24 group, whose pivot toward exclusive schooling consequentially explains their movement away from work; it remains to be seen whether the magnitude of the 2016 to June 2022 rebound will persist, partly reversing the long-term trend.
Men and women ages 25 to 54 with less than a bachelor’s reduced overall labor force participation by 0.81 percentage points and 0.83 percentage points, respectively, since 2000. To be sure, some structural factors not accounted for here help to explain those declines. For example, the flow of net international migration to the United States has decreased substantially since 2016. Because immigrants tend to have higher LFPRs, that decrease puts downward pressure on the aggregate LFPR. Nonetheless, the high-water mark in 2000 suggests room for more significant increases in LFPRs among prime-age people than if we just compare current conditions to those in 2016.
For all groups over the age of 55, LFPRs have been higher since 2000 even though some of these groups saw decreases since 2016. For a time, improving health at older ages and changes in work conditions drove LFPRs up among older workers, but the COVID-19 pandemic dramatically altered those trends, both in terms of the health of older workers and the risk that working posed to them. However, even after the pandemic has receded as a factor determining LFPR, the past few years may have shown that LFPRs among older people will not persistently rise as predicted. For example, a greater share of the increases in LFPRs among older people in the decade after the Great Recession may have been a temporary response to the loss of wealth and earnings early in that period; the increase in wealth from equity and real estate prices in 2020 and 2021 along with the health effects of the pandemic may have abruptly ended that response.
Comparing LFPRs among different groups between June 2022 and both 2016 and 2000 shows where history suggests there is the potential for increases. Among prime-age people—particularly among men and among people without a bachelor’s degree—comparisons to earlier years suggests room for substantial increases. In contrast, the recent decreases in LFPR among older workers still leaves participation rates higher than in 2000. Improvements among that group depend on whether the pandemic persistently altered the trends that had been pushing up LFPRs. In addition, the increases among younger workers may not be durable if those ages 16 to 24 return to going to school exclusively.
How Can the Labor Market Grow Through Increased Participation?
Based on this analysis, is there room for the labor market to grow? Yes.
The factors that have depressed labor force participation among older people and that have increased labor demand in general have led to opportunities for younger workers; but, this has not led to uniformly higher participation for all groups under age 65. Most significantly, participation is still depressed for prime-age men—particularly those without a bachelor’s degree. The decline for women between 45 and 54 with less than a bachelor’s degree has also been sizable. If LFPR came back to its pre-pandemic trend for those groups, the labor force would be larger by hundreds of thousands of workers.
Hot labor market conditions in 2016-19 pulled less educated prime-age men off the sidelines and into the labor market. These men are likely more responsive to current labor market demand-side factors than older workers. And indeed, men with less than a bachelor’s over the age of 45 were participating at a higher rate in June 2022 than in 2016. However, the experience of 2016-2019 showed that these men responded to an improvement in labor market conditions with a considerable lag. Even though participation remains depressed among less educated men under 45, policymakers should continue to focus on encouraging participation among this group.
Moreover, policymakers should not take for granted the increases in participation seen so far among other groups. On the whole, prime-age women have increased their LFPR relative to 2016 lows. However, those gains may have come at great personal cost among women with young children and other care responsibilities during the pandemic. Moreover, LFPRs among prime-age women with less than a bachelor’s are still well below the levels in 2000. This group should garner the attention of policymakers hoping to increase the size of the labor market, and The Hamilton Project has put out policy proposals that improve productivity and room for advancement in jobs that require less formal education.
In order to pull people off the sidelines, policies that spur productivity and wage growth, remove barriers to entry, invest in workforce development, and increase the returns to work for those with lower wages through the Earned Income Tax Credit will be crucial. As the ongoing COVID-19 pandemic becomes endemic, proposals that allow people with disabilities to more fully engage in the labor market are essential to help improve participation. Policy proposals to support women in the workforce, whether by increasing the returns to work or by supporting caregiving and child care responsibilities, will allow women to not only enter but stay in the labor force.
[1] Calculating the changes in the sizes of the population and labor force relative to pre-pandemic projections is less straightforward than it might appear. In January 2022, the US Bureau of Labor Statistics updated its population estimates for household survey data to introduce the blended 2020 decennial census to the population composition and size. This revision was incorporated into the data starting in 2022, which implies revisions to early years. That makes 2022 estimates of labor force participation and the labor force look somewhat better than the years leading into the pandemic for technical reasons. If one adds the increase in the size of the labor force between December 2021 and January 2022 to 2022 Q2 and compares it with the labor force projection from the Congressional Budget Office (CBO) in January 2020: the size of the difference between the CBO projection plus the January increase and June 2022 is about three-and-a-half million. One would arrive at the three million number if instead one extrapolates pre-pandemic trends to determine the labor force projection alongside the annual revisions to the size of the population; in other words, the size of the difference between the actual labor force and the pre-pandemic trend is roughly three million.
[2] As detailed in footnote 1, the one-time population revision incorporated into the monthly CPS exaggerates the progress made in closing the LFPR gap between 2019 and 2022.
[3] Throughout this analysis, we hold age, sex, and education constant to document the contribution of changing labor force participation within these groups. Were we to hold only age and sex fixed, the counterfactual LFPR (shown in the dashed lines in figure 2) in June 2022 would have been 63.7 percent (2016 age and sex demographics held constant) and 66.9 percent (2000 age and sex demographics held constant).
The Brookings Institution is financed through the support of a diverse array of foundations, corporations, governments, individuals, as well as an endowment. A list of donors can be found in our annual reports, published online. The findings, interpretations, and conclusions in this report are solely those of its author(s) and are not influenced by any donation.
recession pandemic covid-19 real estate deaths recession recoverySpread & Containment
Another beloved brewery files Chapter 11 bankruptcy
The beer industry has been devastated by covid, changing tastes, and maybe fallout from the Bud Light scandal.
Share this:


Before the covid pandemic, craft beer was having a moment. Most cities had multiple breweries and taprooms with some having so many that people put together the brewery version of a pub crawl.
It was a period where beer snobbery ruled the day and it was not uncommon to hear bar patrons discuss the makeup of the beer the beer they were drinking. This boom period always seemed destined for failure, or at least a retraction as many markets seemed to have more craft breweries than they could support.
Related: Fast-food chain closes more stores after Chapter 11 bankruptcy
The pandemic, however, hastened that downfall. Many of these local and regional craft breweries counted on in-person sales to drive their business.
And while many had local and regional distribution, selling through a third party comes with much lower margins. Direct sales drove their business and the pandemic forced many breweries to shut down their taprooms during the period where social distancing rules were in effect.
During those months the breweries still had rent and employees to pay while little money was coming in. That led to a number of popular beermakers including San Francisco's nationally-known Anchor Brewing as well as many regional favorites including Chicago’s Metropolitan Brewing, New Jersey’s Flying Fish, Denver’s Joyride Brewing, Tampa’s Zydeco Brew Werks, and Cleveland’s Terrestrial Brewing filing bankruptcy.
Some of these brands hope to survive, but others, including Anchor Brewing, fell into Chapter 7 liquidation. Now, another domino has fallen as a popular regional brewery has filed for Chapter 11 bankruptcy protection.
Image source: Shutterstock
Covid is not the only reason for brewery bankruptcies
While covid deserves some of the blame for brewery failures, it's not the only reason why so many have filed for bankruptcy protection. Overall beer sales have fallen driven by younger people embracing non-alcoholic cocktails, and the rise in popularity of non-beer alcoholic offerings,
Beer sales have fallen to their lowest levels since 1999 and some industry analysts
"Sales declined by more than 5% in the first nine months of the year, dragged down not only by the backlash and boycotts against Anheuser-Busch-owned Bud Light but the changing habits of younger drinkers," according to data from Beer Marketer’s Insights published by the New York Post.
Bud Light parent Anheuser Busch InBev (BUD) faced massive boycotts after it partnered with transgender social media influencer Dylan Mulvaney. It was a very small partnership but it led to a right-wing backlash spurred on by Kid Rock, who posted a video on social media where he chastised the company before shooting up cases of Bud Light with an automatic weapon.
Another brewery files Chapter 11 bankruptcy
Gizmo Brew Works, which does business under the name Roth Brewing Company LLC, filed for Chapter 11 bankruptcy protection on March 8. In its filing, the company checked the box that indicates that its debts are less than $7.5 million and it chooses to proceed under Subchapter V of Chapter 11.
"Both small business and subchapter V cases are treated differently than a traditional chapter 11 case primarily due to accelerated deadlines and the speed with which the plan is confirmed," USCourts.gov explained.
Roth Brewing/Gizmo Brew Works shared that it has 50-99 creditors and assets $100,000 and $500,000. The filing noted that the company does expect to have funds available for unsecured creditors.
The popular brewery operates three taprooms and sells its beer to go at those locations.
"Join us at Gizmo Brew Works Craft Brewery and Taprooms located in Raleigh, Durham, and Chapel Hill, North Carolina. Find us for entertainment, live music, food trucks, beer specials, and most importantly, great-tasting craft beer by Gizmo Brew Works," the company shared on its website.
The company estimates that it has between $1 and $10 million in liabilities (a broad range as the bankruptcy form does not provide a space to be more specific).
Gizmo Brew Works/Roth Brewing did not share a reorganization or funding plan in its bankruptcy filing. An email request for comment sent through the company's contact page was not immediately returned.
bankruptcy pandemic social distancing
Spread & Containment
Revving up tourism: Formula One and other big events look set to drive growth in the hospitality industry
With big events drawing a growing share of of tourism dollars, F1 offers a potential glimpse of the travel industry’s future.
Share this:


In late 2023, I embarked on my first Formula One race experience, attending the first-ever Las Vegas Grand Prix. I had never been to an F1 race; my interest was sparked during the pandemic, largely through the Netflix series “Formula 1: Drive to Survive.”
But I wasn’t just attending as a fan. As the inaugural chair of the University of Florida’s department of tourism, hospitality and event management, I saw this as an opportunity. Big events and festivals represent a growing share of the tourism market – as an educator, I want to prepare future leaders to manage them.
And what better place to learn how to do that than in the stands of the Las Vegas Grand Prix?

The future of tourism is in events and experiences
Tourism is fun, but it’s also big business: In the U.S. alone, it’s a US$2.6 trillion industry employing 15 million people. And with travelers increasingly planning their trips around events rather than places, both industry leaders and academics are paying attention.
Event tourism is also key to many cities’ economic development strategies – think Chicago and its annual Lollapalooza music festival, which has been hosted in Grant Park since 2005. In 2023, Lollapalooza generated an estimated $422 million for the local economy and drew record-breaking crowds to the city’s hotels.
That’s why when Formula One announced it would be making a 10-year commitment to host races in Las Vegas, the region’s tourism agency was eager to spread the news. The 2023 grand prix eventually generated $100 million in tax revenue, the head of that agency later announced.
Why Formula One?
Formula One offers a prime example of the economic importance of event tourism. In 2022, Formula One generated about $2.6 billion in total revenues, according to the latest full-year data from its parent company. That’s up 20% from 2021 and 27% from 2019, the last pre-COVID year. A record 5.7 million fans attended Formula One races in 2022, up 36% from 2019.
This surge in interest can be attributed to expanded broadcasting rights, sponsorship deals and a growing global fan base. And, of course, the in-person events make a lot of money – the cheapest tickets to the Las Vegas Grand Prix were $500.

That’s why I think of Formula One as more than just a pastime: It’s emblematic of a major shift in the tourism industry that offers substantial job opportunities. And it takes more than drivers and pit crews to make Formula One run – it takes a diverse range of professionals in fields such as event management, marketing, engineering and beyond.
This rapid industry growth indicates an opportune moment for universities to adapt their hospitality and business curricula and prepare students for careers in this profitable field.
How hospitality and business programs should prepare students
To align with the evolving landscape of mega-events like Formula One races, hospitality schools should, I believe, integrate specialized training in event management, luxury hospitality and international business. Courses focusing on large-scale event planning, VIP client management and cross-cultural communication are essential.
Another area for curriculum enhancement is sustainability and innovation in hospitality. Formula One, like many other companies, has increased its emphasis on environmental responsibility in recent years. While some critics have been skeptical of this push, I think it makes sense. After all, the event tourism industry both contributes to climate change and is threatened by it. So, programs may consider incorporating courses in sustainable event management, eco-friendly hospitality practices and innovations in sustainable event and tourism.
Additionally, business programs may consider emphasizing strategic marketing, brand management and digital media strategies for F1 and for the larger event-tourism space. As both continue to evolve, understanding how to leverage digital platforms, engage global audiences and create compelling brand narratives becomes increasingly important.
Beyond hospitality and business, other disciplines such as material sciences, engineering and data analytics can also integrate F1 into their curricula. Given the younger generation’s growing interest in motor sports, embedding F1 case studies and projects in these programs can enhance student engagement and provide practical applications of theoretical concepts.
Racing into the future: Formula One today and tomorrow
F1 has boosted its outreach to younger audiences in recent years and has also acted to strengthen its presence in the U.S., a market with major potential for the sport. The 2023 Las Vegas race was a strategic move in this direction. These decisions, along with the continued growth of the sport’s fan base and sponsorship deals, underscore F1’s economic significance and future potential.
Looking ahead in 2024, Formula One seems ripe for further expansion. New races, continued advancements in broadcasting technology and evolving sponsorship models are expected to drive revenue growth. And Season 6 of “Drive to Survive” will be released on Feb. 23, 2024. We already know that was effective marketing – after all, it inspired me to check out the Las Vegas Grand Prix.
I’m more sure than ever that big events like this will play a major role in the future of tourism – a message I’ll be imparting to my students. And in my free time, I’m planning to enhance my quality of life in 2024 by synchronizing my vacations with the F1 calendar. After all, nothing says “relaxing getaway” quite like the roar of engines and excitement of the racetrack.
Rachel J.C. Fu does not work for, consult, own shares in or receive funding from any company or organization that would benefit from this article, and has disclosed no relevant affiliations beyond their academic appointment.
spread pandemicGovernment
Students lose out as cities and states give billions in property tax breaks to businesses − draining school budgets and especially hurting the poorest students
An estimated 95% of US cities provide economic development tax incentives to woo corporate investors, taking billions away from schools.
Share this:


Built in 1910, James Elementary is a three-story brick school in Kansas City, Missouri’s historic Northeast neighborhood, with a bright blue front door framed by a sand-colored stone arch adorned with a gargoyle. As bustling students and teachers negotiate a maze of gray stairs with worn wooden handrails, Marjorie Mayes, the school’s principal, escorts a visitor across uneven blue tile floors on the ground floor to a classroom with exposed brick walls and pipes. Bubbling paint mars some walls, evidence of the water leaks spreading inside the aging building.
“It’s living history,” said Mayes during a mid-September tour of the building. “Not the kind of living history we want.”
The district would like to tackle the US$400 million in deferred maintenance needed to create a 21st century learning environment at its 35 schools – including James Elementary – but it can’t. It doesn’t have the money.
Property tax redirect
The lack of funds is a direct result of the property tax breaks that Kansas City lavishes on companies and developers that do business there. The program is supposed to bring in new jobs and business but instead has ended up draining civic coffers and starving schools. Between 2017 and 2023, the Kansas City school district lost $237.3 million through tax abatements.
Kansas City is hardly an anomaly. An estimated 95% of U.S. cities provide economic development tax incentives to woo corporate investors. The upshot is that billions have been diverted from large urban school districts and from a growing number of small suburban and rural districts. The impact is seen in districts as diverse as Chicago and Cleveland, Hillsboro, Oregon, and Storey County, Nevada.
The result? A 2021 review of 2,498 financial statements from school districts across 27 states revealed that, in 2019 alone, at least $2.4 billion was diverted to fund tax incentives. Yet that substantial figure still downplays the magnitude of the problem, because three-quarters of the 10,370 districts analyzed did not provide any information on tax abatement agreements.
Tax abatement programs have long been controversial, pitting states and communities against one another in beggar-thy-neighbor contests. Their economic value is also, at best, unclear: Studies show most companies would have made the same location decision without taxpayer subsidies. Meanwhile, schools make up the largest cost item in these communities, meaning they suffer most when companies are granted breaks in property taxes.
A three-month investigation by The Conversation and three scholars with expertise in economic development, tax laws and education policy shows that the cash drain from these programs is not equally shared by schools in the same communities. At the local level, tax abatements and exemptions often come at the cost of critical funding for school districts that disproportionately serve students from low-income households and who are racial minorities.
In Missouri, for example, in 2022 nearly $1,700 per student was redirected from Kansas City public and charter schools, while between $500 and $900 was redirected from wealthier, whiter Northland schools on the north side of the river in Kansas City and in the suburbs beyond. Other studies have found similar demographic trends elsewhere, including New York state, South Carolina and Columbus, Ohio.
The funding gaps produced by abated money often force schools to delay needed maintenance, increase class sizes, lay off teachers and support staff and even close outright. Schools also struggle to update or replace outdated technology, books and other educational resources. And, amid a nationwide teacher shortage, schools under financial pressures sometimes turn to inexperienced teachers who are not fully certified or rely too heavily on recruits from overseas who have been given special visa status.
Lost funding also prevents teachers and staff, who often feed, clothe and otherwise go above and beyond to help students in need, from earning a living wage. All told, tax abatements can end up harming a community’s value, with constant funding shortfalls creating a cycle of decline.
Incentives, payoffs and guarantees
Perversely, some of the largest beneficiaries of tax abatements are the politicians who publicly boast of handing out the breaks despite the harm to poorer communities. Incumbent governors have used the incentives as a means of taking credit for job creation, even when the jobs were coming anyway.
“We know that subsidies don’t work,” said Elizabeth Marcello, a doctoral lecturer at Hunter College who studies governmental planning and policy and the interactions between state and local governments. “But they are good political stories, and I think that’s why politicians love them so much.”
While some voters may celebrate abatements, parents can recognize the disparities between school districts that are created by the tax breaks. Fairleigh Jackson pointed out that her daughter’s East Baton Rouge third grade class lacks access to playground equipment.
The class is attending school in a temporary building while their elementary school undergoes a two-year renovation.
The temporary site has some grass and a cement slab where kids can play, but no playground equipment, Jackson said. And parents needed to set up an Amazon wish list to purchase basic equipment such as balls, jump ropes and chalk for students to use. The district told parents there would be no playground equipment due to a lack of funds, then promised to install equipment, Jackson said, but months later, there is none.

Jackson said it’s hard to complain when other schools in the district don’t even have needed security measures in place. “When I think about playground equipment, I think that’s a necessary piece of child development,” Jackson said. “Do we even advocate for something that should be a daily part of our kids’ experience when kids’ safety isn’t being funded?”
Meanwhile, the challenges facing administrators 500-odd miles away at Atlanta Public Schools are nothing if not formidable: The district is dealing with chronic absenteeism among half of its Black students, many students are experiencing homelessness, and it’s facing a teacher shortage.
At the same time, Atlanta is showering corporations with tax breaks. The city has two bodies that dole them out: the Development Authority of Fulton County, or DAFC, and Invest Atlanta, the city’s economic development agency. The deals handed out by the two agencies have drained $103.8 million from schools from fiscal 2017 to 2022, according to Atlanta school system financial statements.
What exactly Atlanta and other cities and states are accomplishing with tax abatement programs is hard to discern. Fewer than a quarter of companies that receive breaks in the U.S. needed an incentive to invest, according to a 2018 study by the Upjohn Institute for Employment Research, a nonprofit research organization.
This means that at least 75% of companies received tax abatements when they’re not needed – with communities paying a heavy price for economic development that sometimes provides little benefit.
In Kansas City, for example, there’s no guarantee that the businesses that do set up shop after receiving a tax abatement will remain there long term. That’s significant considering the historic border war between the Missouri and Kansas sides of Kansas City – a competition to be the most generous to the businesses, said Jason Roberts, president of the Kansas City Federation of Teachers and School-Related Personnel. Kansas City, Missouri, has a 1% income tax on people who work in the city, so it competes for as many workers as possible to secure that earnings tax, Roberts said.
Under city and state tax abatement programs, companies that used to be in Kansas City have since relocated. The AMC Theaters headquarters, for example, moved from the city’s downtown to Leawood, Kansas, about a decade ago, garnering some $40 million in Promoting Employment Across Kansas tax incentives.
Roberts said that when one side’s financial largesse runs out, companies often move across the state line – until both states decided in 2019 that enough was enough and declared a cease-fire.
But tax breaks for other businesses continue. “Our mission is to grow the economy of Kansas City, and application of tools such as tax exemptions are vital to achieving that mission, said Jon Stephens, president and CEO of Port KC, the Kansas City Port Authority. The incentives speed development, and providing them "has resulted in growth choosing KC versus other markets,” he added.
In Atlanta, those tax breaks are not going to projects in neighborhoods that need help attracting development. They have largely been handed out to projects that are in high demand areas of the city, said Julian Bene, who served on Invest Atlanta’s board from 2010 to 2018. In 2019, for instance, the Fulton County development authority approved a 10-year, $16 million tax abatement for a 410-foot-tall, 27,000-square-foot tower in Atlanta’s vibrant Midtown business district. The project included hotel space, retail space and office space that is now occupied by Google and Invesco.
In 2021, a developer in Atlanta pulled its request for an $8 million tax break to expand its new massive, mixed-use Ponce City Market development in the trendy Beltline neighborhood with an office tower and apartment building. Because of community pushback, the developer knew it likely did not have enough votes from the commission for approval, Bene said. After a second try for $5 million in lower taxes was also rejected, the developer went ahead and built the project anyway.
Invest Atlanta has also turned down projects in the past, Bene said. Oftentimes, after getting rejected, the developer goes back to the landowner and asks for a better price to buy the property to make their numbers work, because it was overvalued at the start.
Trouble in Philadelphia
On Thursday, Oct. 26, 2023, an environmental team was preparing Southwark School in Philadelphia for the winter cold. While checking an attic fan, members of the team saw loose dust on top of flooring that contained asbestos. The dust that certainly was blowing into the floors below could contain the cancer-causing agent. Within a day, Southwark was closed – the seventh Philadelphia school temporarily shuttered since the previous academic year because of possible asbestos contamination.
A 2019 inspection of the John L Kinsey school in Philadelphia found asbestos in plaster walls, floor tiles, radiator insulation and electrical panels. Asbestos is a major problem for Philadelphia’s public schools. The district needs $430 million to clean up the asbestos, lead, and other environmental hazards that place the health of students, teachers and staff at risk. And that is on top of an additional $2.4 billion to fix failing and damaged buildings.
Yet the money is not available. Matthew Stem, a former district official, testified in a 2023 lawsuit about financing of Pennsylvania schools that the environmental health risks cannot be addressed until an emergency like at Southwark because “existing funding sources are not sufficient to remediate those types of issues.”
Meanwhile, the city keeps doling out abatements, draining money that could have gone toward making Philadelphia schools safer. In the fiscal year ending June 2022, such tax breaks cost the school district $118 million – more than 25% of the total amount needed to remove the asbestos and other health dangers. These abatements take 31 years to break even, according to the city’s own scenario impact analyses.
Huge subsets of the community – primarily Black, Brown, poor or a combination – are being “drastically impacted” by the exemptions and funding shortfalls for the school district, said Kendra Brooks, a Philadelphia City Council member. Schools and students are affected by mold, asbestos and lead, and crumbling infrastructure, as well as teacher and staffing shortages – including support staff, social workers and psychologists.
More than half the district’s schools that lacked adequate air conditioning – 87 schools – had to go to half days during the first week of the 2023 school year because of extreme heat. Poor heating systems also leave the schools cold in the winter. And some schools are overcrowded, resulting in large class sizes, she said.

Teachers and researchers agree that a lack of adequate funding undermines educational opportunities and outcomes. That’s especially true for children living in poverty. A 2016 study found that a 10% increase in per-pupil spending each year for all 12 years of public schooling results in nearly one-third of a year of more education, 7.7% higher wages and a 3.2% reduction in annual incidence of adult poverty. The study estimated that a 21.7% increase could eliminate the high school graduation gap faced by children from low-income families.
More money for schools leads to more education resources for students and their teachers. The same researchers found that spending increases were associated with reductions in student-to-teacher ratios, increases in teacher salaries and longer school years. Other studies yielded similar results: School funding matters, especially for children already suffering the harms of poverty.
While tax abatements themselves are generally linked to rising property values, the benefits are not evenly distributed. In fact, any expansion of the tax base due to new property construction tends to be outside of the county granting the tax abatement. For families in school districts with the lost tax revenues, their neighbors’ good fortune likely comes as little solace. Meanwhile, a poorly funded education system is less likely to yield a skilled and competitive workforce, creating longer-term economic costs that make the region less attractive for businesses and residents.
“There’s a head-on collision here between private gain and the future quality of America’s workforce,” said Greg LeRoy, executive director at Good Jobs First, a Washington, D.C., advocacy group that’s critical of tax abatement and tracks the use of economic development subsidies.

As funding dwindles and educational quality declines, additional families with means often opt for alternative educational avenues such as private schooling, home-schooling or moving to a different school district, further weakening the public school system.
Throughout the U.S., parents with the power to do so demand special arrangements, such as selective schools or high-track enclaves that hire experienced, fully prepared teachers. If demands aren’t met, they leave the district’s public schools for private schools or for the suburbs. Some parents even organize to splinter their more advantaged, and generally whiter, neighborhoods away from the larger urban school districts.
Those parental demands – known among scholars as “opportunity hoarding” – may seem unreasonable from the outside, but scarcity breeds very real fears about educational harms inflicted on one’s own children. Regardless of who’s to blame, the children who bear the heaviest burden of the nation’s concentrated poverty and racialized poverty again lose out.
Rethinking in Philadelphia and Riverhead
Americans also ask public schools to accomplish Herculean tasks that go far beyond the education basics, as many parents discovered at the onset of the pandemic when schools closed and their support for families largely disappeared.
A school serving students who endure housing and food insecurity must dedicate resources toward children’s basic needs and trauma. But districts serving more low-income students spend less per student on average, and almost half the states have regressive funding structures.
Facing dwindling resources for schools, several cities have begun to rethink their tax exemption programs.
The Philadelphia City Council recently passed a scale-back on a 10-year property tax abatement by decreasing the percentage of the subsidy over that time. But even with that change, millions will be lost to tax exemptions that could instead be invested in cash-depleted schools. “We could make major changes in our schools’ infrastructure, curriculum, staffing, staffing ratios, support staff, social workers, school psychologists – take your pick,” Brooks said.
Other cities looking to reform tax abatement programs are taking a different approach. In Riverhead, New York, on Long Island, developers or project owners can be granted exemptions on their property tax and allowed instead to shell out a far smaller “payment in lieu of taxes,” or PILOT. When the abatement ends, most commonly after 10 years, the businesses then will pay full property taxes.
At least, that’s the idea, but the system is far from perfect. Beneficiaries of the PILOT program have failed to pay on time, leaving the school board struggling to fill a budget hole. Also, the payments are not equal to the amount they would receive for property taxes, with millions of dollars in potential revenue over a decade being cut to as little as a few hundred thousand. On the back end, if a business that’s subsidized with tax breaks fails after 10 years, the projected benefits never emerge.
And when the time came to start paying taxes, developers have returned to the city’s Industrial Development Agency with hat in hand, asking for more tax breaks. A local for-profit aquarium, for example, was granted a 10-year PILOT program break by Riverhead in 1999; it has received so many extensions that it is not scheduled to start paying full taxes until 2031 – 22 years after originally planned.
Kansas City border politics
Like many cities, Kansas City has a long history of segregation, white flight and racial redlining, said Kathleen Pointer, senior policy strategist for Kansas City Public Schools.

Troost Avenue, where the Kansas City Public Schools administrative office is located, serves as the city’s historic racial dividing line, with wealthier white families living in the west and more economically disadvantaged people of color in the east. Most of the district’s schools are located east of Troost, not west.
Students on the west side “pretty much automatically funnel into the college preparatory middle school and high schools,” said The Federation of Teachers’ Roberts. Those schools are considered signature schools that are selective and are better taken care of than the typical neighborhood schools, he added.
The school district’s tax levy was set by voters in 1969 at 3.75%. But successive attempts over the next few decades to increase the levy at the ballot box failed. During a decadeslong desegregation lawsuit that was eventually resolved through a settlement agreement in the 1990s, a court raised the district’s levy rate to 4.96% without voter approval. The levy has remained at the same 4.96% rate since.
Meanwhile, Kansas City is still distributing 20-year tax abatements to companies and developers for projects. The district calculated that about 92% of the money that was abated within the school district’s boundaries was for projects within the whiter west side of the city, Pointer said.
“Unfortunately, we can’t pick or choose where developers build,” said Meredith Hoenes, director of communications for Port KC. “We aren’t planning and zoning. Developers typically have plans in place when they knock on our door.”
In Kansas City, several agencies administer tax incentives, allowing developers to shop around to different bodies to receive one. Pointer said he believes the Port Authority is popular because they don’t do a third-party financial analysis to prove that the developers need the amount that they say they do.
With 20-year abatements, a child will start pre-K and graduate high school before seeing the benefits of a property being fully on the tax rolls, Pointer said. Developers, meanwhile, routinely threaten to build somewhere else if they don’t get the incentive, she said.
In 2020, BlueScope Construction, a company that had received tax incentives for nearly 20 years and was about to roll off its abatement, asked for another 13 years and threatened to move to another state if it didn’t get it. At the time, the U.S. was grappling with a racial reckoning following the murder of George Floyd, who was killed by a Minneapolis police officer.
“That was a moment for Kansas City Public Schools where we really drew a line in the sand and talked about incentives as an equity issue,” Pointer said.
After the district raised the issue – tying the incentives to systemic racism – the City Council rejected BlueScope’s bid and, three years later, it’s still in Kansas City, fully on the tax rolls, she said. BlueScope did not return multiple requests for comment.
Recently, a multifamily housing project was approved for a 20-year tax abatement by the Port Authority of Kansas City at Country Club Plaza, an outdoor shopping center in an affluent part of the city. The housing project included no affordable units. “This project was approved without any independent financial analysis proving that it needed that subsidy,” Pointer said.
All told, the Kansas City Public Schools district faces several shortfalls beyond the $400 million in deferred maintenance, Superintendent Jennifer Collier said. There are staffing shortages at all positions: teachers, paraprofessionals and support staff. As in much of the U.S., the cost of housing is surging. New developments that are being built do not include affordable housing, or when they do, the units are still out of reach for teachers.
That’s making it harder for a district that already loses about 1 in 5 of its teachers each year to keep or recruit new ones, who earn an average of only $46,150 their first year on the job, Collier said.
East Baton Rouge and the industrial corridor
It’s impossible to miss the tanks, towers, pipes and industrial structures that incongruously line Baton Rouge’s Scenic Highway landscape. They’re part of Exxon Mobil Corp.’s campus, home of the oil giant’s refinery in addition to chemical and plastics plants.

Sitting along the Mississippi River, the campus has been a staple of Louisiana’s capital for over 100 years. It’s where 6,000 employees and contractors who collectively earn over $400 million annually produce 522,000 barrels of crude oil per day when at full capacity, as well as the annual production and manufacture of 3 billion pounds of high-density polyethylene and polypropylene and 6.6 billion pounds of petrochemical products. The company posted a record-breaking $55.7 billion in profits in 2022 and $36 billion in 2023.
Across the street are empty fields and roads leading into neighborhoods that have been designated by the U.S. Department of Agriculture as a low-income food desert. A mile drive down the street to Route 67 is a Dollar General, fast-food restaurants, and tiny, rundown food stores. A Hi Nabor Supermarket is 4 miles away.
East Baton Rouge Parish’s McKinley High School, a 12-minute drive from the refinery, serves a student body that is about 80% Black and 85% poor. The school, which boasts famous alums such as rapper Kevin Gates, former NBA player Tyrus Thomas and Presidential Medal of Freedom recipient Gardner C. Taylor, holds a special place in the community, but it has been beset by violence and tragedy lately. Its football team quarterback, who was killed days before graduation in 2017, was among at least four of McKinley’s students who have been shot or murdered over the past six years.
The experience is starkly different at some of the district’s more advantaged schools, including its magnet programs open to high-performing students.

Baton Rouge is a tale of two cities, with some of the worst outcomes in the state for education, income and mortality, and some of the best outcomes. “It was only separated by sometimes a few blocks,” said Edgar Cage, the lead organizer for the advocacy group Together Baton Rouge. Cage, who grew up in the city when it was segregated by Jim Crow laws, said the root cause of that disparity was racism.
“Underserved kids don’t have a path forward” in East Baton Rouge public schools, Cage said.
A 2019 report from the Urban League of Louisiana found that economically disadvantaged African American and Hispanic students are not provided equitable access to high-quality education opportunities. That has contributed to those students underperforming on standardized state assessments, such as the LEAP exam, being unprepared to advance to higher grades and being excluded from high-quality curricula and instruction, as well as the highest-performing schools and magnet schools.
“Baton Rouge is home to some of the highest performing schools in the state,” according to the report. “Yet the highest performing schools and schools that have selective admissions policies often exclude disadvantaged students and African American and Hispanic students.”
Dawn Collins, who served on the district’s school board from 2016 to 2022, said that with more funding, the district could provide more targeted interventions for students who were struggling academically or additional support to staff so they can better assist students with greater needs.
But for decades, Louisiana’s Industrial Ad Valorem Tax Exemption Program, or ITEP, allowed for 100% property tax exemptions for industrial manufacturing facilities, said Erin Hansen, the statewide policy analyst at Together Louisiana, a network of 250 religious and civic organizations across the state that advocates for grassroots issues, including tax fairness.
The ITEP program was created in the 1930s through a state constitutional amendment, allowing companies to bypass a public vote and get approval for the exemption through the governor-appointed Board of Commerce and Industry, Hansen said. For over 80 years, that board approved nearly all applications that it received, she said.
Since 2000, Louisiana has granted a total of $35 billion in corporate property tax breaks for 12,590 projects.
Louisiana’s executive order
A few efforts to reform the program over the years have largely failed. But in 2016, Gov. John Bel Edwards signed an executive order that slightly but importantly tweaked the system. On top of the state board vote, the order gave local taxing bodies – such as school boards, sheriffs and parish or city councils – the ability to vote on their own individual portions of the tax exemptions. And in 2019 the East Baton Rouge Parish School Board exercised its power to vote down an abatement.
Throughout the U.S., school boards’ power over the tax abatements that affect their budgets vary, and in some states, including Georgia, Kansas, Nevada, New Jersey and South Carolina, school boards lack any formal ability to vote or comment on tax abatement deals that affect them.
Edwards’ executive order also capped the maximum exemption at 80% and tightened the rules so routine capital investments and maintenance were no longer eligible, Hansen said. A requirement concerning job creation was also put in place.
Concerned residents and activists, led by Together Louisiana and sister group Together Baton Rouge, rallied around the new rules and pushed back against the billion-dollar corporation taking more tax money from the schools. In 2019, the campaign worked: the school board rejected a $2.9 million property tax break bid by Exxon Mobil.
After the decision, Exxon Mobil reportedly described the city as “unpredictable.”
However, members of the business community have continued to lobby for the tax breaks, and they have pushed back against further rejections. In fact, according to Hansen, loopholes were created during the rulemaking process around the governor’s executive order that allowed companies to weaken its effectiveness.
In total, 223 Exxon Mobil projects worth nearly $580 million in tax abatements have been granted in the state of Louisiana under the ITEP program since 2000.
“ITEP is needed to compete with other states – and, in ExxonMobil’s case, other countries,” according to Exxon Mobil spokesperson Lauren Kight.
She pointed out that Exxon Mobil is the largest property taxpayer for the EBR school system, paying more than $46 million in property taxes in EBR parish in 2022 and another $34 million in sales taxes.
A new ITEP contract won’t decrease this existing tax revenue, Kight added. “Losing out on future projects absolutely will.”
The East Baton Rouge Parish School Board has continued to approve Exxon Mobil abatements, passing $46.9 million between 2020 and 2022. Between 2017 and 2023, the school district has lost $96.3 million.
Taxes are highest when industrial buildings are first built. Industrial property comes onto the tax rolls at 40% to 50% of its original value in Louisiana after the initial 10-year exemption, according to the Ascension Economic Development Corp.
Exxon Mobil received its latest tax exemption, $8.6 million over 10 years – an 80% break – in October 2023 for $250 million to install facilities at the Baton Rouge complex that purify isopropyl alcohol for microchip production and that create a new advanced recycling facility, allowing the company to address plastic waste. The project created zero new jobs.
The school board approved it by a 7-2 vote after a long and occasionally contentious board meeting.
“Does it make sense for Louisiana and other economically disadvantaged states to kind of compete with each other by providing tax incentives to mega corporations like Exxon Mobil?” said EBR School Board Vice President Patrick Martin, who voted for the abatement. “Probably, in a macro sense, it does not make a lot of sense. But it is the program that we have.”
Obviously, Exxon Mobil benefits, he said. “The company gets a benefit in reducing the property taxes that they would otherwise pay on their industrial activity that adds value to that property.” But the community benefits from the 20% of the property taxes that are not exempted, he said.
“I believe if we don’t pass it, over time the investments will not come and our district as a whole will have less money,” he added.
Meanwhile, the district’s budgetary woes are coming to a head. Bus drivers staged a sickout at the start of the school year, refusing to pick up students – in protest of low pay and not having buses equipped with air conditioning amid a heat wave. The district was forced to release students early, leaving kids stranded without a ride to school, before it acquiesced and provided the drivers and other staff one-time stipends and purchased new buses with air conditioning.
The district also agreed to reestablish transfer points as a temporary response to the shortages. But that transfer-point plan has historically resulted in students riding on the bus for hours and occasionally missing breakfast when the bus arrives late, according to Angela Reams-Brown, president of the East Baton Rouge Federation of Teachers. The district plans to purchase or lease over 160 buses and solve its bus driver shortage next year, but the plan could lead to a budget crisis.
A teacher shortage looms as well, because the district is paying teachers below the regional average. At the school board meeting, Laverne Simoneaux, an ELL specialist at East Baton Rouge’s Woodlawn Elementary, said she was informed that her job was not guaranteed next year since she’s being paid through federal COVID-19 relief funds. By receiving tax exemptions, Exxon Mobil was taking money from her salary to deepen their pockets, she said.
A young student in the district told the school board that the money could provide better internet access or be used to hire someone to pick up the glass and barbed wire in the playground. But at least they have a playground – Hayden Crockett, a seventh grader at Sherwood Middle Academic Magnet School, noted that his sister’s elementary school lacked one.
“If it wasn’t in the budget to fund playground equipment, how can it also be in the budget to give one of the most powerful corporations in the world a tax break?” Crockett said. “The math just ain’t mathing.”
Christine Wen worked for the nonprofit organization Good Jobs First from June 2019 to May 2022 where she helped collect tax abatement data.
Nathan Jensen has received funding from the John and Laura Arnold Foundation, the Smith Richardson Foundation, the Ewing Marion Kauffman Foundation and the Washington Center for Equitable Growth. He is a Senior Fellow at the Niskanen Center.
Danielle McLean and Kevin Welner do not work for, consult, own shares in or receive funding from any company or organization that would benefit from this article, and have disclosed no relevant affiliations beyond their academic appointment.
subsidies pandemic covid-19 governor mortality oil

Catastrophic Risk: Investing and Business Implications


Redefining Poverty: Towards a Transpartisan Approach


Dropping Like a Stone: ON RRP Take‑up in the Second Half of 2023


Where Is R‑Star and the End of the Refi Boom: The Top 5 Posts of 2023


Students lose out as cities and states give billions in property tax breaks to businesses − draining school budgets and especially hurting the poorest students


Revving up tourism: Formula One and other big events look set to drive growth in the hospitality industry


Another beloved brewery files Chapter 11 bankruptcy
-

 Uncategorized2 weeks ago
All Of The Elements Are In Place For An Economic Crisis Of Staggering Proportions
-

 Uncategorized1 month ago
Cathie Wood sells a major tech stock (again)
-

 Uncategorized3 weeks ago
California Counties Could Be Forced To Pay $300 Million To Cover COVID-Era Program
-

 Uncategorized2 weeks ago
Apparel Retailer Express Moving Toward Bankruptcy
-

 Uncategorized3 weeks ago
Industrial Production Decreased 0.1% in January
-

 International1 day ago
Walmart launches clever answer to Target’s new membership program
-

 Uncategorized3 weeks ago
RFK Jr: The Wuhan Cover-Up & The Rise Of The Biowarfare-Industrial Complex
-

 Uncategorized3 weeks ago
GOP Efforts To Shore Up Election Security In Swing States Face Challenges