Government
Business is booming: Husband-and-wife ed-tech startup Boom Learning takes off during pandemic
It’s been a rocky road for education the past couple years as schools, teachers, students and parents all navigate the COVID-19 pandemic and the challenges it has created. Kirkland, Wash.-based Boom Learning was around before coronavirus and remote…
Share this:


It’s been a rocky road for education the past couple years as schools, teachers, students and parents all navigate the COVID-19 pandemic and the challenges it has created.
Kirkland, Wash.-based Boom Learning was around before coronavirus and remote learning, and while the startup’s digital tools are not remote-specific, the company has seen tremendous growth in the use of its Boom Cards since 2020.
Husband-and-wife team Eric and Mary Oemig started Boom Learning in 2015, but the desire to do something around education and ed-tech started much earlier.
“Our parents were both educators. We both thought we should be educators, too, but the economics sometimes don’t work out so well for teachers,” Eric Oemig said. “So we’ve taken a circuitous path there.”
Eric Oemig is a former Washington state senator who represented the 45th district from 2007 to 2011. During his time in the Senate, he was vice chairman of the Education Committee, served on the Quality Education Council and helped pass education reform in the state in 2009. Prior to joining the Senate, he spent nine years at Microsoft.
Mary Oemig attended the University of Idaho to become a teacher and has “half a masters’ in education, but she changed course and studied law at the University of California – Berkeley, became an attorney and eventually landed at Microsoft, too.

When her husband headed to Olympia, Wash., to serve in the Senate, Mary Oemig followed and started and ran an education co-op, where she gained a better understanding of ways to improve classroom environments.
“I’d come home and say, ‘There are just no tools out there for individualized learning. It’s so frustrating,'” Mary Oemig said. “There was no technology to take the self-grading burden off.”
She knew from an education theory and design perspective what was needed, but she didn’t have the skills to build it. So she “complained” to her husband.
“And Eric is a tech guy,” Mary Oemig said.
The couple’s first stab at an app was Mathtopia, an award-winning game designed to build math fact fluency.
Boom Learning launched a few years later as a platform and marketplace for teachers. Boom doesn’t create content, teachers do. Tech built by the Oemigs prompts and times kids, records what they’re working on and reports back to teachers.
At a base level, Boom eliminates the need to do printed assignments or grading packets. Using Boom Cards on the company’s iOS or web-based app, students get information in the moment about whether they’ve understood an activity. The Oemigs mention such services as Nearpod and Kahoot! as those with similar ed-tech offerings.

Boom Learning, which has been bootstrapped all along, makes money through various subscription offerings. It offers a Boom Cards starter plan for free, for families with no more than five kids.
The company took that free approach to another level back in March 2020 at the start of the pandemic.
The Oemigs live less than a mile from Life Care Center of Kirkland, a nursing home that was an early epicenter of the coronavirus outbreak in the U.S. From her window, Mary Oemig can see a fire station that was quarantined in those first days of the health crisis.
“We were watching the pandemic unfold right here and going, ‘You know what, this is going to get really big. We should do something,” Mary Oemig said. She told her husband that she wanted to give all Boom memberships for free through the end of that school year.
“I think there was something about being free that was somewhat magical for teachers [who said], ‘My world is burning down, I am freaking out, I’m doing remote learning and here’s this tool,'” Eric Oemig said.
Boom Learning’s revenue grew 32x by the end of 2020 and the company grew from just the Oemigs to a team of almost 20 by the end of the year.
As the Omicron COVID variant surged in Washington state and around the country starting last month, Boom again announced another free offer, which they’ve extended through the end of February as some schools face the possibility of returning to remote learning.
Reflecting back on 10 years ago when he left the state Senate, Eric Oemig remembered thinking about what he’d do after politics. He really cared about kids and education.
“Mary sat with me and said, ‘Think about how you want to make an impact. What are the things we can do?'”
Boom Learning now has close to half a million lessons and activities available in its store. In seven years, they’ve reached some 10 million students and 1.5 million teachers.
senate pandemic coronavirus covid-19 epicenterGovernment
Low Iron Levels In Blood Could Trigger Long COVID: Study
Low Iron Levels In Blood Could Trigger Long COVID: Study
Authored by Amie Dahnke via The Epoch Times (emphasis ours),
People with inadequate…
Share this:


Authored by Amie Dahnke via The Epoch Times (emphasis ours),
People with inadequate iron levels in their blood due to a COVID-19 infection could be at greater risk of long COVID.
A new study indicates that problems with iron levels in the bloodstream likely trigger chronic inflammation and other conditions associated with the post-COVID phenomenon. The findings, published on March 1 in Nature Immunology, could offer new ways to treat or prevent the condition.
Long COVID Patients Have Low Iron Levels
Researchers at the University of Cambridge pinpointed low iron as a potential link to long-COVID symptoms thanks to a study they initiated shortly after the start of the pandemic. They recruited people who tested positive for the virus to provide blood samples for analysis over a year, which allowed the researchers to look for post-infection changes in the blood. The researchers looked at 214 samples and found that 45 percent of patients reported symptoms of long COVID that lasted between three and 10 months.
In analyzing the blood samples, the research team noticed that people experiencing long COVID had low iron levels, contributing to anemia and low red blood cell production, just two weeks after they were diagnosed with COVID-19. This was true for patients regardless of age, sex, or the initial severity of their infection.
According to one of the study co-authors, the removal of iron from the bloodstream is a natural process and defense mechanism of the body.
But it can jeopardize a person’s recovery.
“When the body has an infection, it responds by removing iron from the bloodstream. This protects us from potentially lethal bacteria that capture the iron in the bloodstream and grow rapidly. It’s an evolutionary response that redistributes iron in the body, and the blood plasma becomes an iron desert,” University of Oxford professor Hal Drakesmith said in a press release. “However, if this goes on for a long time, there is less iron for red blood cells, so oxygen is transported less efficiently affecting metabolism and energy production, and for white blood cells, which need iron to work properly. The protective mechanism ends up becoming a problem.”
The research team believes that consistently low iron levels could explain why individuals with long COVID continue to experience fatigue and difficulty exercising. As such, the researchers suggested iron supplementation to help regulate and prevent the often debilitating symptoms associated with long COVID.
“It isn’t necessarily the case that individuals don’t have enough iron in their body, it’s just that it’s trapped in the wrong place,” Aimee Hanson, a postdoctoral researcher at the University of Cambridge who worked on the study, said in the press release. “What we need is a way to remobilize the iron and pull it back into the bloodstream, where it becomes more useful to the red blood cells.”
The research team pointed out that iron supplementation isn’t always straightforward. Achieving the right level of iron varies from person to person. Too much iron can cause stomach issues, ranging from constipation, nausea, and abdominal pain to gastritis and gastric lesions.
1 in 5 Still Affected by Long COVID
COVID-19 has affected nearly 40 percent of Americans, with one in five of those still suffering from symptoms of long COVID, according to the U.S. Centers for Disease Control and Prevention (CDC). Long COVID is marked by health issues that continue at least four weeks after an individual was initially diagnosed with COVID-19. Symptoms can last for days, weeks, months, or years and may include fatigue, cough or chest pain, headache, brain fog, depression or anxiety, digestive issues, and joint or muscle pain.
Government
Walmart joins Costco in sharing key pricing news
The massive retailers have both shared information that some retailers keep very close to the vest.
Share this:

As we head toward a presidential election, the presumed candidates for both parties will look for issues that rally undecided voters.
The economy will be a key issue, with Democrats pointing to job creation and lowering prices while Republicans will cite the layoffs at Big Tech companies, high housing prices, and of course, sticky inflation.
The covid pandemic created a perfect storm for inflation and higher prices. It became harder to get many items because people getting sick slowed down, or even stopped, production at some factories.
Related: Popular mall retailer shuts down abruptly after bankruptcy filing
It was also a period where demand increased while shipping, trucking and delivery systems were all strained or thrown out of whack. The combination led to product shortages and higher prices.
You might have gone to the grocery store and not been able to buy your favorite paper towel brand or find toilet paper at all. That happened partly because of the supply chain and partly due to increased demand, but at the end of the day, it led to higher prices, which some consumers blamed on President Joe Biden's administration.
Biden, of course, was blamed for the price increases, but as inflation has dropped and grocery prices have fallen, few companies have been up front about it. That's probably not a political choice in most cases. Instead, some companies have chosen to lower prices more slowly than they raised them.
However, two major retailers, Walmart (WMT) and Costco, have been very honest about inflation. Walmart Chief Executive Doug McMillon's most recent comments validate what Biden's administration has been saying about the state of the economy. And they contrast with the economic picture being painted by Republicans who support their presumptive nominee, Donald Trump.
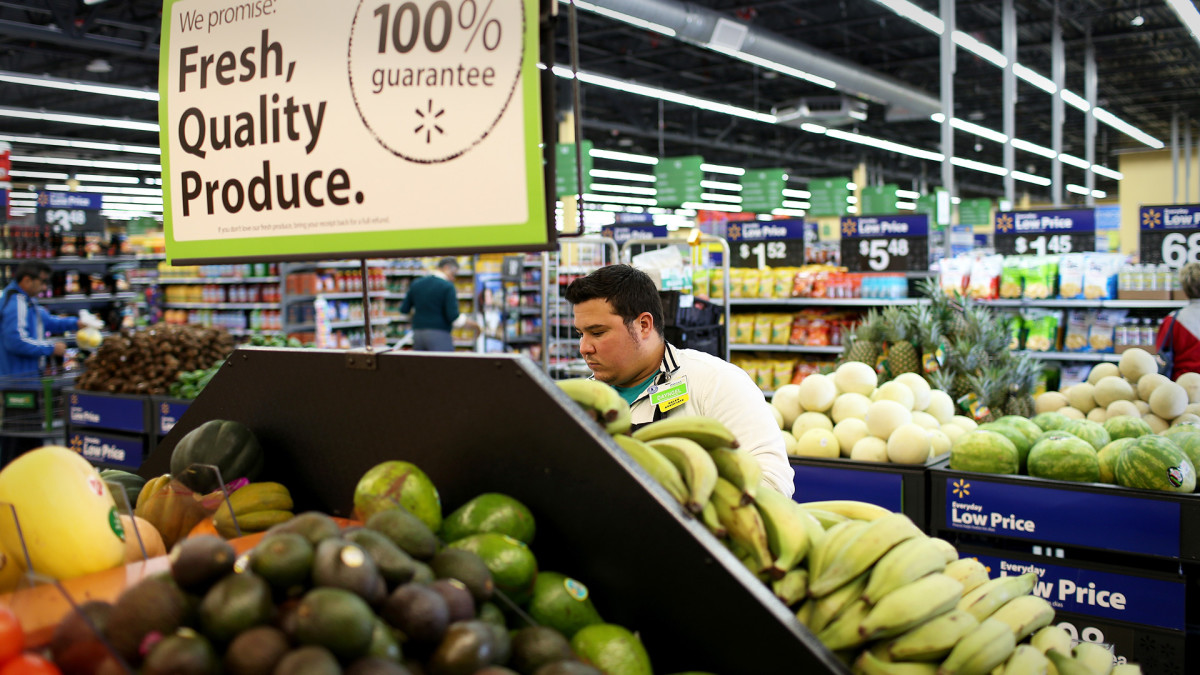
Image source: Joe Raedle/Getty Images
Walmart sees lower prices
McMillon does not talk about lower prices to make a political statement. He's communicating with customers and potential customers through the analysts who cover the company's quarterly-earnings calls.
During Walmart's fiscal-fourth-quarter-earnings call, McMillon was clear that prices are going down.
"I'm excited about the omnichannel net promoter score trends the team is driving. Across countries, we continue to see a customer that's resilient but looking for value. As always, we're working hard to deliver that for them, including through our rollbacks on food pricing in Walmart U.S. Those were up significantly in Q4 versus last year, following a big increase in Q3," he said.
He was specific about where the chain has seen prices go down.
"Our general merchandise prices are lower than a year ago and even two years ago in some categories, which means our customers are finding value in areas like apparel and hard lines," he said. "In food, prices are lower than a year ago in places like eggs, apples, and deli snacks, but higher in other places like asparagus and blackberries."
McMillon said that in other areas prices were still up but have been falling.
"Dry grocery and consumables categories like paper goods and cleaning supplies are up mid-single digits versus last year and high teens versus two years ago. Private-brand penetration is up in many of the countries where we operate, including the United States," he said.
Costco sees almost no inflation impact
McMillon avoided the word inflation in his comments. Costco (COST) Chief Financial Officer Richard Galanti, who steps down on March 15, has been very transparent on the topic.
The CFO commented on inflation during his company's fiscal-first-quarter-earnings call.
"Most recently, in the last fourth-quarter discussion, we had estimated that year-over-year inflation was in the 1% to 2% range. Our estimate for the quarter just ended, that inflation was in the 0% to 1% range," he said.
Galanti made clear that inflation (and even deflation) varied by category.
"A bigger deflation in some big and bulky items like furniture sets due to lower freight costs year over year, as well as on things like domestics, bulky lower-priced items, again, where the freight cost is significant. Some deflationary items were as much as 20% to 30% and, again, mostly freight-related," he added.
bankruptcy pandemic trumpGovernment
Walmart has really good news for shoppers (and Joe Biden)
The giant retailer joins Costco in making a statement that has political overtones, even if that’s not the intent.
Share this:

As we head toward a presidential election, the presumed candidates for both parties will look for issues that rally undecided voters.
The economy will be a key issue, with Democrats pointing to job creation and lowering prices while Republicans will cite the layoffs at Big Tech companies, high housing prices, and of course, sticky inflation.
The covid pandemic created a perfect storm for inflation and higher prices. It became harder to get many items because people getting sick slowed down, or even stopped, production at some factories.
Related: Popular mall retailer shuts down abruptly after bankruptcy filing
It was also a period where demand increased while shipping, trucking and delivery systems were all strained or thrown out of whack. The combination led to product shortages and higher prices.
You might have gone to the grocery store and not been able to buy your favorite paper towel brand or find toilet paper at all. That happened partly because of the supply chain and partly due to increased demand, but at the end of the day, it led to higher prices, which some consumers blamed on President Joe Biden's administration.
Biden, of course, was blamed for the price increases, but as inflation has dropped and grocery prices have fallen, few companies have been up front about it. That's probably not a political choice in most cases. Instead, some companies have chosen to lower prices more slowly than they raised them.
However, two major retailers, Walmart (WMT) and Costco, have been very honest about inflation. Walmart Chief Executive Doug McMillon's most recent comments validate what Biden's administration has been saying about the state of the economy. And they contrast with the economic picture being painted by Republicans who support their presumptive nominee, Donald Trump.
Image source: Joe Raedle/Getty Images
Walmart sees lower prices
McMillon does not talk about lower prices to make a political statement. He's communicating with customers and potential customers through the analysts who cover the company's quarterly-earnings calls.
During Walmart's fiscal-fourth-quarter-earnings call, McMillon was clear that prices are going down.
"I'm excited about the omnichannel net promoter score trends the team is driving. Across countries, we continue to see a customer that's resilient but looking for value. As always, we're working hard to deliver that for them, including through our rollbacks on food pricing in Walmart U.S. Those were up significantly in Q4 versus last year, following a big increase in Q3," he said.
He was specific about where the chain has seen prices go down.
"Our general merchandise prices are lower than a year ago and even two years ago in some categories, which means our customers are finding value in areas like apparel and hard lines," he said. "In food, prices are lower than a year ago in places like eggs, apples, and deli snacks, but higher in other places like asparagus and blackberries."
McMillon said that in other areas prices were still up but have been falling.
"Dry grocery and consumables categories like paper goods and cleaning supplies are up mid-single digits versus last year and high teens versus two years ago. Private-brand penetration is up in many of the countries where we operate, including the United States," he said.
Costco sees almost no inflation impact
McMillon avoided the word inflation in his comments. Costco (COST) Chief Financial Officer Richard Galanti, who steps down on March 15, has been very transparent on the topic.
The CFO commented on inflation during his company's fiscal-first-quarter-earnings call.
"Most recently, in the last fourth-quarter discussion, we had estimated that year-over-year inflation was in the 1% to 2% range. Our estimate for the quarter just ended, that inflation was in the 0% to 1% range," he said.
Galanti made clear that inflation (and even deflation) varied by category.
"A bigger deflation in some big and bulky items like furniture sets due to lower freight costs year over year, as well as on things like domestics, bulky lower-priced items, again, where the freight cost is significant. Some deflationary items were as much as 20% to 30% and, again, mostly freight-related," he added.
bankruptcy pandemic trump

Catastrophic Risk: Investing and Business Implications


When Military Rule Supplants Democracy


Redefining Poverty: Towards a Transpartisan Approach


The Digest #187


Dropping Like a Stone: ON RRP Take‑up in the Second Half of 2023


Where Is R‑Star and the End of the Refi Boom: The Top 5 Posts of 2023


Students lose out as cities and states give billions in property tax breaks to businesses − draining school budgets and especially hurting the poorest students


Revving up tourism: Formula One and other big events look set to drive growth in the hospitality industry


Biden to call for first-time homebuyer tax credit, construction of 2 million homes


GBPINR: Analysis and Projections for 2024
-

 Uncategorized2 weeks ago
All Of The Elements Are In Place For An Economic Crisis Of Staggering Proportions
-

 Uncategorized1 month ago
Cathie Wood sells a major tech stock (again)
-

 Uncategorized3 weeks ago
California Counties Could Be Forced To Pay $300 Million To Cover COVID-Era Program
-

 Uncategorized2 weeks ago
Apparel Retailer Express Moving Toward Bankruptcy
-

 Uncategorized3 weeks ago
Industrial Production Decreased 0.1% in January
-

 International1 day ago
Walmart launches clever answer to Target’s new membership program
-

 Uncategorized3 weeks ago
RFK Jr: The Wuhan Cover-Up & The Rise Of The Biowarfare-Industrial Complex
-

 Uncategorized3 weeks ago
GOP Efforts To Shore Up Election Security In Swing States Face Challenges