Bitcoin and Gold Short-Lived Correlation Not a Sign of Comparability
Bitcoin and Gold Short-Lived Correlation Not a Sign of Comparability
Share this:


Gold–BTC correlation drops 20% one week after hitting all-time high of 68%, correlation metrics are often misleading for investors.
The Bitcoin (BTC) and gold one-month correlation reached a record high of 68% as Bitcoin hit $12,000 early in August, but the correlation crashed by 20% the following week. Despite this, Bitcoin looks set to become digital gold in 2020 considering the price correlations and trends in the futures market.
Both gold and Bitcoin are having a phenomenal year in terms of year-to-date returns. According to Skew Analytics, gold has a 27.93% YTD return, while Bitcoin has racked up a 71.68% YTD yield. Although Bitcoin sees much higher volatility than gold, it seems that in these uncertain, pandemic-stricken times, investors are gravitating toward store-of-value assets such as gold and Bitcoin.
Same but different
Bitcoin and gold are very different assets in the traditional sense, which is mainly due to liquidity, owing to both being in different phases in their asset lifecycle. Gold currently has a market capitalization of about $9 trillion, whereas Bitcoin’s is only $228 billion.
These major differences aside, gold and Bitcoin are largely associated due to two similarities: both assets are “mined” and their scarcity entails an inelastic supply. The latter means that no matter how much the price of the asset increases, supply cannot increase due to production limitations. Commodities with an elastic supply would not be scarce, and thus cannot be considered a store of value. Dan Koehler, liquidity manager at crypto exchange OkCoin told Cointelegraph: “While any asset can have value based on supply and demand, limited availability in gold and BTC give them a unique blueprint as a store of value.”
Even though gold is an asset that is considered to be a store of value, in terms of usage, it has a few applications in the electronics and jewelry industries, and is predominantly used by governments and central banks as a value holder for fiat currency, while Bitcoin is purely used as a store of value for investors.
Koehler also pointed to Bitcoin’s volatility being detrimental to the title of “digital gold” as it looks to become a safety asset: “Bitcoin has fought to hold this title as well, but its periods of high volatility in the past has prevented it from capturing more market share for this title.” Dennis Vinokourov, the head of research at BeQuant — a crypto exchange and institutional brokerage provider — told Cointelegraph that Bitcoin maximalists admire deflationary assets, adding, “Given the safe haven and inflation hedge status that gold holds, it is probably the only other asset that somewhat resembles what Bitcoin native stand for.”
While correlations are often used to compare two assets in the financial markets, Vinokourov further warns investors to focus on Bitcoin’s diversification instead of relying too much on correlation values over various time frames:
“While the 1-month correlation between the two has risen lately all the way to 68%, the much more widely used 3-month measure stands at a mere 15%, while longer duration such as 1-year, the correlation coefficient is even lower. As such, caution is warranted when building investment thesis based on the above metrics and instead, it may be better to focus on Bitcoin’s diversification capabilities instead.”
It is important to note that over longer durations, Bitcoin is largely uncorrelated with all the major assets available to investors. The correlation with traditional assets is usually between 0.5 and -0.5, suggesting that the relationship between their returns is extremely weak.

When looking at correlation figures, it is critical to keep in mind that the two assets ultimately represent separate markets that have different macro and micro economic factors affecting each of them. Koehler furthered this voice of caution by stating:
“It’s important to remember that historical correlation merely looks to show how two markets have moved together or disjointed, but is not an explanation of such movements. [..] News in one asset (a BTC hard fork for example) doesn’t necessarily have any effect on the Gold market and as such BTC volatility around that event may not be reflected nearly as much in the Gold market and correlations may decrease as the asset’s returns deviate.”
For example, the all-time high in Bitcoin and gold correlation was seen at the same time when Microstrategy, the world’s largest business intelligence firm, bought $250 million in Bitcoin, making the asset its primary treasury reserve. This is seen as a major sign of institutional interest. Marie Tatibouet, chief marketing officer of Gate IO — a cryptocurrency based in Virginia — told Cointelegraph that this signals a huge validation, adding:
“During Q1 and Q2, the correlation has been rising, reaching prominent peaks, close to 50% and 60%, since the coronavirus outbreak. In these times of uncertainty during the pandemic, with significant inflation hovering over the world, people are looking for a safe-haven asset.”
Correlation to other markers
In addition to being correlated to gold, Bitcoin is often compared with the Standard & Poor’s 500 Index, the United States dollar and even the VIX volatility index. Yet, in spite of oil being the highest-traded commodity on the market, no correlations can be drawn between West Texas Intermediate and BTC.
This is due to the high supply of oil and it being considered a bountiful, inexpensive resource. This was demonstrated recently during the pandemic, when oil prices dropped to negative and investors were being paid just to store the oil. Tatibouet elaborated on why the S&P 500 is often used as a benchmark for price correlation with Bitcoin:
“The correlation between the coin and the S&P has been more significant throughout the years than between the digital asset and gold. At the same time, gold and BTC seem to have a more parallel relationship, but BTC–S&P 500 interaction happens differently, which moves more cyclically most of the time. When BTC price drops, the correlation with the stock market index grows, and as BTC price bounces back, their correlation diminishes.”
In both long- and short-term correlation metrics, Bitcoin seems to have a higher correlation with the S&P 500 index than gold, with a one-year correlation of 0.36, while gold’s is at 0.08.
Bitcoin perceived as more risky
In comparison to gold, Bitcoin is often perceived to be more risky due to its higher volatility, lesser liquidity and lower levels of adoption by governments and institutions in comparison to gold, which has been one of the most highly commoditized assets in the markets historically. Vinokourov elaborated on Bitcoin’s price volatility in relation to risk:

“Bitcoin’s propensity to undergo parabolic price runs, as well as flash crashes for that matter, is a bigger risk to its perceived notion of being a store of value asset than price volatility. After all, it is said that volatility is an inverse gauge of liquidity. [...] Any asset can be subjected to excessive volatility, it is how market participants, including the liquidity providers react to price discovery vacuums and other risks that ultimately matters.”
Agreeing that gold is historically the more stable asset, Tatibouet elaborated that “when it comes to hedging, BTC is more effective in the short term, especially against the agitated markets.” In addition, she pointed out that “gold’s returns are lower than Bitcoin ones, making the digital gold a lot more attractive despite its risky aspects.”
In the current bull run that has taken Bitcoin into the $12,300 range, several traditional assets and commodities could establish price relationships with Bitcoin. However, investors would need to be wary of macro economic events impacting these correlations.
Uncategorized
February Employment Situation
By Paul Gomme and Peter Rupert The establishment data from the BLS showed a 275,000 increase in payroll employment for February, outpacing the 230,000…
Share this:


By Paul Gomme and Peter Rupert
The establishment data from the BLS showed a 275,000 increase in payroll employment for February, outpacing the 230,000 average over the previous 12 months. The payroll data for January and December were revised down by a total of 167,000. The private sector added 223,000 new jobs, the largest gain since May of last year.

Temporary help services employment continues a steep decline after a sharp post-pandemic rise.


Average hours of work increased from 34.2 to 34.3. The increase, along with the 223,000 private employment increase led to a hefty increase in total hours of 5.6% at an annualized rate, also the largest increase since May of last year.

The establishment report, once again, beat “expectations;” the WSJ survey of economists was 198,000. Other than the downward revisions, mentioned above, another bit of negative news was a smallish increase in wage growth, from $34.52 to $34.57.

The household survey shows that the labor force increased 150,000, a drop in employment of 184,000 and an increase in the number of unemployed persons of 334,000. The labor force participation rate held steady at 62.5, the employment to population ratio decreased from 60.2 to 60.1 and the unemployment rate increased from 3.66 to 3.86. Remember that the unemployment rate is the number of unemployed relative to the labor force (the number employed plus the number unemployed). Consequently, the unemployment rate can go up if the number of unemployed rises holding fixed the labor force, or if the labor force shrinks holding the number unemployed unchanged. An increase in the unemployment rate is not necessarily a bad thing: it may reflect a strong labor market drawing “marginally attached” individuals from outside the labor force. Indeed, there was a 96,000 decline in those workers.


Earlier in the week, the BLS announced JOLTS (Job Openings and Labor Turnover Survey) data for January. There isn’t much to report here as the job openings changed little at 8.9 million, the number of hires and total separations were little changed at 5.7 million and 5.3 million, respectively.

As has been the case for the last couple of years, the number of job openings remains higher than the number of unemployed persons.

Also earlier in the week the BLS announced that productivity increased 3.2% in the 4th quarter with output rising 3.5% and hours of work rising 0.3%.

The bottom line is that the labor market continues its surprisingly (to some) strong performance, once again proving stronger than many had expected. This strength makes it difficult to justify any interest rate cuts soon, particularly given the recent inflation spike.
unemployment pandemic unemploymentSpread & Containment
Another beloved brewery files Chapter 11 bankruptcy
The beer industry has been devastated by covid, changing tastes, and maybe fallout from the Bud Light scandal.
Share this:


Before the covid pandemic, craft beer was having a moment. Most cities had multiple breweries and taprooms with some having so many that people put together the brewery version of a pub crawl.
It was a period where beer snobbery ruled the day and it was not uncommon to hear bar patrons discuss the makeup of the beer the beer they were drinking. This boom period always seemed destined for failure, or at least a retraction as many markets seemed to have more craft breweries than they could support.
Related: Fast-food chain closes more stores after Chapter 11 bankruptcy
The pandemic, however, hastened that downfall. Many of these local and regional craft breweries counted on in-person sales to drive their business.
And while many had local and regional distribution, selling through a third party comes with much lower margins. Direct sales drove their business and the pandemic forced many breweries to shut down their taprooms during the period where social distancing rules were in effect.
During those months the breweries still had rent and employees to pay while little money was coming in. That led to a number of popular beermakers including San Francisco's nationally-known Anchor Brewing as well as many regional favorites including Chicago’s Metropolitan Brewing, New Jersey’s Flying Fish, Denver’s Joyride Brewing, Tampa’s Zydeco Brew Werks, and Cleveland’s Terrestrial Brewing filing bankruptcy.
Some of these brands hope to survive, but others, including Anchor Brewing, fell into Chapter 7 liquidation. Now, another domino has fallen as a popular regional brewery has filed for Chapter 11 bankruptcy protection.
Image source: Shutterstock
Covid is not the only reason for brewery bankruptcies
While covid deserves some of the blame for brewery failures, it's not the only reason why so many have filed for bankruptcy protection. Overall beer sales have fallen driven by younger people embracing non-alcoholic cocktails, and the rise in popularity of non-beer alcoholic offerings,
Beer sales have fallen to their lowest levels since 1999 and some industry analysts
"Sales declined by more than 5% in the first nine months of the year, dragged down not only by the backlash and boycotts against Anheuser-Busch-owned Bud Light but the changing habits of younger drinkers," according to data from Beer Marketer’s Insights published by the New York Post.
Bud Light parent Anheuser Busch InBev (BUD) faced massive boycotts after it partnered with transgender social media influencer Dylan Mulvaney. It was a very small partnership but it led to a right-wing backlash spurred on by Kid Rock, who posted a video on social media where he chastised the company before shooting up cases of Bud Light with an automatic weapon.
Another brewery files Chapter 11 bankruptcy
Gizmo Brew Works, which does business under the name Roth Brewing Company LLC, filed for Chapter 11 bankruptcy protection on March 8. In its filing, the company checked the box that indicates that its debts are less than $7.5 million and it chooses to proceed under Subchapter V of Chapter 11.
"Both small business and subchapter V cases are treated differently than a traditional chapter 11 case primarily due to accelerated deadlines and the speed with which the plan is confirmed," USCourts.gov explained.
Roth Brewing/Gizmo Brew Works shared that it has 50-99 creditors and assets $100,000 and $500,000. The filing noted that the company does expect to have funds available for unsecured creditors.
The popular brewery operates three taprooms and sells its beer to go at those locations.
"Join us at Gizmo Brew Works Craft Brewery and Taprooms located in Raleigh, Durham, and Chapel Hill, North Carolina. Find us for entertainment, live music, food trucks, beer specials, and most importantly, great-tasting craft beer by Gizmo Brew Works," the company shared on its website.
The company estimates that it has between $1 and $10 million in liabilities (a broad range as the bankruptcy form does not provide a space to be more specific).
Gizmo Brew Works/Roth Brewing did not share a reorganization or funding plan in its bankruptcy filing. An email request for comment sent through the company's contact page was not immediately returned.
bankruptcy pandemic social distancing
Government
Walmart joins Costco in sharing key pricing news
The massive retailers have both shared information that some retailers keep very close to the vest.
Share this:

As we head toward a presidential election, the presumed candidates for both parties will look for issues that rally undecided voters.
The economy will be a key issue, with Democrats pointing to job creation and lowering prices while Republicans will cite the layoffs at Big Tech companies, high housing prices, and of course, sticky inflation.
The covid pandemic created a perfect storm for inflation and higher prices. It became harder to get many items because people getting sick slowed down, or even stopped, production at some factories.
Related: Popular mall retailer shuts down abruptly after bankruptcy filing
It was also a period where demand increased while shipping, trucking and delivery systems were all strained or thrown out of whack. The combination led to product shortages and higher prices.
You might have gone to the grocery store and not been able to buy your favorite paper towel brand or find toilet paper at all. That happened partly because of the supply chain and partly due to increased demand, but at the end of the day, it led to higher prices, which some consumers blamed on President Joe Biden's administration.
Biden, of course, was blamed for the price increases, but as inflation has dropped and grocery prices have fallen, few companies have been up front about it. That's probably not a political choice in most cases. Instead, some companies have chosen to lower prices more slowly than they raised them.
However, two major retailers, Walmart (WMT) and Costco, have been very honest about inflation. Walmart Chief Executive Doug McMillon's most recent comments validate what Biden's administration has been saying about the state of the economy. And they contrast with the economic picture being painted by Republicans who support their presumptive nominee, Donald Trump.
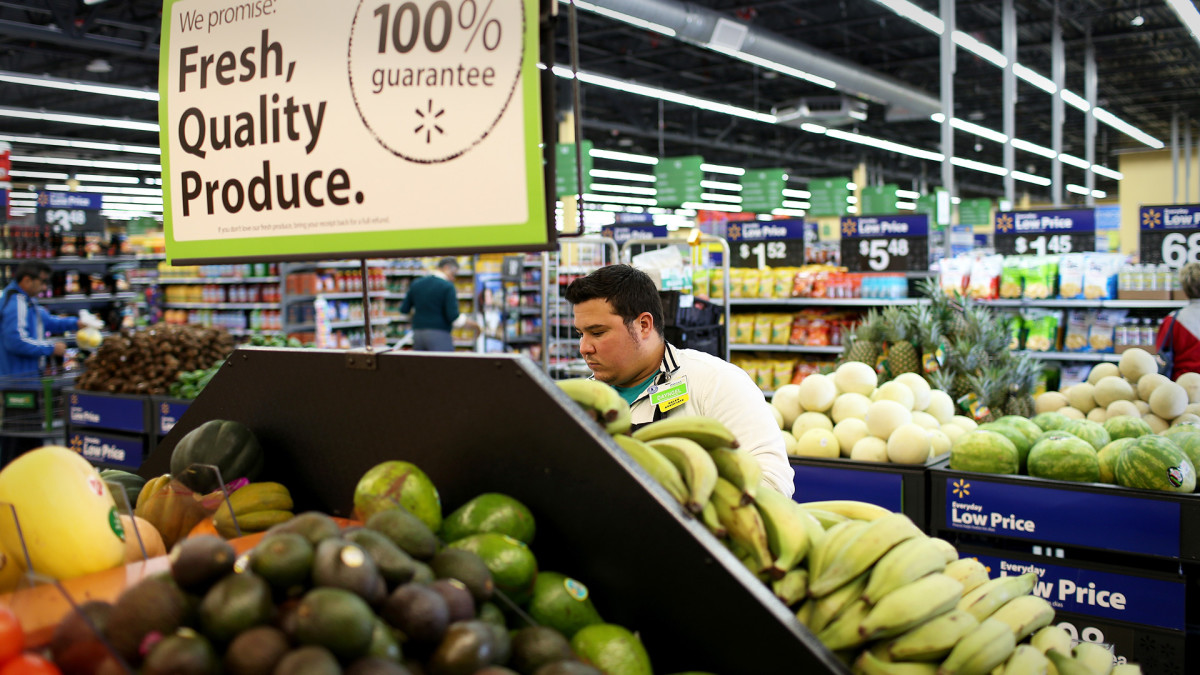
Image source: Joe Raedle/Getty Images
Walmart sees lower prices
McMillon does not talk about lower prices to make a political statement. He's communicating with customers and potential customers through the analysts who cover the company's quarterly-earnings calls.
During Walmart's fiscal-fourth-quarter-earnings call, McMillon was clear that prices are going down.
"I'm excited about the omnichannel net promoter score trends the team is driving. Across countries, we continue to see a customer that's resilient but looking for value. As always, we're working hard to deliver that for them, including through our rollbacks on food pricing in Walmart U.S. Those were up significantly in Q4 versus last year, following a big increase in Q3," he said.
He was specific about where the chain has seen prices go down.
"Our general merchandise prices are lower than a year ago and even two years ago in some categories, which means our customers are finding value in areas like apparel and hard lines," he said. "In food, prices are lower than a year ago in places like eggs, apples, and deli snacks, but higher in other places like asparagus and blackberries."
McMillon said that in other areas prices were still up but have been falling.
"Dry grocery and consumables categories like paper goods and cleaning supplies are up mid-single digits versus last year and high teens versus two years ago. Private-brand penetration is up in many of the countries where we operate, including the United States," he said.
Costco sees almost no inflation impact
McMillon avoided the word inflation in his comments. Costco (COST) Chief Financial Officer Richard Galanti, who steps down on March 15, has been very transparent on the topic.
The CFO commented on inflation during his company's fiscal-first-quarter-earnings call.
"Most recently, in the last fourth-quarter discussion, we had estimated that year-over-year inflation was in the 1% to 2% range. Our estimate for the quarter just ended, that inflation was in the 0% to 1% range," he said.
Galanti made clear that inflation (and even deflation) varied by category.
"A bigger deflation in some big and bulky items like furniture sets due to lower freight costs year over year, as well as on things like domestics, bulky lower-priced items, again, where the freight cost is significant. Some deflationary items were as much as 20% to 30% and, again, mostly freight-related," he added.
bankruptcy pandemic trump

Walmart launches clever answer to Target’s new membership program


EyePoint poaches medical chief from Apellis; Sandoz CFO, longtime BioNTech exec to retire


Wendy’s has a new deal for daylight savings time haters


Watch Live: President Biden Reminds Americans Just How Good They’ve Got It Thanks To Him


Catastrophic Risk: Investing and Business Implications


Racial and Ethnic Wealth Inequality in the Post‑Pandemic Era


Redefining Poverty: Towards a Transpartisan Approach


The Digest #187


When Military Rule Supplants Democracy


Wealth Inequality by Age in the Post‑Pandemic Era
-

 Uncategorized2 weeks ago
All Of The Elements Are In Place For An Economic Crisis Of Staggering Proportions
-

 Uncategorized1 month ago
Cathie Wood sells a major tech stock (again)
-

 Uncategorized3 weeks ago
California Counties Could Be Forced To Pay $300 Million To Cover COVID-Era Program
-

 Uncategorized2 weeks ago
Apparel Retailer Express Moving Toward Bankruptcy
-

 Uncategorized3 weeks ago
Industrial Production Decreased 0.1% in January
-
International1 day ago
Walmart launches clever answer to Target’s new membership program
-

 Uncategorized3 weeks ago
RFK Jr: The Wuhan Cover-Up & The Rise Of The Biowarfare-Industrial Complex
-

 Uncategorized3 weeks ago
GOP Efforts To Shore Up Election Security In Swing States Face Challenges