Biotech: The Featherweight Champion Of The Markets
Biotech: The Featherweight Champion Of The Markets
Share this:

Biotech punches way above its weight-class, and that’s never been more apparent than in this pandemic and the race for a COVID vaccine.
For those of us in biopharma, it feels like it’s a large and dynamic sector populated by an endless number of large and small companies, scientists, business types, pundits, lawyers, accountants, and more. It seems really big at times. And the dozens of daily news stories make it seem even more so: quarterly earnings updates, clinical data releases, FDA decisions, people on chutes and ladders, etc.
But, in reality, the biopharma sector is really quite small relative to rest of the market.
Context is everything, and stepping back from the trees to see the forest is always a healthy thing to do.
Here’s a stat that sums up the relative scale of biopharma: The top 3 Tech companies have a greater combined market capitalization than all of the biotech and pharma universe combined (>$3.5T), including near ~1K publicly-traded companies.
That’s right – just three companies, Microsoft, Apple, and Amazon – are collectively bigger in market cap than the combined valuations of J&J, Pfizer and all of the other biopharma companies down to the most recent IPO and micro-cap stock. And there are dozens of other huge tech players, from Alphabet to Facebook to Intel and others, behind these three. Our sector is simply dwarfed by their size.
Another scale comparison for perspective is around their balance sheets: we think the cash positions in Big BioPharma are huge when we talk about Gilead’s $20B+ or AbbVie’s $30B+, but the Google, Apple, and Microsoft above have a combined cash positions that could fund all of the R&D in the entire biopharma industry for almost two full years, north of ~$350B. That’s a staggering amount of cash.
Why is any of this context important? Why is understanding the scale of biopharma relevant?
It’s important in order to appreciate that even minor changes in the sector’s attractiveness relative to other sectors in the economy can dramatically impact the robustness of the equity markets in biopharma, especially for the emerging players. Further, the 600+ players in the pre-commercial small and mid-cap biopharma universe, the space we often call “biotech”, are almost exclusively reliant on fund flows from the broader equity capital markets for their survival.
Here are a few observations about how biopharma, and the Life Sciences (LS) sector more generally, fits into the broader financial world, courtesy of data from Cowen & Company.
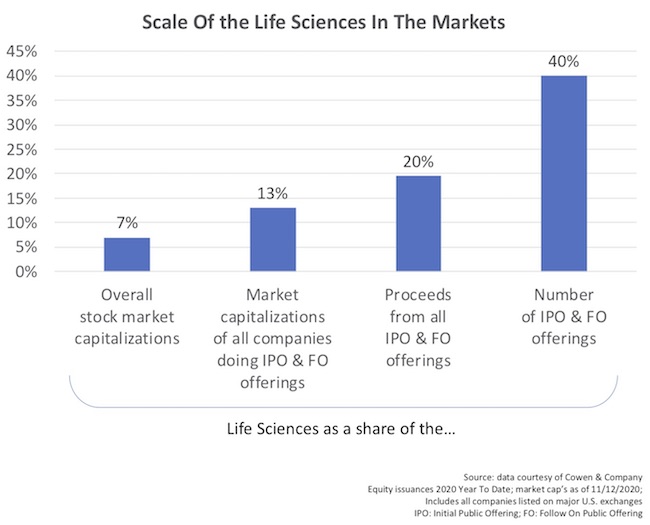
Biopharma is relatively small share of the overall US equity capital markets. The stock exchanges in the US represent close to $49 trillion in collective market capitalization. All of the biopharma represents 7% of the market, which includes the largest players in our industry. Biotech, as a subset and inclusive of the “Big Biotech” firms, reflects just 2.7%.
Biopharma goes way above its weight-class in the new equity issuance market. Because the life sciences are largely a cash-raising, loss-making, equity-burning sector, it is a much larger percentage of the new equity issuance market. For all of the IPOs and Follow On public offerings on the US stock exchanges, life sciences represent 13% of the aggregate market valuations of these issuing companies, 20% of all the proceeds from these offerings, and 40% of the number of offerings.

Biotech, and life sciences in general, have been growing in its share of the equity issuance markets. In recent years, biotech has been booming. As described earlier this year, we’ve witnessed a tsunami of funding flows into the sector. While other sectors have also experienced the exuberance of market appreciation, biotech’s buoyancy has exceeded most others. The IPO markets in particular have evolved in a much more favorable way for biopharma in recent years, especially since the JOBS Act in 2012.
Funding flows into biopharma companies from Life Science venture capital, IPOs, and FOPOs have therefore all edged up in terms of “market share” vs other sectors in each category. Larger rounds than in the past, and more of them, have driven this increased share. As the chart below shows, in aggregate, the LS sector has moved from 10% to nearly 20% of all of these aggregate funding flows.

The increasing role of biopharma in the new issuance market has increased the numbers of publicly-traded LS companies. As I wrote in a 2011 blog post, “Our Shrinking Biopharma Ecosystem”, the number of publicly-traded biotechs in the US had dropped by over 25% from 2005 through 2011. This changed dramatically as the IPO markets opened up from 2012 to 2016, increasing by 50%, as described here in “The Incredible Expanding Universe of Biotech Stocks”. And it has only gotten larger in the past few years.
As evidence of this, biopharma has been increasing in both its share of the companies and the value-weighting in the Russell 2000 index. The Russell 2000 is the most well known index for small and mid-cap companies in the US stock market. Since 2014, both the number and valuation of the biopharma sector in the index have gone up over 60%. Biopharma is now the largest sub-sector in the Russell 2000.

While all these data points are intuitive, and likely not surprising, to those familiar with the capital markets, there are a few implications.
Small numbers, outsized impacts. Biotech is very sensitive to small changes in macro sector allocations. Whether the risk-on or risk-off sentiment is prevalent, or if broader sector rotations by asset managers are in place (including growth vs value investing), the reality is very small aggregate changes in how investors allocate the nearly $50 Trillion in equity value in the US markets can have big impacts on biotech. As an example, if asset managers moved just 0.1% towards the life sciences, that would be $50B in value – more than all of the new public equity issuances in biopharma in 2020, a boom year for offerings. Changes to how we reward R&D and innovation in society can easily impact sentiment and these macro allocations.
Bigger food attracts bigger fish. As Biotech has gotten bigger within the new issuance market, it’s become meaningful for larger equity managers. These big fish can’t waste their time eating small bait. In the past, it’s been hard for the biggest asset managers to participate actively in biotech IPOs or FOPOs if they are only getting a small piece of a $50-60M offering. Today, the median offerings are much larger (4-fold higher), which has created “space” for bigger players to participate. This is a feed-forward phenomenon that has provided positive tailwinds in demand for the sector’s new issuance markets, and it’s evolution was described here.
Getting into the indices matters. As more biotech companies enter the Russell 2000, that means more market ETFs will include them, and more managers will need to allocate to them – driving further demand for biotech stocks. With more asset managers who benchmark, and get paid off of performance versus these indices, this brings incremental and generalist buyers into these stocks. It also raises the awareness of young biotechs that get included in the index. This also creates more underlying demand for biotech equity in the markets.
The post Biotech: The Featherweight Champion Of The Markets appeared first on LifeSciVC.
Uncategorized
Mortgage rates fall as labor market normalizes
Jobless claims show an expanding economy. We will only be in a recession once jobless claims exceed 323,000 on a four-week moving average.
Share this:


Everyone was waiting to see if this week’s jobs report would send mortgage rates higher, which is what happened last month. Instead, the 10-year yield had a muted response after the headline number beat estimates, but we have negative job revisions from previous months. The Federal Reserve’s fear of wage growth spiraling out of control hasn’t materialized for over two years now and the unemployment rate ticked up to 3.9%. For now, we can say the labor market isn’t tight anymore, but it’s also not breaking.
The key labor data line in this expansion is the weekly jobless claims report. Jobless claims show an expanding economy that has not lost jobs yet. We will only be in a recession once jobless claims exceed 323,000 on a four-week moving average.
From the Fed: In the week ended March 2, initial claims for unemployment insurance benefits were flat, at 217,000. The four-week moving average declined slightly by 750, to 212,250
Below is an explanation of how we got here with the labor market, which all started during COVID-19.
1. I wrote the COVID-19 recovery model on April 7, 2020, and retired it on Dec. 9, 2020. By that time, the upfront recovery phase was done, and I needed to model out when we would get the jobs lost back.
2. Early in the labor market recovery, when we saw weaker job reports, I doubled and tripled down on my assertion that job openings would get to 10 million in this recovery. Job openings rose as high as to 12 million and are currently over 9 million. Even with the massive miss on a job report in May 2021, I didn’t waver.
Currently, the jobs openings, quit percentage and hires data are below pre-COVID-19 levels, which means the labor market isn’t as tight as it once was, and this is why the employment cost index has been slowing data to move along the quits percentage.

3. I wrote that we should get back all the jobs lost to COVID-19 by September of 2022. At the time this would be a speedy labor market recovery, and it happened on schedule, too
Total employment data
4. This is the key one for right now: If COVID-19 hadn’t happened, we would have between 157 million and 159 million jobs today, which would have been in line with the job growth rate in February 2020. Today, we are at 157,808,000. This is important because job growth should be cooling down now. We are more in line with where the labor market should be when averaging 140K-165K monthly. So for now, the fact that we aren’t trending between 140K-165K means we still have a bit more recovery kick left before we get down to those levels.

From BLS: Total nonfarm payroll employment rose by 275,000 in February, and the unemployment rate increased to 3.9 percent, the U.S. Bureau of Labor Statistics reported today. Job gains occurred in health care, in government, in food services and drinking places, in social assistance, and in transportation and warehousing.
Here are the jobs that were created and lost in the previous month:

In this jobs report, the unemployment rate for education levels looks like this:
- Less than a high school diploma: 6.1%
- High school graduate and no college: 4.2%
- Some college or associate degree: 3.1%
- Bachelor’s degree or higher: 2.2%

Today’s report has continued the trend of the labor data beating my expectations, only because I am looking for the jobs data to slow down to a level of 140K-165K, which hasn’t happened yet. I wouldn’t categorize the labor market as being tight anymore because of the quits ratio and the hires data in the job openings report. This also shows itself in the employment cost index as well. These are key data lines for the Fed and the reason we are going to see three rate cuts this year.
recession unemployment covid-19 fed federal reserve mortgage rates recession recovery unemploymentUncategorized
Inside The Most Ridiculous Jobs Report In History: Record 1.2 Million Immigrant Jobs Added In One Month
Inside The Most Ridiculous Jobs Report In History: Record 1.2 Million Immigrant Jobs Added In One Month
Last month we though that the January…
Share this:


Last month we though that the January jobs report was the "most ridiculous in recent history" but, boy, were we wrong because this morning the Biden department of goalseeked propaganda (aka BLS) published the February jobs report, and holy crap was that something else. Even Goebbels would blush.
What happened? Let's take a closer look.
On the surface, it was (almost) another blockbuster jobs report, certainly one which nobody expected, or rather just one bank out of 76 expected. Starting at the top, the BLS reported that in February the US unexpectedly added 275K jobs, with just one research analyst (from Dai-Ichi Research) expecting a higher number.
Some context: after last month's record 4-sigma beat, today's print was "only" 3 sigma higher than estimates. Needless to say, two multiple sigma beats in a row used to only happen in the USSR... and now in the US, apparently.

Before we go any further, a quick note on what last month we said was "the most ridiculous jobs report in recent history": it appears the BLS read our comments and decided to stop beclowing itself. It did that by slashing last month's ridiculous print by over a third, and revising what was originally reported as a massive 353K beat to just 229K, a 124K revision, which was the biggest one-month negative revision in two years!

Of course, that does not mean that this month's jobs print won't be revised lower: it will be, and not just that month but every other month until the November election because that's the only tool left in the Biden admin's box: pretend the economic and jobs are strong, then revise them sharply lower the next month, something we pointed out first last summer and which has not failed to disappoint once.
In the past month the Biden department of goalseeking stuff higher before revising it lower, has revised the following data sharply lower:
— zerohedge (@zerohedge) August 30, 2023
- Jobs
- JOLTS
- New Home sales
- Housing Starts and Permits
- Industrial Production
- PCE and core PCE
To be fair, not every aspect of the jobs report was stellar (after all, the BLS had to give it some vague credibility). Take the unemployment rate, after flatlining between 3.4% and 3.8% for two years - and thus denying expectations from Sahm's Rule that a recession may have already started - in February the unemployment rate unexpectedly jumped to 3.9%, the highest since February 2022 (with Black unemployment spiking by 0.3% to 5.6%, an indicator which the Biden admin will quickly slam as widespread economic racism or something).

And then there were average hourly earnings, which after surging 0.6% MoM in January (since revised to 0.5%) and spooking markets that wage growth is so hot, the Fed will have no choice but to delay cuts, in February the number tumbled to just 0.1%, the lowest in two years...

... for one simple reason: last month's average wage surge had nothing to do with actual wages, and everything to do with the BLS estimate of hours worked (which is the denominator in the average wage calculation) which last month tumbled to just 34.1 (we were led to believe) the lowest since the covid pandemic...

... but has since been revised higher while the February print rose even more, to 34.3, hence why the latest average wage data was once again a product not of wages going up, but of how long Americans worked in any weekly period, in this case higher from 34.1 to 34.3, an increase which has a major impact on the average calculation.

While the above data points were examples of some latent weakness in the latest report, perhaps meant to give it a sheen of veracity, it was everything else in the report that was a problem starting with the BLS's latest choice of seasonal adjustments (after last month's wholesale revision), which have gone from merely laughable to full clownshow, as the following comparison between the monthly change in BLS and ADP payrolls shows. The trend is clear: the Biden admin numbers are now clearly rising even as the impartial ADP (which directly logs employment numbers at the company level and is far more accurate), shows an accelerating slowdown.

But it's more than just the Biden admin hanging its "success" on seasonal adjustments: when one digs deeper inside the jobs report, all sorts of ugly things emerge... such as the growing unprecedented divergence between the Establishment (payrolls) survey and much more accurate Household (actual employment) survey. To wit, while in January the BLS claims 275K payrolls were added, the Household survey found that the number of actually employed workers dropped for the third straight month (and 4 in the past 5), this time by 184K (from 161.152K to 160.968K).

This means that while the Payrolls series hits new all time highs every month since December 2020 (when according to the BLS the US had its last month of payrolls losses), the level of Employment has not budged in the past year. Worse, as shown in the chart below, such a gaping divergence has opened between the two series in the past 4 years, that the number of Employed workers would need to soar by 9 million (!) to catch up to what Payrolls claims is the employment situation.

There's more: shifting from a quantitative to a qualitative assessment, reveals just how ugly the composition of "new jobs" has been. Consider this: the BLS reports that in February 2024, the US had 132.9 million full-time jobs and 27.9 million part-time jobs. Well, that's great... until you look back one year and find that in February 2023 the US had 133.2 million full-time jobs, or more than it does one year later! And yes, all the job growth since then has been in part-time jobs, which have increased by 921K since February 2023 (from 27.020 million to 27.941 million).

Here is a summary of the labor composition in the past year: all the new jobs have been part-time jobs!

But wait there's even more, because now that the primary season is over and we enter the heart of election season and political talking points will be thrown around left and right, especially in the context of the immigration crisis created intentionally by the Biden administration which is hoping to import millions of new Democratic voters (maybe the US can hold the presidential election in Honduras or Guatemala, after all it is their citizens that will be illegally casting the key votes in November), what we find is that in February, the number of native-born workers tumbled again, sliding by a massive 560K to just 129.807 million. Add to this the December data, and we get a near-record 2.4 million plunge in native-born workers in just the past 3 months (only the covid crash was worse)!

The offset? A record 1.2 million foreign-born (read immigrants, both legal and illegal but mostly illegal) workers added in February!

Said otherwise, not only has all job creation in the past 6 years has been exclusively for foreign-born workers...

... but there has been zero job-creation for native born workers since June 2018!

This is a huge issue - especially at a time of an illegal alien flood at the southwest border...

... and is about to become a huge political scandal, because once the inevitable recession finally hits, there will be millions of furious unemployed Americans demanding a more accurate explanation for what happened - i.e., the illegal immigration floodgates that were opened by the Biden admin.
Which is also why Biden's handlers will do everything in their power to insure there is no official recession before November... and why after the election is over, all economic hell will finally break loose. Until then, however, expect the jobs numbers to get even more ridiculous.
International
Angry Shouting Aside, Here’s What Biden Is Running On
Angry Shouting Aside, Here’s What Biden Is Running On
Last night, Joe Biden gave an extremely dark, threatening, angry State of the Union…
Share this:


Last night, Joe Biden gave an extremely dark, threatening, angry State of the Union address - in which he insisted that the American economy is doing better than ever, blamed inflation on 'corporate greed,' and warned that Donald Trump poses an existential threat to the republic.
But in between the angry rhetoric, he also laid out his 2024 election platform - for which additional details will be released on March 11, when the White House sends its proposed budget to Congress.
To that end, Goldman Sachs' Alec Phillips and Tim Krupa have summarized the key points:
Taxes
While railing against billionaires (nothing new there), Biden repeated the claim that anyone making under $400,000 per year won't see an increase in their taxes. He also proposed a 21% corporate minimum tax, up from 15% on book income outlined in the Inflation Reduction Act (IRA), as well as raising the corporate tax rate from 21% to 28% (which would promptly be passed along to consumers in the form of more inflation). Goldman notes that "Congress is unlikely to consider any of these proposals this year, they would only come into play in a second Biden term, if Democrats also won House and Senate majorities."
Biden once again tells the complete lie that "nobody earning less than $400,000/year will pay additional penny in federal taxes."
— RNC Research (@RNCResearch) March 8, 2024
FACT: Biden has *already* raised the tax burden on Americans making as little as $20,000 per year. pic.twitter.com/VrZ1m0rzG3
Biden also called on Congress to restore the pandemic-era child tax credit.
Immigration
Instead of simply passing a slew of border security Executive Orders like the Trump ones he shredded on day one, Biden repeated the lie that Congress 'needs to act' before he can (translation: send money to Ukraine or the US border will continue to be a sieve).
As immigration comes into even greater focus heading into the election, we continue to expect the Administration to tighten policy (e.g., immigration has surged 20pp the last 7 months to first place with 28% in Gallup’s “most important problem” survey). As such, we estimate the foreign-born contribution to monthly labor force growth will moderate from 110k/month in 2023 to around 70-90k/month in 2024. -GS
SEE IT: Biden gets boo-ed while talking about his immigration bill. WATCH pic.twitter.com/O5FmkYx3xM
— Simon Ateba (@simonateba) March 8, 2024
Ukraine
Biden, with House Speaker Mike Johnson doing his best impression of a bobble-head, urged Congress to pass additional assistance for Ukraine based entirely on the premise that Russia 'won't stop' there (and would what, trigger article 5 and WW3 no matter what?), despite the fact that Putin explicitly told Tucker Carlson he has no further ambitions, and in fact seeks a settlement.
‼️ Breaking: Putin wants a negotiated settlement to what’s happening in Ukraine.
— Ed (@EdMagari) February 9, 2024
In a surprising turn of events, Tucker Carlson could be the key to peace, potentially playing a crucial role in ending the current conflict????️ pic.twitter.com/IKN8ajlEUX
As Goldman estimates, "While there is still a clear chance that such a deal could come together, for now there is no clear path forward for Ukraine aid in Congress."
China
Biden, forgetting about all the aggressive tariffs, suggested that Trump had been soft on China, and that he will stand up "against China's unfair economic practices" and "for peace and stability across the Taiwan Strait."
SOTU FACT CHECK:
— Wesley Hunt (@WesleyHuntTX) March 8, 2024
Biden claims we’re in a strong position to take on China.
No president in our lifetime has been WEAKER on China than Biden. pic.twitter.com/Y73JsIzmM3
Healthcare
Lastly, Biden proposed to expand drug price negotiations to 50 additional drugs each year (an increase from 20 outlined in the IRA), which Goldman said would likely require bipartisan support "even if Democrats controlled Congress and the White House," as such policies would likely be ineligible for the budget "reconciliation" process which has been used in previous years to pass the IRA and other major fiscal party when Congressional margins are just too thin.
So there you have it. With no actual accomplishments to speak of, Biden can only attack Trump, lie, and make empty promises.


Walmart launches clever answer to Target’s new membership program


Wendy’s has a new deal for daylight savings time haters


EyePoint poaches medical chief from Apellis; Sandoz CFO, longtime BioNTech exec to retire


Watch Live: President Biden Reminds Americans Just How Good They’ve Got It Thanks To Him


Catastrophic Risk: Investing and Business Implications


Redefining Poverty: Towards a Transpartisan Approach


The Digest #187


Gather ’round the crystal ball: A multi-commodity outlook from PDAC 2024


Watch: President Biden Delivers The “Darkest, Most Un-American Speech Given By A President”


Where Is R‑Star and the End of the Refi Boom: The Top 5 Posts of 2023
-

 Uncategorized2 weeks ago
All Of The Elements Are In Place For An Economic Crisis Of Staggering Proportions
-

 Uncategorized1 month ago
Cathie Wood sells a major tech stock (again)
-

 Uncategorized3 weeks ago
California Counties Could Be Forced To Pay $300 Million To Cover COVID-Era Program
-

 Uncategorized2 weeks ago
Apparel Retailer Express Moving Toward Bankruptcy
-

 Uncategorized3 weeks ago
Industrial Production Decreased 0.1% in January
-
International10 hours ago
Walmart launches clever answer to Target’s new membership program
-

 Uncategorized3 weeks ago
RFK Jr: The Wuhan Cover-Up & The Rise Of The Biowarfare-Industrial Complex
-

 Uncategorized3 weeks ago
GOP Efforts To Shore Up Election Security In Swing States Face Challenges