Uncategorized
Another strong personal income and spending report, but beware the uptick in inflation
– by New Deal democratPersonal income and spending has become one of the two most important monthly reports I follow. This is in large part because…
Share this:

- by New Deal democrat
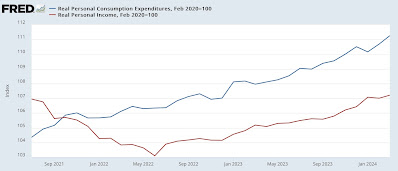
In March, nominally income rose 0.5%, while nominal spending for the second month in a row rose a sharp 0.8%. Prices as measured by the PCE deflator increased 0.3% for the month, meaning that in real terms income increased 0.2% and spending rose 0.5%. Since just before the pandemic real incomes are up 7.2%, and spending is up 11.3%:
On a YoY basis, the PCE price index is up 2.7%, the second monthly increase in a row from January’s three year low of 2.4%. While n the previous 16 months, the YoY measure had been declining at the rate of 0.25%/month, suggesting that it would hit the Fed’s 2.0% target this spring, that trend has stopped:

As I indicated in the intro, for the past 50+ years, real spending on services has generally increased even during recessions. It is real spending on goods which declines. Last month real services spending rose 0.2%, while real goods spending rose a sharp 1.1%:


Uncategorized
Another strong personal income and spending report, but beware the uptick in inflation
– by New Deal democratPersonal income and spending has become one of the two most important monthly reports I follow. This is in large part because…
Share this:


- by New Deal democrat
In March, nominally income rose 0.5%, while nominal spending for the second month in a row rose a sharp 0.8%. Prices as measured by the PCE deflator increased 0.3% for the month, meaning that in real terms income increased 0.2% and spending rose 0.5%. Since just before the pandemic real incomes are up 7.2%, and spending is up 11.3%:

On a YoY basis, the PCE price index is up 2.7%, the second monthly increase in a row from January’s three year low of 2.4%. While n the previous 16 months, the YoY measure had been declining at the rate of 0.25%/month, suggesting that it would hit the Fed’s 2.0% target this spring, that trend has stopped:
As I indicated in the intro, for the past 50+ years, real spending on services has generally increased even during recessions. It is real spending on goods which declines. Last month real services spending rose 0.2%, while real goods spending rose a sharp 1.1%:
Uncategorized
Another strong personal income and spending report, but beware the uptick in inflation
– by New Deal democratPersonal income and spending has become one of the two most important monthly reports I follow. This is in large part because…
Share this:

- by New Deal democrat
In March, nominally income rose 0.5%, while nominal spending for the second month in a row rose a sharp 0.8%. Prices as measured by the PCE deflator increased 0.3% for the month, meaning that in real terms income increased 0.2% and spending rose 0.5%. Since just before the pandemic real incomes are up 7.2%, and spending is up 11.3%:
On a YoY basis, the PCE price index is up 2.7%, the second monthly increase in a row from January’s three year low of 2.4%. While n the previous 16 months, the YoY measure had been declining at the rate of 0.25%/month, suggesting that it would hit the Fed’s 2.0% target this spring, that trend has stopped:
As I indicated in the intro, for the past 50+ years, real spending on services has generally increased even during recessions. It is real spending on goods which declines. Last month real services spending rose 0.2%, while real goods spending rose a sharp 1.1%:
Uncategorized
The Biotech Startup Contraction Continues… And That’s A Good Thing
Venture creation in biotech is witnessing a sustained contraction. After the pandemic bubble’s over-indulgence, the venture ecosystem appears to have…
Share this:


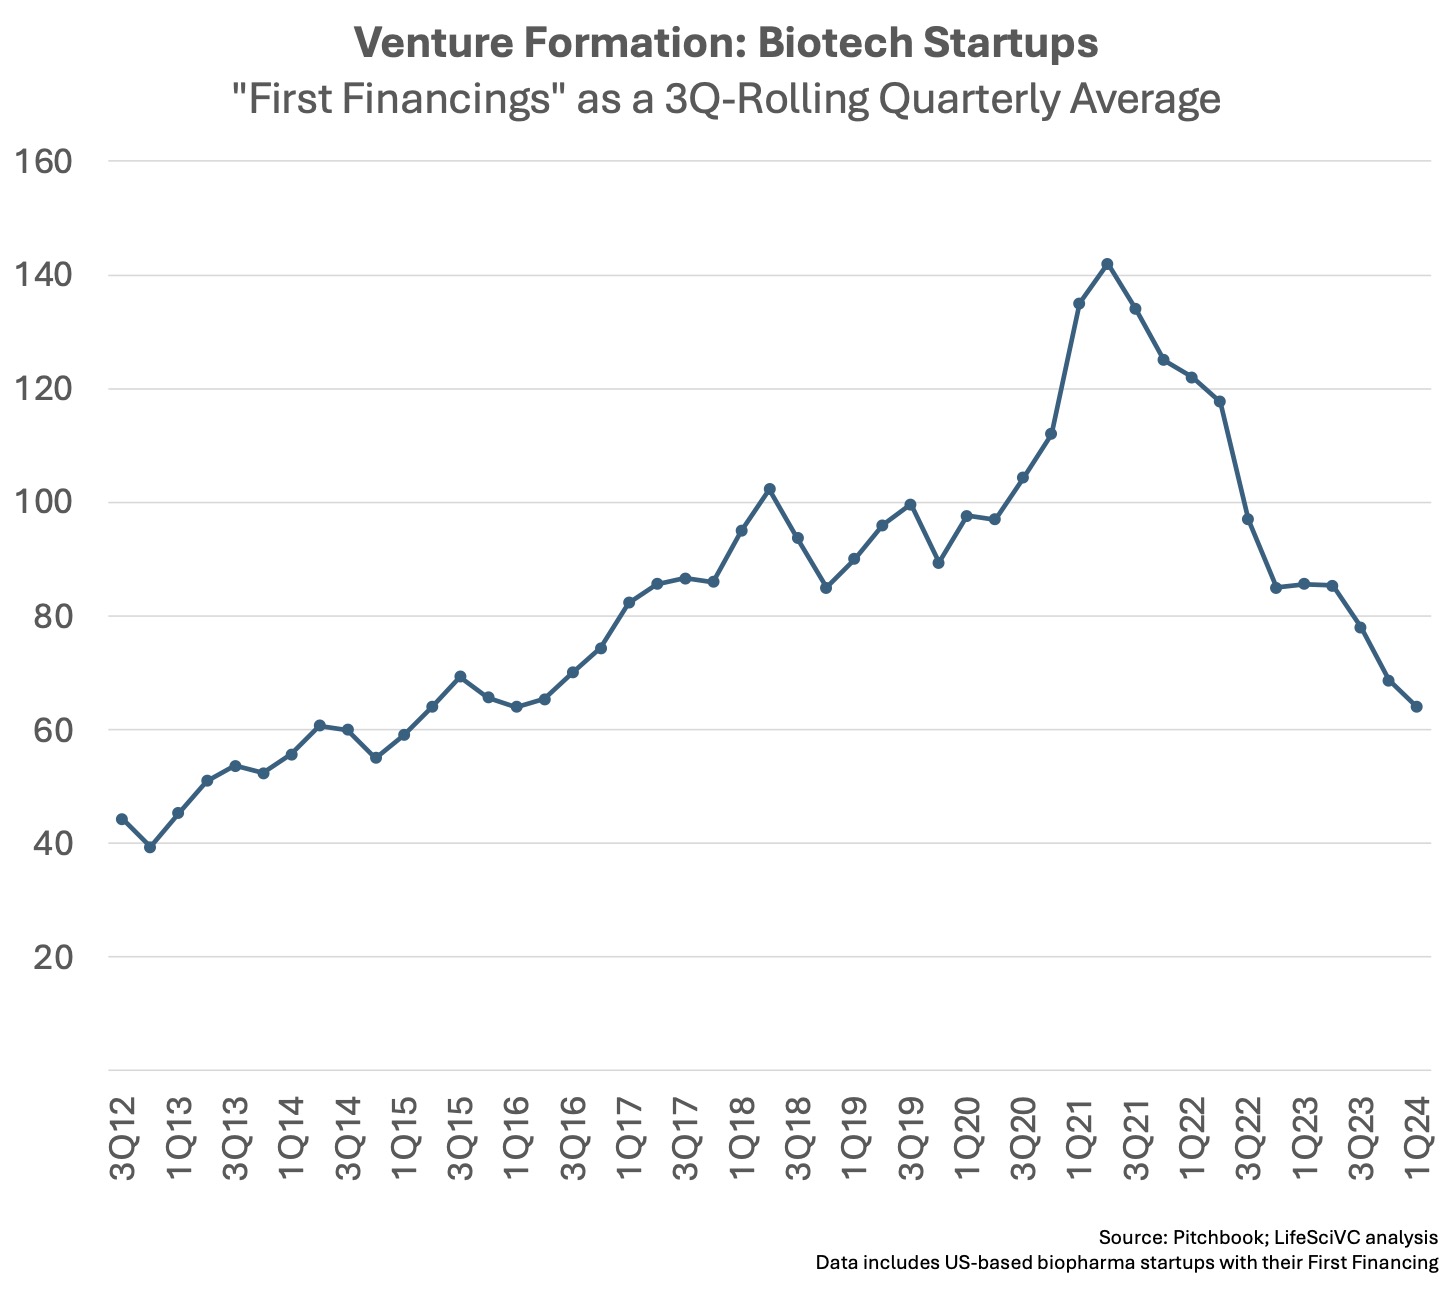
Venture creation in biotech is witnessing a sustained contraction. After the pandemic bubble’s over-indulgence, the venture ecosystem appears to have reset its pace of launching new startups.
According to the latest Pitchbook data, venture creation in biotech hit its slowest quarterly pace in eight years during 1Q 2024. With just over 60 new biotechs raising their first round of financing, the sector’s company formation activity has slowed 50-60% from its historic peak in 2021.
Overall, this contraction is a strong positive sign of healthy discipline, and should be good for the sector’s mid- and long-term prospects. Back in April 2023, in the midst of the second year of the market pullback, I shared some reflections on why it was likely to be “for the better.” At the risk of revisiting those points, here are a few reasons for why I still believe this contraction in venture creation is a healthy dynamic for the sector:
First, venture creation is hard to do well, and even harder at scale. Beyond simply backing great science (separating the wheat from the chafe), setting a company up properly is critical, and early choices can get locked into the DNA of the company. I’m often reminded of Peter Thiel’s law: “A startup messed up at its foundation cannot be fixed.” Back in 2013, I opined on this concept and many of the pitfalls highlighted around messing up venture formation remain salient today: unreproducible science (or poor target selection), inexperienced founders/”founder-itis”, poor Board governance, unwieldy syndicates, odd founding agreements, off-market capitalizations, etc… These are all no less relevant today than in the past, and in the pandemic period of irrational exuberance for big science many startups incorporated lots of these mutations into their founding DNA. Some continue to do so today, unfortunately, but there appears to be less of it happening.
Second, great teams of truly experienced leaders are scarce. Catalytic executives, rather than stoichiometric ones, can change the trajectory of startups but are in very short supply. Some grey hair is often, although not always, important. Fundamentally, even during tighter markets like today, great talent is always a very constrained resource, and spreading it too thinly across too many companies isn’t good for the ecosystem. Great scientists need great business partners, and vice versa, in order to be effective leaders in biotech – which means that concentrating the scarce high-quality talent in fewer companies will collectively be a good thing for the sector.
Third, with the proliferation of startups, we’ve seen incredible crowding in hyper-competitive therapeutic categories and modalities. This has long been a feature of biopharma (see 2012 and 2016 posts on oncology and immune-oncology, respectively), but has been exacerbated by the creation of so many new companies. Further, this lemming challenge has also moved well beyond oncology – think of all the “not-so-fast follower” autoimmune programs or metabolic disease stories. While it may help shake out some incremental advances for the therapeutic armamentarium, this dynamic also clearly creates inefficiencies and waste – both in terms of capital deployment, but also for patients’ engagement and clinical trial activity. Further, the competitive intensity in certain areas makes the “clinical do-ability” too challenging, even if those drugs could likely be beneficial. Fewer startups over time should ameliorate this crowding dynamic to some extent.
Fourth, the venture exit environment circa 2027-2030 for the new crop of early stage startups being created today will likely have structural supply/demand elements more favorable than the backdrop in recent years. With venture creation activity peaking in 2020-2022, the sector was awash in too many startups – much like the tech VC sector a few years back. In macroeconomic terms, a glut of startup equity (over-supply) in the face of fixed demand (M&A), or less demand (IPOs), means an unfavorable pricing dynamic. I explored this in a different phase of the biotech venture cycle a decade ago, but the themes are still relevant (in the opposite direction) for describing the recent and challenging exit environment. With fewer startups being created, the supply/demand balance should revert to a more favorable macro bias in the coming years (once the pig has been digested). This, of course, is only a comment on ecosystem “flux” dynamics, not all of the other potential policy and pricing headwinds.
One critical caveat to these positive observations: our job is to bring medicines to patients. A more constrained startup world means fewer bench-to-beside efforts will be embarked on by the sector as a whole, which could leave innovative new medicines stalled in laboratories around the world. We need to be mindful of this challenge, and ensure that the best ideas (rather than just the best connected ideas) are getting advanced by the sector.
It’s also important to note that my reflections above, and the data, are focused on the number of new startups being formed. Absolute funding levels are important too. While also off from their peaks in 2021, there’s still significant aggregate venture funding flowing into the startup world by any historic metric. In the past couple months, we saw the first $1B initial financing in biotech with the launch of Xaira, as well as large first financings from Metsera ($290M) and Mirador ($400M). Despite these mega-round financings, though, the median first financing remains in the $5-10M range, where it has been for years.
Stepping further back to the asset class, this contraction should be viewed positively by LPs, who invest into venture funds, and the VCs they back, as more discipline should translate into better returns in the long term: constrained resources should improve the average health of the venture herd.
The post The Biotech Startup Contraction Continues… And That’s A Good Thing appeared first on LifeSciVC.
dna pandemic

Rishi Sunak wants to cut the cost of ‘sicknote’ Britain. But we’ve found a strong economic case for benefits


Cashless Society: WEF Boasts That 98% Of Central Banks Are Adopting CBDCs


Popular fast-food chain files Chapter 11 bankruptcy facing lawsuits


The Biotech Startup Contraction Continues… And That’s A Good Thing


Philly Fed: State Coincident Indexes Increased in 44 States in March (3-Month Basis)


Target store introduces a new ‘over 18’ policy
Target store cracks down with ‘over 18’ policy


Bankrupt fast-food chain exits Chapter 11; to expand size 4 times


U.S. growth slowdown, with inflation spike, raises early stagflation risks
Popular fast-food chain files Chapter 11 bankruptcy; faces lawsuits
-

 Government3 weeks ago
Climate-Con & The Media-Censorship Complex – Part 1
-

 Spread & Containment1 week ago
J&J’s AI head jumps to Recursion; Doug Williams resigns as Sana’s R&D chief
-

 Government3 days ago
COVID-19 Vaccine Emails: Here’s What The CDC Hid Behind Redactions
-

 Spread & Containment2 weeks ago
WHO Official Admits Vaccine Passports May Have Been A Scam
-

 Spread & Containment2 weeks ago
FDA Finally Takes Down Ivermectin Posts After Settlement
-

 Uncategorized3 weeks ago
Vaccinated People Show Long COVID-Like Symptoms With Detectable Spike Proteins: Preprint Study
-

 Uncategorized3 weeks ago
Can language models read the genome? This one decoded mRNA to make better vaccines.
-

 Uncategorized3 weeks ago
What’s So Great About The Great Reset, Great Taking, Great Replacement, Great Deflation, & Next Great Depression?