Uncategorized
Advancing ESG Performance in the Built Environment
There are myriad considerations involved in developing a successful, comprehensive ESG strategy. A panel at CRE.Converge discussed overarching ESG trends…
Share this:


There are myriad key considerations involved in developing a successful, comprehensive ESG strategy, including meeting evolving investor and tenant demands, global drivers for ESG performance and expectations, the most pressing climate risks and their financial implications, emerging regulatory guidelines, green financing options, and more.
A panel at CRE.Converge this week moderated by Breana Wheeler, director of operations – U.S., BREEAM USA, discussed overarching ESG trends that are increasingly impacting building operations and development. Panelists included Heidi Creighton, FAIA, vice president, sustainability, Skanska USA Commercial Development; Anita Jeerage, LEED AP BD+C, WELL AP, vice president, sustainability and ESG, Unico Properties LLC; Daren Moss, principal, ESG – real estate lead, Ares Management; and Katie Zilka Hanson, vice president, client success, RE Tech Advisors.
Wheeler kicked off the conversation with a question to the panelists: What are the key drivers behind ESG initiatives today?
“Our tenants have their own ESG goals,” Jeerage said, “so it is important to have a program that will help your tenants make progress on their goals.” She also named climate risk as a driving factor; both physical risk from wildfire, flood, etc., and transition risk, looking at how energy usage will change in the future.
Her firm conducts climate risk analysis as part of their due diligence phase, layering in climate models that show what risks they might be facing in a 1.5-2-degree Fahrenheit warming climate scenario.
Moss also mentioned the environmental regulations driving change in the industry. “If you look at the U.K., for example, rental properties must have an Energy Performance Certificate (EPC) rating above ‘C’ in place by 2025,” Moss said. An EPC measures the energy efficiency of a property on a scale of A to G, with A being most energy efficient and G being least energy efficient. Building owners without one could be subject to staggering fines of £30,000 or more.
“An important fact about these standards is they’re built to become more stringent over time,” Jeerage added.
“Differentiation from our competitors is a key driver in our ESG initiatives,” Creighton said. “We’re thinking about divestment and resiliency and futureproofing, knowing those regulations are coming,” Creighton said. She said electrification is a priority for Skanska USA, and embodied carbon is also a major focus.
The “S” in ESG – Social – can be more difficult to measure. What does that piece look like for building developers?
“Thinking beyond the four walls of your building: how you can get engaged, make a difference, bring in diverse vendors?” said Jeerage.
“Finding the services that our tenants and communities need, creating space for workforce training and development, working with local nonprofits and providing programming and support the communities,” said Creighton.
“It won’t be one-size-fits-all, since every project is different,” Moss added.
The “G” in ESG – Governance – can be forgotten sometimes, Wheeler said.
“I think [governance] is the most important,” said Jeerage. “It’s the integration piece – it’s making sure what you’re trying to do in the ‘E’ and ‘S’ is built into the investment lifecycle.”
“It creates accountability; it adds the transparency piece,” Creighton agreed.
Beyond strategy, there is a tremendous need for accurate, transparent building performance data and holistic reporting methods.
Moss said it can be challenging for a building owner to get even basic utility data at times. “That’s a huge industry challenge – just your base-level KPIs of how much energy you used last year, for example.”
“We need to have data that is accurate and can serve as a benchmark,” said Hanson, adding that it’s exciting to see how technology is rapidly evolving.
One thing all the panelists unanimously agreed on: the world and the building requirements in place will look very different 10 or 25 years from now.

This post is brought to you by JLL, the social media and conference blog sponsor of NAIOP’s CRE.Converge 2023. Learn more about JLL at www.us.jll.com or www.jll.ca.
real estateUncategorized
Long Volatility Trade May Be A Widow-Maker No More
Long Volatility Trade May Be A Widow-Maker No More
Authored by Simon White, Bloomberg macro strategist,
An unusual combination of divergences…
Share this:


Authored by Simon White, Bloomberg macro strategist,
An unusual combination of divergences in the stock-market volatility space suggests the VIX is at elevated risk of pricing higher, and this may even happen with rising rather than falling equity prices. Volatility of volatility is near 10-year lows making call options on the VIX cheap.
Buying the VIX is the quintessential widow-maker trade. It is rare for the gauge to rise, with most of such instances over the last 20 years episodic and occurring when the market was falling. Most of the time, the market rises and volatility falls - there is an entire sub-industry devoted to exploiting and perpetuating this, which has swollen further in size in recent years with the boom in zero-days-to-expiry (0DTE) trading.
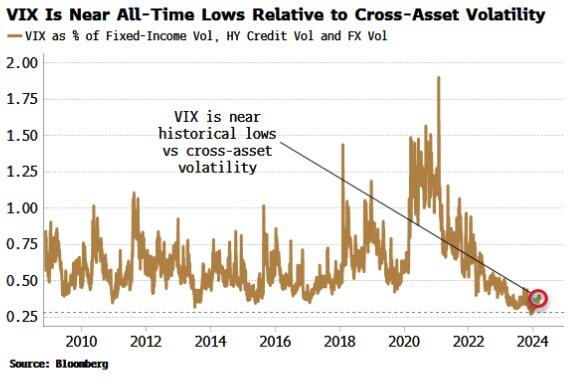
Not only is the VIX near its post-pandemic lows, it has also never been more out of step with cross-asset volatility – FX, fixed-income and credit (which is saying something as FX and credit vol are themselves near historic lows).
Markets are interlinked: rates impact stock valuations, high-yield credit sits just above equity in the capital structure, and so on. The question is how long can equity volatility remain the relative outlier?
There’s always a risk of becoming the next widow, but there are enough factors in play to suggest a heightened risk of a rise in the VIX.
Three trends suggest that a turning point in equity volatility is near:
-
Divergence between the VIX and skew structure;
-
Implied and realized correlation nearing their effective lower bound; and
-
Stresses in state-by-state US unemployment.
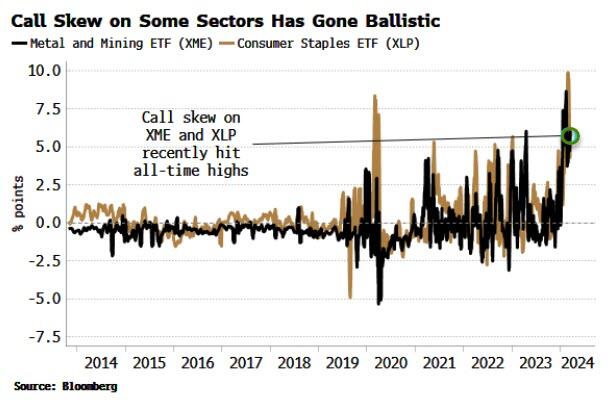
The market has become increasingly bullish in recent months, especially so after making new highs. That’s led to leveraged market chasing – call buying – and reduced hedging activity, i.e. less put buying. The rally chasing spurred some truly epic moves in the call skew of certain sectors. The metals and mining and staples sectors saw the biggest rises in their call skews, with both hitting series highs.
However, since 2020, it’s the relationship between call and put skew that’s tracked the VIX almost perfectly, with the index typically falling when call skew is outpacing put skew. In other words, when there is more leveraged activity in calls relative to puts, the VIX tends to be repressed (the VIX is a weighted-average of implied volatility in the S&P across all strikes).
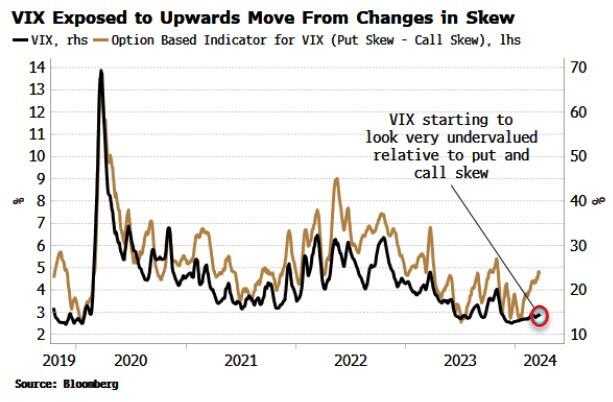
Now, though, put skew is outperforming call skew. As the chart above shows, that typically coincides with a rising VIX.
At the same time, the realized and implied correlation of the S&P is very depressed. Realized correlation is close to going below 10%, a level it rarely breaches, and when it does it is typically followed by a sharp move higher. Moreover, implied correlation - so called as it is implied from the Markowitz portfolio model - has never been lower.
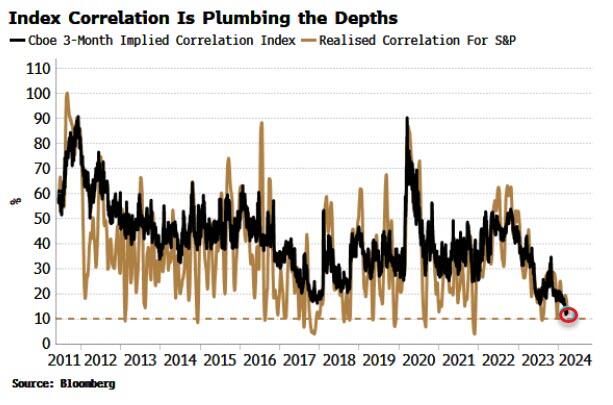
Correlation is being driven lower by the dominance of the largest stocks and by dispersion selling. The latter involves selling volatility on the index versus buying vol on individual stocks. As the Magnificent Seven - or whatever your favored cohort of AI-related stocks is - drive higher, the dispersion selling has the effect of pinning the index. The biggest stocks go up, while the rest are impaired by how much they can move, pushing correlation down.
In theory, index correlation could go negative, but it has never happened. The reason is that stocks are not completely random and are driven by common macro-based factors, such as interest rates. Correlation is thus so low today that it can only really go one way, and when it does, history shows the move is likely to be abrupt. Something has to give.
It’s not only the market sounding a warning about stock-market vol, but the economy too. A fairly reliable indication of rising equity volatility has been when we see a number of US states experiencing stress in their employment markets at the same time.
The chart below shows the percentage of US states whose unemployment rate is higher over the past year. As we can see, while increases in equity vol don’t always coincide with rising state unemployment, almost all the spikes higher in the percentage of states experiencing worsening unemployment coincide with episodes of higher VIX.
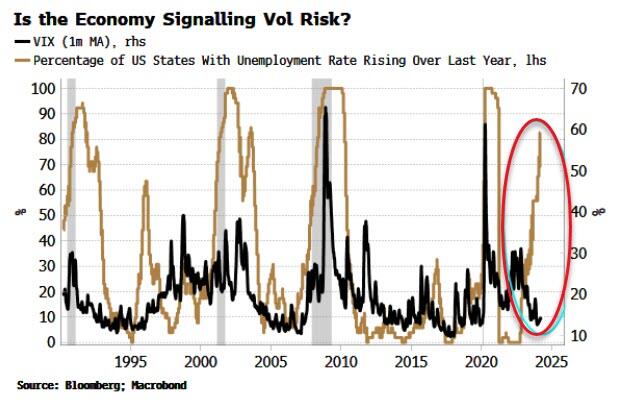
Today is - so far, along with the mid 1990s - an outlier, with more than half of US states seeing rising unemployment while the VIX remains near its lows.
There is a proviso here. The household survey, from which the unemployment rate is derived, may be under-reporting employment growth due to underestimating immigration. A recent Brookings paper suggests that the household survey is using too low an estimate for the civilian population, which could well explain its divergence from the establishment survey (payrolls). It might also bias state unemployment rates too high if estimates of the size of the workforce are too low.
Nonetheless, this measure bears close scrutiny, especially in confluence with the endogenous market-based signs of higher equity vol mentioned above.
Being long volatility is rarely comfortable. Given the structure of the market, the path of least resistance is down. This also means the volatility curve is typically steep – as it is today – meaning an investor wears negative carry to hold the position. One way to mitigate this is through call options on the VIX. These are relatively cheap, with the VVIX – the vol of vol – near 10-year lows.
The reflex is to expect higher equity vol to come with lower stock prices. But the two had a positive correlation for much of the second half of the 1990s. The current backdrop of still-supportive liquidity, a non-recessionary economy and investor call buying could lead to a situation of rising volatility and higher equity prices. That might make long volatility trades a less likely money-losing proposition.
Uncategorized
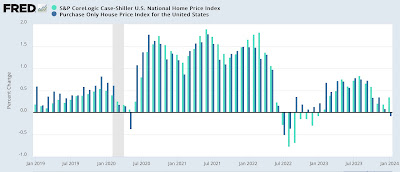
Repeat home sales price declined slightly in January; expect deceleration in the CPI measures of shelter to continue
– by New Deal democratAs I noted again yesterday, house prices lag home sales, which in turn lag mortgage rates. Yesterday we got the final February…
Share this:

- by New Deal democrat
As I noted again yesterday, house prices lag home sales, which in turn lag mortgage rates. Yesterday we got the final February reading on sales. This morning we got the final January read on prices, for repeat sales of existing homes.
Last week’s report on existing home sales showed a sharp increase in February, a repeat of the seasonally adjusted sharp increase last February, which was almost completely taken back over the next two months. YoY sales remained down by over 3%, but the median price of an existing home remained higher by 5.7% - very much *unlike* new homes, where sales have firmed, but price remain almost 20% down from their peak.


Uncategorized
Not having job flexibility or security can leave workers feeling depressed, anxious and hopeless
The way jobs are structured affects employee mental health, an analysis of more than 18,000 workers shows.
Share this:


When employees don’t have control over their work schedules, it’s not just morale that suffers – mental health takes a hit too. That’s what my colleagues and I discovered in a study recently published in the medical journal JAMA Network Open.
As a public health expert, I know that the way our jobs are designed can affect our well-being. Research has shown that flexibility, security and autonomy in the workplace are strong determinants of health.
To understand how powerful they are, my colleagues and I looked at the 2021 National Health Interview Survey, a major data collection initiative run out of the National Center for Health Statistics. We analyzed responses from 18,144 working adults across the U.S., teasing out how job flexibility and security may be linked with mental health.
The respondents were asked how easily they could change their work schedule to do things important to them or their family, whether their work schedule changed on a regular basis, and how far in advance they usually knew their schedules. They also rated their perceived risk of losing their job in the next 12 months.
We found that workers who had more flexible work arrangements were less likely to report feelings of depression, hopelessness and anxiety. Similarly, those with greater job security were at lower risk of mental health challenges. We also found that higher job security was linked with fewer instances of missing work over the past year.
Why it matters
The average full-time worker dedicates a third of their lifetime waking hours to work. Given that fact, understanding how job design affects mental health is key to developing policies that bolster well-being.
It’s clear why employers should care: When workers aren’t feeling well mentally, they’re less productive and more likely to miss work. Their creativity, collaboration and ability to meet job demands also suffer, hurting the entire organization.
The impact of job-related stress extends beyond the workplace, affecting families, communities and health care systems. People grappling with work-related mental health challenges often require multiple forms of support, such as access to counseling, medication and social services. Not addressing these needs comprehensively can cause serious long-term consequences, including reduced quality of life and increased health care costs.
It’s important to note that the COVID-19 pandemic worsened mental health disparities and that individuals in lower-wage positions, front-line workers and people in marginalized communities continue to face additional challenges. In this context, understanding exactly how job and work design can affect people’s mental health is all the more important.
What’s next
My research team plans to examine how race and gender affect the links between job flexibility, job security and mental health.
Previous research suggests that women and people of color experience unique workplace stressors that harm their mental well-being. For instance, women continue to face barriers to career advancement, unequal pay and a higher burden of unpaid care work.
Similarly, employees of color often experience discrimination, microaggressions and limited opportunities for professional growth at work, all of which can harm mental health. Understanding gender and racial differences will help researchers and organizations develop targeted interventions and policy recommendations.
Mental health challenges are far from rare: More than 50 million Americans, or nearly 1 in 5 adults, live with mental illness. By creating workplaces that prioritize employee well-being – through flexible work arrangements, supportive policies and access to mental health resources – organizations can help build a healthier society.
The Research Brief is a short take on interesting academic work.
Monica Wang does not work for, consult, own shares in or receive funding from any company or organization that would benefit from this article, and has disclosed no relevant affiliations beyond their academic appointment.
depression pandemic covid-19 medication

IRS Reveals Suspicious Signs It Looks For To Flag Incorrect Or Fraudulent Tax Credit Claims


Repeat home sales price declined slightly in January; expect deceleration in the CPI measures of shelter to continue


New Home Sales at 662,000 Annual Rate in February


Chapter 11, 7 bankruptcy filings claim more beer, brewery brands


The relentless growth of U.S. government debt


As mortgage rates remain rangebound, so do new home sales


Common household chemicals pose new threat to brain health


Measuring Fed Inflation Credibility


AstraZeneca advances Fasenra’s marketing with new campaign that’s on TikTok for first time


Not having job flexibility or security can leave workers feeling depressed, anxious and hopeless
-

 Spread & Containment2 weeks ago
IFM’s Hat Trick and Reflections On Option-To-Buy M&A
-

 Uncategorized1 month ago
All Of The Elements Are In Place For An Economic Crisis Of Staggering Proportions
-

 International3 weeks ago
EyePoint poaches medical chief from Apellis; Sandoz CFO, longtime BioNTech exec to retire
-

 International4 days ago
Parexel CEO to retire; CAR-T maker AffyImmune promotes business leader to chief executive
-

 Uncategorized1 month ago
Apparel Retailer Express Moving Toward Bankruptcy
-

 International3 weeks ago
Walmart launches clever answer to Target’s new membership program
-

 Uncategorized4 weeks ago
Key Events This Week: All Eyes On Core PCE Amid Deluge Of Fed Speakers
-

 Uncategorized1 month ago
A Blue State Exodus: Who Can Afford To Be A Liberal