“You Met Me At A Very Strange Time In My Life”
"You Met Me At A Very Strange Time In My Life"
Authored by Chris Hamilton via Econimica blog,
As we near 2021, I offer a primer on where we stand demographically heading into the new year…
To begin, I’ll divide the world into two roughly.
Share this:


Authored by Chris Hamilton via Econimica blog,
As we near 2021, I offer a primer on where we stand demographically heading into the new year...
To begin, I'll divide the world into two roughly equal groups, consumers and non-consumers, using the World Bank gross national income per capita.
"Consumers" are half the worlds population, have average income per capita above $4,045...enjoy 80%+ of the income, savings, access to credit and likewise consume 80%+ of the worlds exported commodities and 80%+ of the worlds energy. They have average income of $12,000'ish. Consumers include:
-
83 High Income Nations ($12,536+) - EU, US/Canada, Japan, Australia/NZ, Saudi Arabia/UAE, S. Korea, Taiwan, Israel
-
56 Upper Middle Income Nations ($4,046-$12,535) - China, Mexico, Brazil, Russia, Iran/Iraq, Indonesia, Argentina, Thailand, Colombia/Venezuela
"Low or Non-consumers", the other half of the worlds population, have average income per capita of a few hundred dollars to $4044...earn less than 20% of world income, savings, access to credit and consume less than 20% of all exported commodities and burn less than 20% of global energy. They have average income of about $1,200 a year...10x less per person among non-consumers than the average "consumer".
-
50 Lower Middle Income Nations ($1,036 to $4045) - India/Pakistan, Philippines, Bangladesh, Nigeria, Egypt, Vietnam, Ukraine, Honduras/Nicaragua/El Salvador, Bolivia
-
29 Low Income Nations ($1,035 and below) - Afghanistan, Haiti, Somalia, Yemen, Syria, N. Korea, Madagascar, Chad, Uganda
Critically, as you read through this and see large scale present and future population declines among the consumer nations...you will note that while there is growth among non-consumer populations, it is more typically on a 1:1 basis...meaning the decline of one "consumer" is being met with the replacement of one "non-consumer"...each replacement resulting in something like a 90% decline in consumption capability.
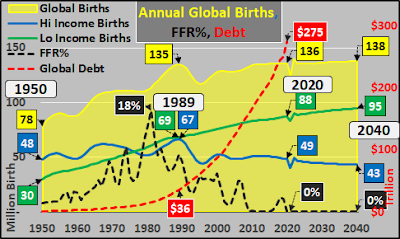
First, a look at the head waters of global demand...annual global births. The yellow shaded area in the chart below shows global births peaked at approx. 135 million annually in 1989...and have not likely ever returned to that high water mark. Although UN expected 2020 births to surpass the 1989 quantity...when the UN releases its next updated report, births will have been adjusted down by millions to reflect the reality demographers have been witnessing, putting births well below the 1989 peak. And in 2021, the dearth of global pregnancies in 2020 will turn into one of the largest birth dearth in history.
Family formation and resultant births is the greatest force in creating growing demand (inflation). UN data shows that annual "consumer" births (blue line, below) have declined by 18 million from the 1989 peak back to the same number of births as were seen in 1950. A full roundtrip, with 4 decades of rising births followed by 3 decades of declining births. These consumer nation numbers are generally inclusive of the births to immigrants within the consumer nations...absent that, the decline would have been much steeper. Low consumer nation births (yellow line) have risen by the same quantity as consumer nation declines. Both are expected to maintain their current trajectories...Low consumer births continuing to replace consumer births 1:1.
For those paying attention, inflation (as represented by the Federal Reserve set Federal Funds Rate) has been declining nearly in tandem with the declining consumer nation births, and global debt has blasted off inversely...with the impact of pulling demand forward against a future with organically declining demand. The question here, how would an ever smaller future of consumers pay off or outgrow ever more debt???
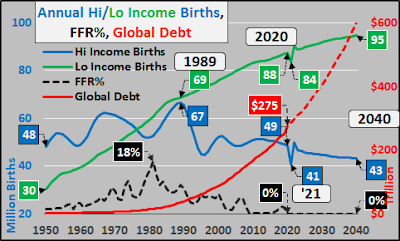
Narrowing in on high income nation births versus low income nation births...Not hard to see where this is going.
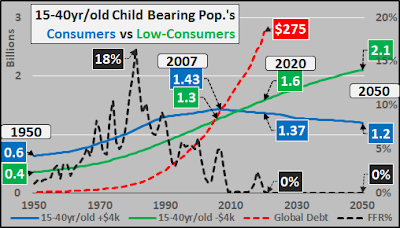
Given 30 years of declining consumer nation births, no surprise the childbearing population among consumer nations is now in decline versus ongoing growth in the low consumer nations childbearing population.
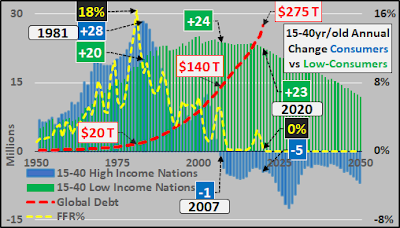
Below, checking the year over year change of the high versus low consumer populations. The acceleration and deceleration of the "consumer" childbearing population (essentially mirrored by the Federal Funds Rate), note the apex of growth among low consumer nations has come and gone. Declining consumer nation childbearing populations and decelerating childbearing growth among low consumer nations is all we can expect from here.
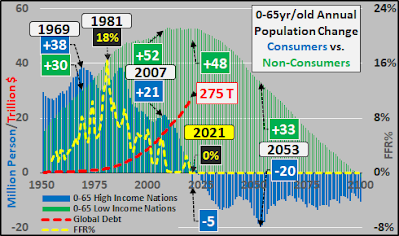
And the demographic flow through means the apex of the 0-65 year old consumer nations population has just been reached, and continued declines are to be expected from here. Again, the consumer declines are anticipated to be offset by low consumer population growth (much of the anticipated growth to be significantly longer low consumer nation lifespans leading to larger elderly populations...while growth among low consumer younger populations decelerates).

Again, checking the year over year change that is now turned to consumer nations secular depopulation and decelerating growth among low consumer nations.
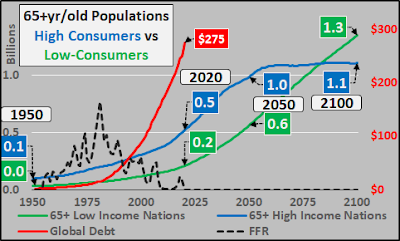
To round out the picture, 65+ consumers versus 65+ low consumers.
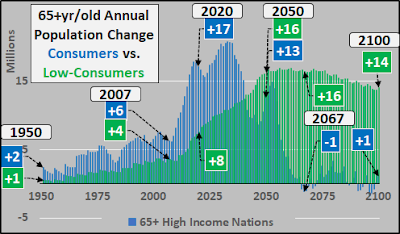
Year over year change in consumer vs. low consumer 65+ year old populations.
USA
Births
Despite all the US population growth and immigration, the US has only marginally exceeded the 1957 peak in annual births in a single year, 2007. And since that dual peak in 2007, births have again fallen by nearly 700,000 (-16%) fewer births annually. However, the imminent 2021 Covid-19 induced waterfall event in births will see 1+ million (-26%) fewer births than the '57/'07 dual peaks. Among major influences on the birth rate is the Fed's FFR% and asset purchasing resulting in large asset inflation essentially punishing young adults whom have few to no assets. Expenses rising well ahead of incomes. Resultant lower marriage rates, births are an outflow of Federal Reserve policy.
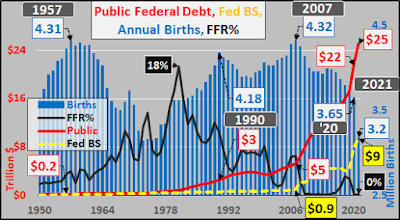
Below, a simple birth to debt ratio to gauge the creation of all that debt against the future responsible for outgrowing, repaying, and/or servicing that debt. The curve of falling births and exploding debt has gone parabolic.

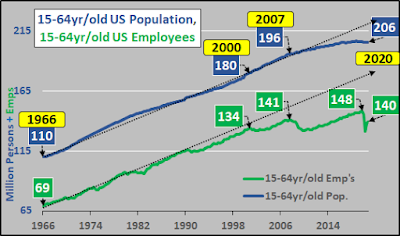
Working Age Population
To wrap it up, check the 15 to 64 year old population (blue line) versus those employed among the same age group (green line). Shouldn't be hard to see the decelerating population growth and the even faster decelerating employment growth.
Same population/employment as above but adding in the Federal Reserve set FFR% and expansion of Federal Reserve balance sheet (QE)...and the impact of those policies to encourage greater federal debt.
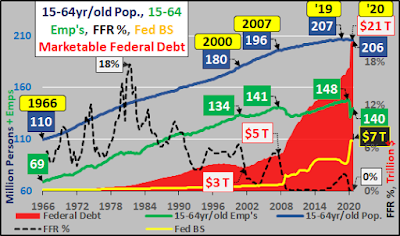
The Federal Reserve is tasked w/ stable prices (lol) and full employment. Below, you can see the means to achieve full employment has been ever lower interest rates, more QE, to encourage ever higher debt fueled economic activity.
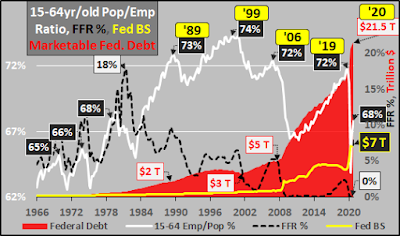
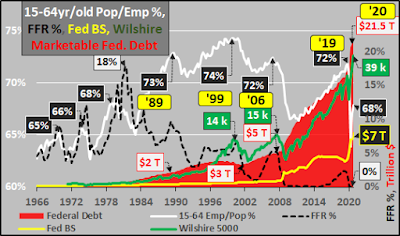
But if you add in the Wilshire 5000 (representing all publicly traded US equities), you can see quite clearly the primary winner of each progressive "full employment" cycle are not the employees but a shrinking percentage who hold a fast growing percentage of assets.
Housing
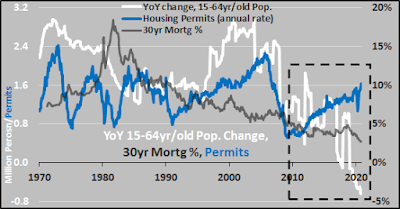
I'd be a bit remiss not to take a peek at housing. Below, annual change in the working age population (white line), 30 year fixed mortgage rate (grey line), and housing permits (blue line). What is taking place now has never happened as the Federal Reserve's interest rate setting and QE have pulled the 30 year fixed mortgage rates to record lows...while housing permits are being issued far in excess of the declining population of potential buyers. All this while the elderly population, with the highest homeownership rates, turn to net sellers as they downsize or leave inherited properties to their heirs. In all cases, a surge of housing units is coming for a declining basis of buyers.
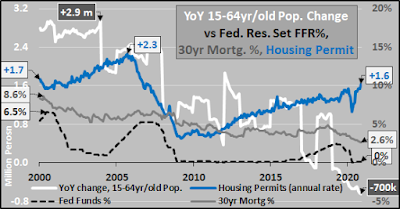
Looking a little closer at the same data as above, from 2000 to present.
Debt n Demographics
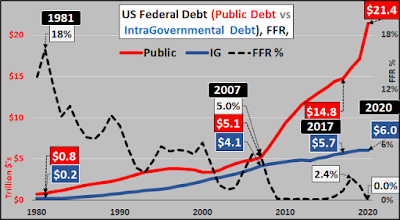
Quick review of US marketable public debt (red line), vs. Intragovernmental debt (debt held by SS trust funds, etc.), and Federal Funds rate. Essentially all debt issued from here forward will be marketable as the demographically driven IG rolls over to net declines. The US will be more reliant on foreigners, the Federal Reserve, and institutional buyers than ever before. This while the US government can afford essentially no higher interest payments than the present ZIRP induced reality.
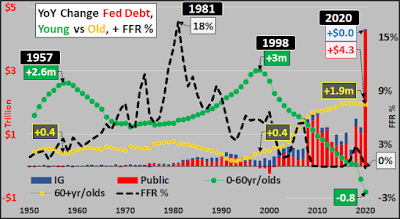
Checking the annual change in marketable (red columns) vs IG (blue columns) debt, likewise change in 0-60 (green line) vs. 60+ (yellow line) year old US population, and again the Federal Funds rate.
For those curious to see the relationship of lower rates and ZIRP (black line) to encourage soaring debt; below are total US debt/GDP (blue line), Federal Government debt/GDP (red line), and the resulting heavens bound Wilshire 5000.

US Treasury Bonds
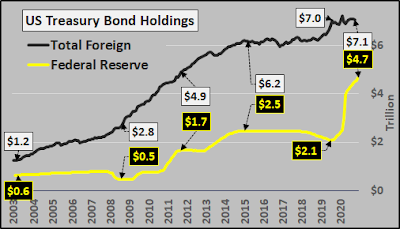
Below, Federal Reserve held US Treasury debt (yellow line) versus foreign holdings (black line). With so much more demographically driven issuance to come and so few buyers willing to buy US debt anywhere near current rates...the only natural buyer is a buyer whose motivation isn't profit but control. I'll bet the Fed isn't about to play the QT card again.
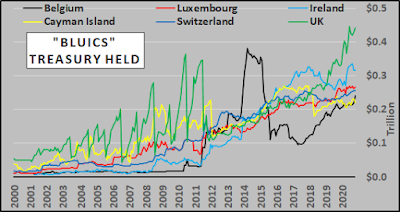
Comparing the soaring Federal Reserve held Treasury's to the largest holders of US debt; China, Japan, and the "BLUICS" compilation (Belgium, Luxembourg, UK, Ireland, Cayman Island, Switzerland). Despite running large dollar trade surplus', foreigners no longer recycle their excess dollars into Treasury's. But they must go somewhere...equities, precious metals, but perhaps particularly Bitcoin?

Only ongoing net buyer of US Treasury bonds are shadow banking nations with access to central bank swap lines rather than dollar based trade surplus'.
Short and long of it...US is in a demographic driven decline, the federal government is committed to growth at all costs, the Federal Reserve is tasked with ensuring US Treasury bonds are not traded at "free market valuations". And perhapsmay Bitcoin is the best way to short America?!?
Bitcoin
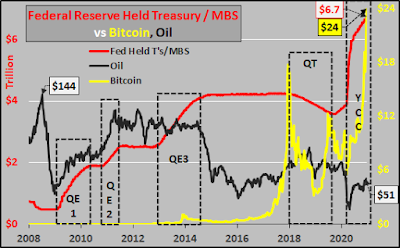
Finally I mention Bitcoin and just show it versus the Federal Reserve's combined holdings of Treasury's and Mortgage Backed Securities, plus the operations undertaken leading to an ever larger balance sheet. The flood of $'s and removal of large scale quantities of assets are pushing asset prices higher but the combination of cheap interest rates (are boosting long term capacity) while only offering short term boosts to demand, are pushing commodity prices ever lower. Make of this what you will.
Anyway, about now the nature of 2020, 2021 should be more clear...this is no typical business cycle or pandemic. Decades of demographic deceleration and now outright demographic declines are at the heart of central bank ZIRP/NIRP, QE, and soaring debt. Demographics are destiny and by now is should be clear there is no means to ever outgrow this debt. This appears to be the initiation of a global reset, de facto or otherwise.
To wrap it, at the conclusion of Fight Club, after having killed his alter-ego & arranged for the destruction of all global credit records...Ed Norton says, "You met me at a very strange time in my life" as the credit records are all destroyed. I believe the world is equally living a dissociated reality but will soon become painfully self aware of the truths we have so long disavowed.

Enjoy the clip...Fight Club
*Population data from UN World Population Prospects 2019.
Spread & Containment
The Coming Of The Police State In America
The Coming Of The Police State In America
Authored by Jeffrey Tucker via The Epoch Times,
The National Guard and the State Police are now…
Share this:


Authored by Jeffrey Tucker via The Epoch Times,
The National Guard and the State Police are now patrolling the New York City subway system in an attempt to do something about the explosion of crime. As part of this, there are bag checks and new surveillance of all passengers. No legislation, no debate, just an edict from the mayor.
Many citizens who rely on this system for transportation might welcome this. It’s a city of strict gun control, and no one knows for sure if they have the right to defend themselves. Merchants have been harassed and even arrested for trying to stop looting and pillaging in their own shops.
The message has been sent: Only the police can do this job. Whether they do it or not is another matter.
Things on the subway system have gotten crazy. If you know it well, you can manage to travel safely, but visitors to the city who take the wrong train at the wrong time are taking grave risks.
In actual fact, it’s guaranteed that this will only end in confiscating knives and other things that people carry in order to protect themselves while leaving the actual criminals even more free to prey on citizens.
The law-abiding will suffer and the criminals will grow more numerous. It will not end well.
When you step back from the details, what we have is the dawning of a genuine police state in the United States. It only starts in New York City. Where is the Guard going to be deployed next? Anywhere is possible.
If the crime is bad enough, citizens will welcome it. It must have been this way in most times and places that when the police state arrives, the people cheer.
We will all have our own stories of how this came to be. Some might begin with the passage of the Patriot Act and the establishment of the Department of Homeland Security in 2001. Some will focus on gun control and the taking away of citizens’ rights to defend themselves.
My own version of events is closer in time. It began four years ago this month with lockdowns. That’s what shattered the capacity of civil society to function in the United States. Everything that has happened since follows like one domino tumbling after another.
It goes like this:
1) lockdown,
2) loss of moral compass and spreading of loneliness and nihilism,
3) rioting resulting from citizen frustration, 4) police absent because of ideological hectoring,
5) a rise in uncontrolled immigration/refugees,
6) an epidemic of ill health from substance abuse and otherwise,
7) businesses flee the city
8) cities fall into decay, and that results in
9) more surveillance and police state.
The 10th stage is the sacking of liberty and civilization itself.
It doesn’t fall out this way at every point in history, but this seems like a solid outline of what happened in this case. Four years is a very short period of time to see all of this unfold. But it is a fact that New York City was more-or-less civilized only four years ago. No one could have predicted that it would come to this so quickly.
But once the lockdowns happened, all bets were off. Here we had a policy that most directly trampled on all freedoms that we had taken for granted. Schools, businesses, and churches were slammed shut, with various levels of enforcement. The entire workforce was divided between essential and nonessential, and there was widespread confusion about who precisely was in charge of designating and enforcing this.
It felt like martial law at the time, as if all normal civilian law had been displaced by something else. That something had to do with public health, but there was clearly more going on, because suddenly our social media posts were censored and we were being asked to do things that made no sense, such as mask up for a virus that evaded mask protection and walk in only one direction in grocery aisles.
Vast amounts of the white-collar workforce stayed home—and their kids, too—until it became too much to bear. The city became a ghost town. Most U.S. cities were the same.
As the months of disaster rolled on, the captives were let out of their houses for the summer in order to protest racism but no other reason. As a way of excusing this, the same public health authorities said that racism was a virus as bad as COVID-19, so therefore it was permitted.
The protests had turned to riots in many cities, and the police were being defunded and discouraged to do anything about the problem. Citizens watched in horror as downtowns burned and drug-crazed freaks took over whole sections of cities. It was like every standard of decency had been zapped out of an entire swath of the population.
Meanwhile, large checks were arriving in people’s bank accounts, defying every normal economic expectation. How could people not be working and get their bank accounts more flush with cash than ever? There was a new law that didn’t even require that people pay rent. How weird was that? Even student loans didn’t need to be paid.
By the fall, recess from lockdown was over and everyone was told to go home again. But this time they had a job to do: They were supposed to vote. Not at the polling places, because going there would only spread germs, or so the media said. When the voting results finally came in, it was the absentee ballots that swung the election in favor of the opposition party that actually wanted more lockdowns and eventually pushed vaccine mandates on the whole population.
The new party in control took note of the large population movements out of cities and states that they controlled. This would have a large effect on voting patterns in the future. But they had a plan. They would open the borders to millions of people in the guise of caring for refugees. These new warm bodies would become voters in time and certainly count on the census when it came time to reapportion political power.
Meanwhile, the native population had begun to swim in ill health from substance abuse, widespread depression, and demoralization, plus vaccine injury. This increased dependency on the very institutions that had caused the problem in the first place: the medical/scientific establishment.
The rise of crime drove the small businesses out of the city. They had barely survived the lockdowns, but they certainly could not survive the crime epidemic. This undermined the tax base of the city and allowed the criminals to take further control.
The same cities became sanctuaries for the waves of migrants sacking the country, and partisan mayors actually used tax dollars to house these invaders in high-end hotels in the name of having compassion for the stranger. Citizens were pushed out to make way for rampaging migrant hordes, as incredible as this seems.
But with that, of course, crime rose ever further, inciting citizen anger and providing a pretext to bring in the police state in the form of the National Guard, now tasked with cracking down on crime in the transportation system.
What’s the next step? It’s probably already here: mass surveillance and censorship, plus ever-expanding police power. This will be accompanied by further population movements, as those with the means to do so flee the city and even the country and leave it for everyone else to suffer.
As I tell the story, all of this seems inevitable. It is not. It could have been stopped at any point. A wise and prudent political leadership could have admitted the error from the beginning and called on the country to rediscover freedom, decency, and the difference between right and wrong. But ego and pride stopped that from happening, and we are left with the consequences.
The government grows ever bigger and civil society ever less capable of managing itself in large urban centers. Disaster is unfolding in real time, mitigated only by a rising stock market and a financial system that has yet to fall apart completely.
Are we at the middle stages of total collapse, or at the point where the population and people in leadership positions wise up and decide to put an end to the downward slide? It’s hard to know. But this much we do know: There is a growing pocket of resistance out there that is fed up and refuses to sit by and watch this great country be sacked and taken over by everything it was set up to prevent.
Government
Low Iron Levels In Blood Could Trigger Long COVID: Study
Low Iron Levels In Blood Could Trigger Long COVID: Study
Authored by Amie Dahnke via The Epoch Times (emphasis ours),
People with inadequate…
Share this:


Authored by Amie Dahnke via The Epoch Times (emphasis ours),
People with inadequate iron levels in their blood due to a COVID-19 infection could be at greater risk of long COVID.
A new study indicates that problems with iron levels in the bloodstream likely trigger chronic inflammation and other conditions associated with the post-COVID phenomenon. The findings, published on March 1 in Nature Immunology, could offer new ways to treat or prevent the condition.
Long COVID Patients Have Low Iron Levels
Researchers at the University of Cambridge pinpointed low iron as a potential link to long-COVID symptoms thanks to a study they initiated shortly after the start of the pandemic. They recruited people who tested positive for the virus to provide blood samples for analysis over a year, which allowed the researchers to look for post-infection changes in the blood. The researchers looked at 214 samples and found that 45 percent of patients reported symptoms of long COVID that lasted between three and 10 months.
In analyzing the blood samples, the research team noticed that people experiencing long COVID had low iron levels, contributing to anemia and low red blood cell production, just two weeks after they were diagnosed with COVID-19. This was true for patients regardless of age, sex, or the initial severity of their infection.
According to one of the study co-authors, the removal of iron from the bloodstream is a natural process and defense mechanism of the body.
But it can jeopardize a person’s recovery.
“When the body has an infection, it responds by removing iron from the bloodstream. This protects us from potentially lethal bacteria that capture the iron in the bloodstream and grow rapidly. It’s an evolutionary response that redistributes iron in the body, and the blood plasma becomes an iron desert,” University of Oxford professor Hal Drakesmith said in a press release. “However, if this goes on for a long time, there is less iron for red blood cells, so oxygen is transported less efficiently affecting metabolism and energy production, and for white blood cells, which need iron to work properly. The protective mechanism ends up becoming a problem.”
The research team believes that consistently low iron levels could explain why individuals with long COVID continue to experience fatigue and difficulty exercising. As such, the researchers suggested iron supplementation to help regulate and prevent the often debilitating symptoms associated with long COVID.
“It isn’t necessarily the case that individuals don’t have enough iron in their body, it’s just that it’s trapped in the wrong place,” Aimee Hanson, a postdoctoral researcher at the University of Cambridge who worked on the study, said in the press release. “What we need is a way to remobilize the iron and pull it back into the bloodstream, where it becomes more useful to the red blood cells.”
The research team pointed out that iron supplementation isn’t always straightforward. Achieving the right level of iron varies from person to person. Too much iron can cause stomach issues, ranging from constipation, nausea, and abdominal pain to gastritis and gastric lesions.
1 in 5 Still Affected by Long COVID
COVID-19 has affected nearly 40 percent of Americans, with one in five of those still suffering from symptoms of long COVID, according to the U.S. Centers for Disease Control and Prevention (CDC). Long COVID is marked by health issues that continue at least four weeks after an individual was initially diagnosed with COVID-19. Symptoms can last for days, weeks, months, or years and may include fatigue, cough or chest pain, headache, brain fog, depression or anxiety, digestive issues, and joint or muscle pain.
Uncategorized
February Employment Situation
By Paul Gomme and Peter Rupert The establishment data from the BLS showed a 275,000 increase in payroll employment for February, outpacing the 230,000…
Share this:


By Paul Gomme and Peter Rupert
The establishment data from the BLS showed a 275,000 increase in payroll employment for February, outpacing the 230,000 average over the previous 12 months. The payroll data for January and December were revised down by a total of 167,000. The private sector added 223,000 new jobs, the largest gain since May of last year.

Temporary help services employment continues a steep decline after a sharp post-pandemic rise.


Average hours of work increased from 34.2 to 34.3. The increase, along with the 223,000 private employment increase led to a hefty increase in total hours of 5.6% at an annualized rate, also the largest increase since May of last year.

The establishment report, once again, beat “expectations;” the WSJ survey of economists was 198,000. Other than the downward revisions, mentioned above, another bit of negative news was a smallish increase in wage growth, from $34.52 to $34.57.

The household survey shows that the labor force increased 150,000, a drop in employment of 184,000 and an increase in the number of unemployed persons of 334,000. The labor force participation rate held steady at 62.5, the employment to population ratio decreased from 60.2 to 60.1 and the unemployment rate increased from 3.66 to 3.86. Remember that the unemployment rate is the number of unemployed relative to the labor force (the number employed plus the number unemployed). Consequently, the unemployment rate can go up if the number of unemployed rises holding fixed the labor force, or if the labor force shrinks holding the number unemployed unchanged. An increase in the unemployment rate is not necessarily a bad thing: it may reflect a strong labor market drawing “marginally attached” individuals from outside the labor force. Indeed, there was a 96,000 decline in those workers.


Earlier in the week, the BLS announced JOLTS (Job Openings and Labor Turnover Survey) data for January. There isn’t much to report here as the job openings changed little at 8.9 million, the number of hires and total separations were little changed at 5.7 million and 5.3 million, respectively.

As has been the case for the last couple of years, the number of job openings remains higher than the number of unemployed persons.

Also earlier in the week the BLS announced that productivity increased 3.2% in the 4th quarter with output rising 3.5% and hours of work rising 0.3%.

The bottom line is that the labor market continues its surprisingly (to some) strong performance, once again proving stronger than many had expected. This strength makes it difficult to justify any interest rate cuts soon, particularly given the recent inflation spike.
unemployment pandemic unemployment

Walmart launches clever answer to Target’s new membership program


EyePoint poaches medical chief from Apellis; Sandoz CFO, longtime BioNTech exec to retire


Wendy’s has a new deal for daylight savings time haters


Watch Live: President Biden Reminds Americans Just How Good They’ve Got It Thanks To Him


When Military Rule Supplants Democracy


Catastrophic Risk: Investing and Business Implications


The Digest #187


Racial and Ethnic Wealth Inequality in the Post‑Pandemic Era


Redefining Poverty: Towards a Transpartisan Approach


Dropping Like a Stone: ON RRP Take‑up in the Second Half of 2023
-

 Uncategorized2 weeks ago
All Of The Elements Are In Place For An Economic Crisis Of Staggering Proportions
-

 Uncategorized1 month ago
Cathie Wood sells a major tech stock (again)
-

 Uncategorized3 weeks ago
California Counties Could Be Forced To Pay $300 Million To Cover COVID-Era Program
-

 Uncategorized2 weeks ago
Apparel Retailer Express Moving Toward Bankruptcy
-

 Uncategorized3 weeks ago
Industrial Production Decreased 0.1% in January
-
International1 day ago
Walmart launches clever answer to Target’s new membership program
-

 Uncategorized3 weeks ago
RFK Jr: The Wuhan Cover-Up & The Rise Of The Biowarfare-Industrial Complex
-

 Uncategorized3 weeks ago
GOP Efforts To Shore Up Election Security In Swing States Face Challenges