Spread & Containment
Valuation Inflation
Valuation Inflation
Share this:


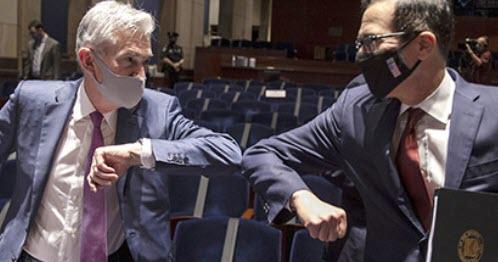
Authored by John Mauldin via MauldinEconomics.com,
“In the short run, the market is a voting machine but in the long run, it is a weighing machine.”
- Benjamin Graham
You may have noticed a bit of manic activity in the stock market. You may have also noticed inflation (as measured by various government agencies) is quite low, despite a supply interruption in numerous goods and services.
These aren’t separate events. Both are consequences of the pandemic. Specifically, they result from the government and central bank response to the pandemic. As necessary as their actions may have been, they have side effects, many unintended and some of which will not be known for years. These hastily conceived programs have even more side effects than usual.
I think we actually have high inflation, but due to these side effects it is showing up in stock prices instead of consumer prices. I believe this, not V-shaped recovery expectations, is the main reason stocks are up. Today we’ll explore why this is, and how investors should respond.
This letter will be different than usual. We’ll start with a dozen or so charts showing the market is either very highly valued, or extremely overvalued, or merely stretched. But in general, you will see markets are indeed at the upper end of historical valuations.
Then we’ll consider some reasons why this is so, and why stocks could even go higher. Every previous recession had an accompanying equity bear market, often quite vicious. Why not this time? That is what we will try to answer.
I sent a note out earlier this week to my friends asking for their favorite valuation charts. Let’s look at what they sent plus what crosses my desk in a normal week.
(Warning: Printing this letter will take more pages than normal as charts take room.)
The Market in a Dozen Charts
We’ll begin with some charts from Jim Bianco. This first one looks at the S&P 500 versus “forward” earnings, i.e. analyst projections. Analysts tend to run in herds, usually tracking one another. Furthermore, they almost always overestimate even in good times.
So we can pretty much assume that earnings will be worse (because, after all, it is a recession) than projected below, but even that leaves 1999–2000 bubble-level valuations.
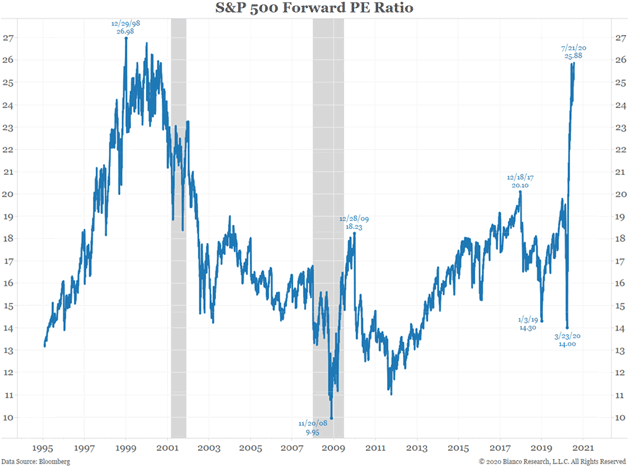
Chart: Bianco Research
From Jim:
The bulls cry foul… we know that the earnings over the next year are wrecked because of CV19/shutdowns. So, let’s invent a new metric, P/E ratio looking ahead two or three years.
This chart uses 3-year forward earnings estimates. That is, Jun 2022 to June 2023. You are still paying over 21 for these earnings. Not cheap!
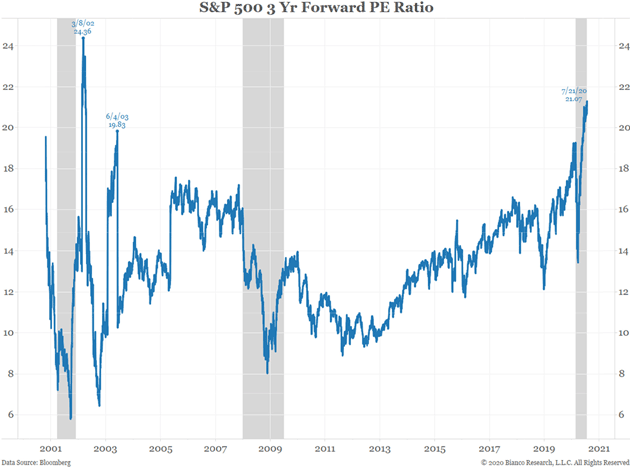
Chart: Bianco Research
Then Jim goes on to demonstrate that three-year forward earnings are generally very optimistic:

Chart: Bianco Research
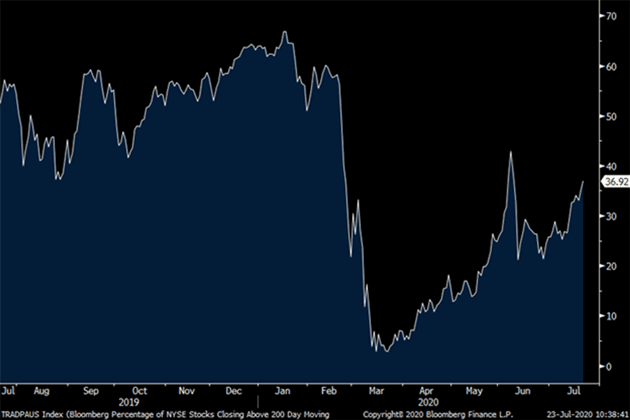
Where Is the Breadth?
In a true bull market, you see most stocks rising, often to new highs. A rising tide should lift nearly all boats. These next few charts from Peter Boockvar and Doug Kass will demonstrate that is not the case now.majority of stocks making
Let’s look at the percentage of NYSE stocks closing above their 200-day moving average, which is 37% now. It was near 70% in January.
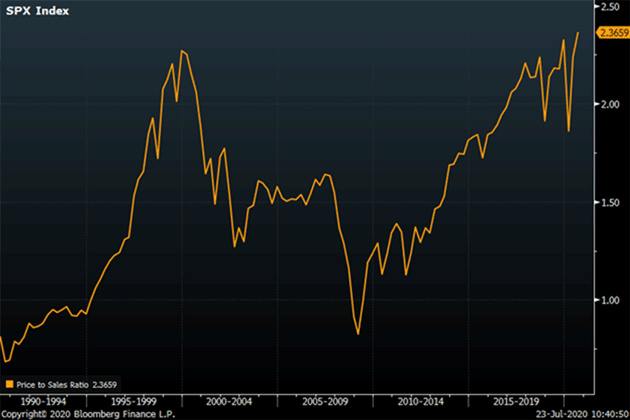
Another way to look at valuations is the ratio of price to sales rather than earnings. Here again, we have exceeded the 1999–2000 bubble.
The S&P 10 versus the S&P 490
Tony Sagami sent me a few charts from Twitter. It turns out that much of the S&P 500 returns come from just 10 companies: Microsoft, Apple, Amazon, Google, Facebook, Visa, Mastercard, Nvidia, Netflix, and Adobe. As a group they are up 35% since the beginning of the year. As a group, the other 490 are down more than 10%.
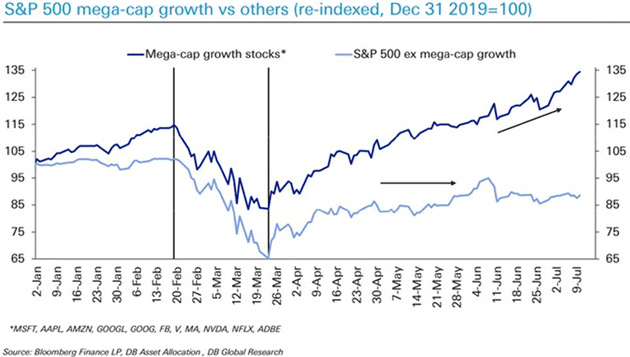
Chart via ZeroHedge
Europe has a similar phenomenon.
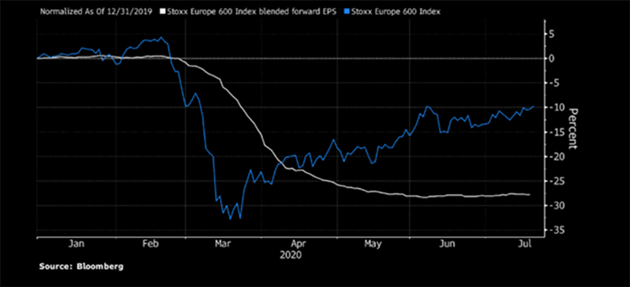
Chart: Bloomberg
If That Was a Bubble, What Is This?
Jesse Felder writes an amazing newsletter called The Felder Report. This is from his latest commentary.
Just three stocks make up more than 16% of the S&P 500 Index and over a third of the Nasdaq 100 Index. I bet you can guess which three. Apple, Amazon and Microsoft together are now valued at nearly $5 trillion. That’s larger than the entire economy of Germany and nearly the size of the Japanese economy.
What is really most astounding, though, is the aggregate valuation of these three behemoths relative to their free cash flow. Only at the peak of the Dotcom Mania did we see anything like it. The difference today is that these companies are growing free cash flow at a tiny fraction of the rate they grew it back then. If that was a bubble, then what is this?
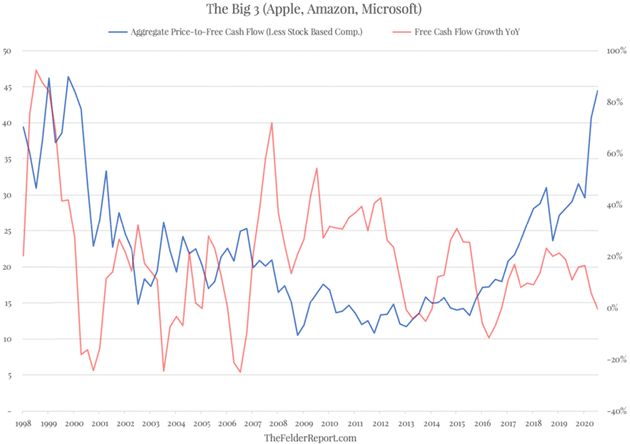
Chart: The Felder Report
About all you can say is “Wow.” These three stocks, larger than Germany, have separated from their free cash flow more than any time other than an outright bear market. If the concept of reversion to the mean holds, either their sales are getting ready to explode, or their stock prices are going to fall. Or some combination. These three stocks, in terms of free cash flow, are well more than three standard deviations above their average, and significantly more than even during the tech bubble.
We can’t talk about valuations without turning to old friend Ed Easterling of Crestmont Research. Where are we now and what are future returns likely to be? He takes us all the way back to 1900. [My comments in brackets.]
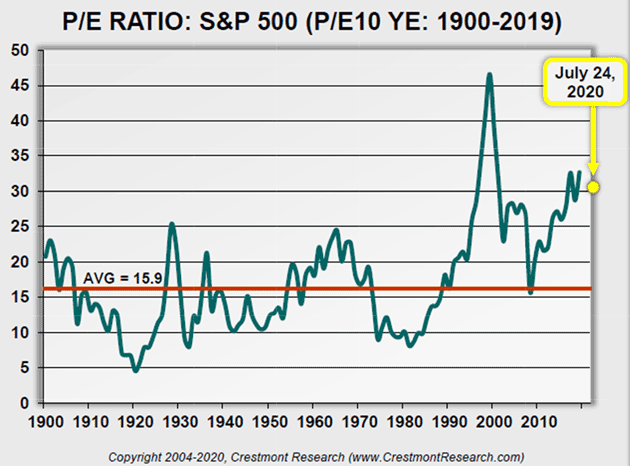
Crestmont P/E July 24, 2020: This is a basic chart of P/E. It includes the long-term average and a dot to update (and highlight) the current level of P/E in relation to history since 1900. Even though the market index is about the same level as it was at the start of the year, the CAPE P/E10 EPS (trailing 10-year real EPS) is up slightly over the past six months (mostly because recent EPS exceeds the periods at the start of the 10 years). [The only time this was exceeded was in the 1999–2000 dot-com bubble.]
Chart: Crestmont Research
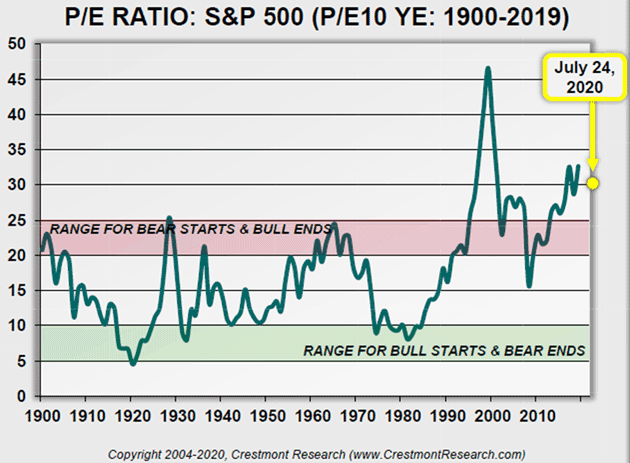
Crestmont P/E+ July 24, 2020: This is the basic chart of P/E with bands that reflect the typical starting and ending levels of P/E for secular stock market cycles. As reflected in the graph, we’re at levels that are well above the typical start of secular bears and well past the end of most secular bulls (except the tech bubble of 2000).
Chart: Crestmont Research
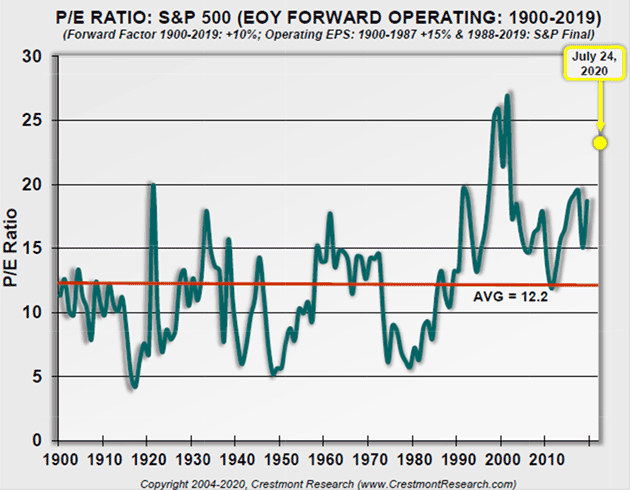
Crestmont OpsEPS P/E July 24, 2020: This is a Crestmont original. This chart provides P/E based upon forward, operating EPS. Wall Street bulls that want to make the market seem cheap often promote P/E in the most optimistic light. As you know, operating P/E is based upon a measure of earnings (for the denominator) that adds back a series of supposedly one-time charges to reported earnings (the EPS from which dividends are paid and capital is retained).
S&P has data for operating earnings back to 1988. Prior to that year, Crestmont built a series of comparable data using the historical relationship of operating earnings to reported earnings and a forward factor to reflect the typical relationship between forward earnings and trailing earnings.
Most often, the Wall Street bulls not only use a P/E based upon forward, operating earnings, they compare that value to the historical average for P/E based upon trailing, reported earnings. Yet, the difference in the averages is almost 4 points… 30%.
Chart: Crestmont Research
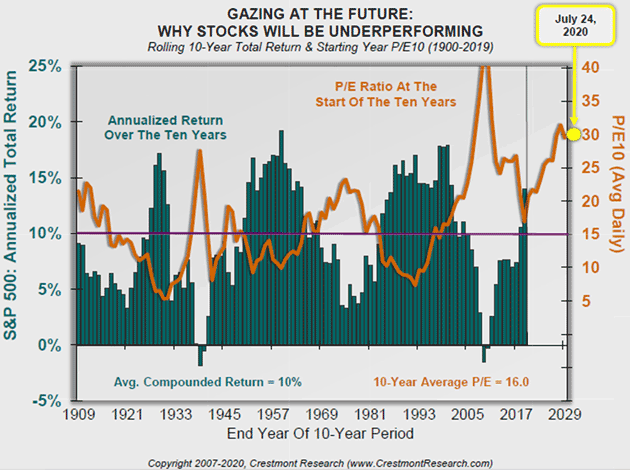
Crestmont Gazing July 24, 2020: This chart overlays stock market performance and valuation. The power of this chart is that it (1) demonstrates the strong effect that valuation has on future returns, and (2) provides a gaze at the future for likely returns over the next 10 years!
The line in the chart is valuation, as measured by P/E. The bars in the chart reflect the 10-year total return for the S&P 500 Index. The line is shifted forward 10 years so that the P/E aligned with each bar is the value for P/E at the start of the 10-year period.
Peaks in the line correspond to troughs in 10-year returns. Similarly, dips in the line correspond with peaks in 10-year returns. Valuation matters!
The rightmost bar on the chart is the period 2010–2019. P/E fell significantly in 2009, setting up the potential for great returns over the subsequent decade. The market delivered! Since then, P/E not only rose, it surged! The current level of P/E is very high, which portends a decade that will likely deliver low compounded returns.
The future bar under the end of the line (and dot marking July 2020) will reflect the cumulative compounded average return for 2020–2029. If history is a guide, and the principles of valuation remain true, a low single-digit percentage appears optimistic.
Chart: Crestmont Research
The next chart comes from Ned Davis Research via Steve Blumenthal. Notice that it shows the median price/earnings ratio is merely in the overvalued range, and nowhere near its all-time high. That means there’s still some historical room to run.
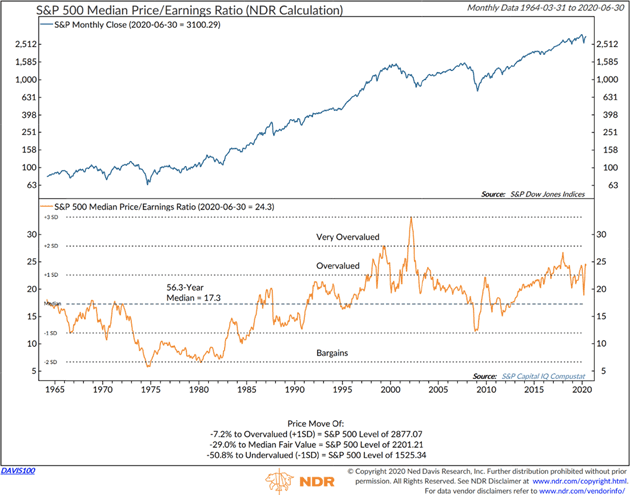
Chart: Ned Davis Research
Now let’s look at possible reasons why stocks are where they are today and why they could even go higher for longer than we might think. I think some of this shows a different perspective on the current mania. Little things add up.
Extra Cash
Back in March as the coronavirus spread in the US, organizations started cancelling large events. We didn’t know as much about the virus then but it was clear that crowds were hazardous. That includes sporting events.
On Wednesday, March 11, the National Basketball Association suspended its season after a player tested positive. But it was headed that direction anyway. Earlier the same day, the Golden State Warriors announced the team would play home games without fans present.
That was clearly the right move, health-wise, but it had a side effect no one considered at the time. Thousands of people who work for the teams and arenas, or in other related businesses, lost income. But sports gambling is a giant business in itself. The millions of people who wager billions of dollars suddenly had nothing to bet on. That proved important, for reasons we will see in a minute.
A few weeks later, Congress passed the bipartisan CARES Act which, among other things, gave most American adults a $1,200 one-time stimulus payment and added a $600 weekly federal payment to state unemployment benefits. This occurred as most of the country was in various levels of lockdown and many businesses closed. The payments were intended to help people through what we thought would be a short interruption.
All this happened very fast—so fast that it had to be simplified. Why not $500 or $700 for the unemployment benefit? I don’t know—but any number they chose would have been too little for some workers and more than enough for others.
As it turned out, the $600 from the federal government plus state benefits left many jobless workers making more than they did while working. This has helped. People are mostly making their rent and mortgage payments, for instance. Consumer spending held up better than expected, though its composition changed significantly.
Still, that left a lot of extra money in the hands of people accustomed to spending whatever they have. The lower-earning half of the population has little experience with saving or investing.
As noted above, sports betting was also unavailable. So where did all that money go?
Well, many of the recipients did what comes naturally: search online for advice. That led to data like this.
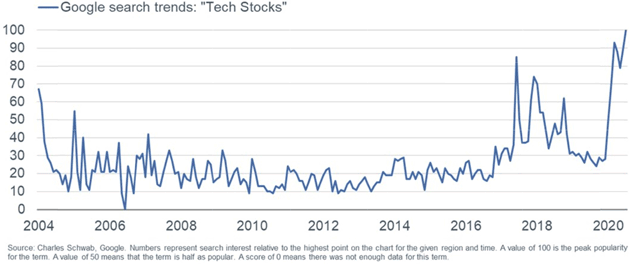
Source: Liz Ann Sonders
Of course, simply being interested in tech stocks, and having a few hundred or a few thousand extra dollars, only goes so far. You need some minimal amount of money just to open a brokerage account. Or at least, you used to.
Enter Robin Hood
Financial markets have been slowly “democratizing” for decades. In the 1960s, mutual funds gave the middle class a convenient way to own a diversified stock portfolio. Then came many more mutual funds, discount brokers, exchange-traded funds, and other innovations. All had the same effect: More people could invest more money in more kinds of markets.
Now we have a new stage in that process: commission-free stock trading, quickly accessible over the mobile device you already have, and in small amounts. Apps like Robinhood make investing simple and affordable. They do the same for day trading. But while they simplify the process, you still have to make the right decisions at the right time.
So now we have large numbers of small, inexperienced investors with spare cash from the government and an app in their pockets that looks a lot like a video game. And then there’s the sports connection, personified by now-famous blogger Dave Portnoy, who colorfully insists stocks can only go up and urges his large audience (which includes many idled sports bettors) to throw more money into the market. What could go wrong?
So far, not much. Portnoy has been largely right about stocks this year. His audience is fairly small but it’s big enough to matter. They are a subset of the red and pink areas in this personal income chart.
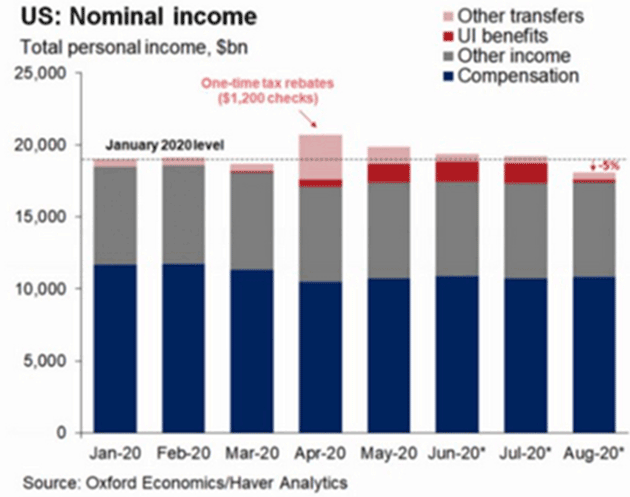
Chart: Gregory Daco
Recall, markets were very weak early in the corona crisis. February and March were volatile with several mini-crashes. But the benchmark indexes bottomed just as the CARES Act passed and the government began distributing stimulus cash in April. They’ve kept rising since then.
The payments to individuals were only the start. At the same time, we had the Federal Reserve pumping huge amounts into not just Treasury and agency securities but also various private assets, including corporate bonds. But the specifics of what they bought are not so important. The salient point is the cash they injected into markets, which found its way to other assets.
So, the current bull market is a kind of perfect cash flow storm. We have…
-
Legions of new investors using stimulus money to buy whatever makes them feel good
-
Bored gamblers looking for action, and
-
Large institutions brimming with Fed liquidity
-
plus traders of all sizes, small investors to monster hedge funds, chasing momentum—a perfect witches’ brew
… all in the context of ultra-low interest rates that make cash and fixed-income holdings unattractive. You could not have designed a better perfect storm in which to create a market mania, and that’s exactly what we have.
If this were all Fed-driven, we would still be seeing a bull market but it would be different. Institutional investors consider fundamental factors like valuation and earnings. They wouldn’t plunge a lot of money into small-cap cannabis stocks, for instance.
For the moment, the all-in strategy seems to be working better than the cautious one. Yet history shows fundamentals eventually matter, and many of today’s buyers probably won’t like what happens.
Here’s another chart from Doug Short and Jill Mislinski, calculated as of July 6, 2020.
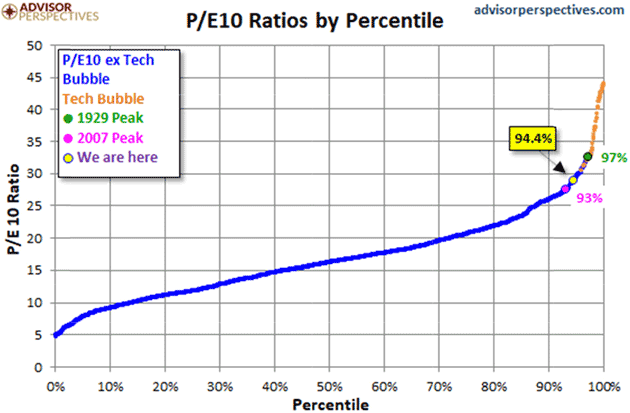
Source: Advisor Perspectives
We see here that the S&P 500 P/E10 is presently higher than it has been 94.4% of past periods. Stocks are in the zone (and not just in the zone, but high in it) where Easterling shows above-average returns are unlikely. It is above the 2007 peak and approaching the 1929 peak. The only higher points were during the 1990s Tech Bubble.
Now, think back to that Google search data I showed above. Interest in tech stocks is again extraordinarily high. History rarely repeats so nicely, but it sure looks like we may be in Tech Bubble II (plus Mastercard and Visa).
At the very least, now looks like a terrible time to buy stocks if your intent is to hold them a long time. If your intent is to buy high and hope to sell even higher, good luck to you. It might work. History also shows manias can persist much longer than most people think. Back in 1999, I and many others thought there was no way the bull market could go on. Yet it did, with the Nasdaq actually doubling in 1999.
Triggered Market
Overvalued markets don’t turn down on their own. Something usually triggers them. What could it be this time?
In the medical world, stimulants have legitimate uses but the dosage is critical. Too little and you don’t get the desired effect. Too much can cause great harm. And once you find the right dosage, suddenly stopping it can be dangerous.
As of this morning, the added unemployment is still set to expire at month-end. Negotiations are underway so maybe we’ll know more later this weekend or next week. But what happens when/if that stimulus goes away?
We should by now realize jobs are not going to come back to where they were a mere six months ago. We will still be in recession-level unemployment well into next year. The rest of the world is reeling. Those earnings projections that we looked at above? For the most part, they are going to be wildly wrong.
Eventually, earnings matter. Now, also eventually, we will get a vaccine or herd immunity. We will begin to come out from our isolation cells. But the world will look significantly different, and businesses, from the very smallest to the very largest, will have to adjust. That means earnings are going to have to adjust.
The world is getting ready to be repriced. Everything is going to seek a new value. Real estate, stocks, commodities, food, medical costs, college costs, government, entertainment, sporting events, clothes… Everything. Some price adjustments will be minor and some will be significant. I expect many to be deflationary, although some markets and items will see significant price increases.
“Inflation” in the general sense might be very difficult to calculate and even more difficult to understand. Your personal inflation rate will depend on what you buy. If you are trading the markets, I would tighten your stops. I firmly believe you’re going to have a much better and significantly lower entry point in the future.
* * *
Click here to get Thoughts from the Frontline in your inbox every Saturday.
Spread & Containment
The Coming Of The Police State In America
The Coming Of The Police State In America
Authored by Jeffrey Tucker via The Epoch Times,
The National Guard and the State Police are now…
Share this:


Authored by Jeffrey Tucker via The Epoch Times,
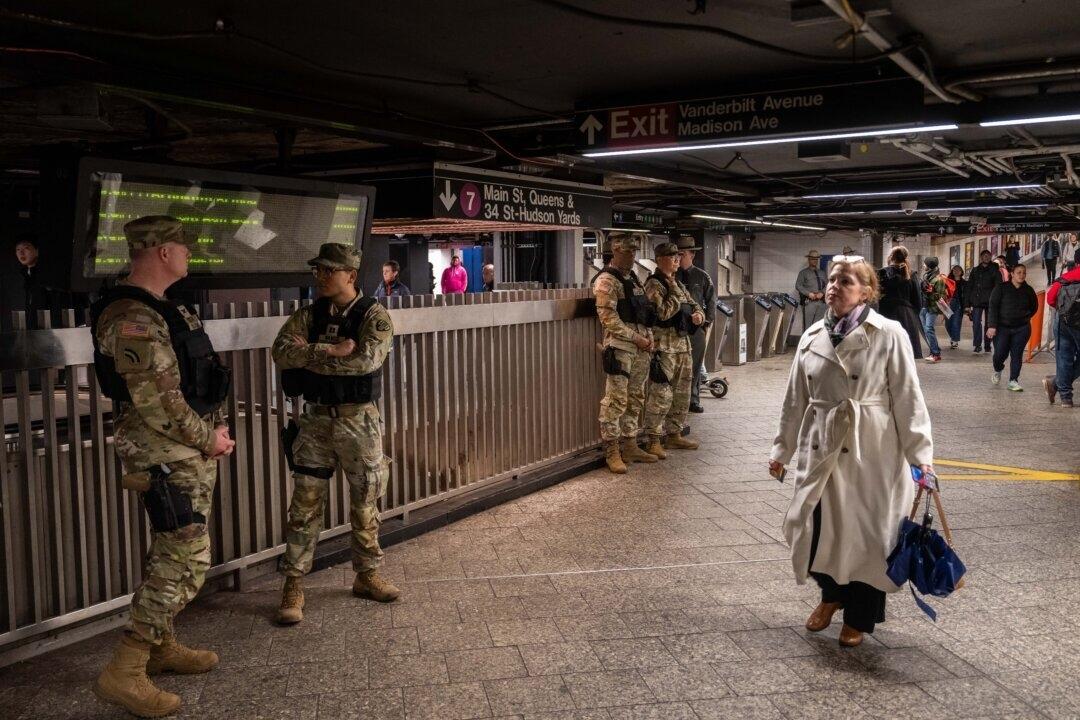
The National Guard and the State Police are now patrolling the New York City subway system in an attempt to do something about the explosion of crime. As part of this, there are bag checks and new surveillance of all passengers. No legislation, no debate, just an edict from the mayor.
Many citizens who rely on this system for transportation might welcome this. It’s a city of strict gun control, and no one knows for sure if they have the right to defend themselves. Merchants have been harassed and even arrested for trying to stop looting and pillaging in their own shops.
The message has been sent: Only the police can do this job. Whether they do it or not is another matter.
Things on the subway system have gotten crazy. If you know it well, you can manage to travel safely, but visitors to the city who take the wrong train at the wrong time are taking grave risks.
In actual fact, it’s guaranteed that this will only end in confiscating knives and other things that people carry in order to protect themselves while leaving the actual criminals even more free to prey on citizens.
The law-abiding will suffer and the criminals will grow more numerous. It will not end well.
When you step back from the details, what we have is the dawning of a genuine police state in the United States. It only starts in New York City. Where is the Guard going to be deployed next? Anywhere is possible.
If the crime is bad enough, citizens will welcome it. It must have been this way in most times and places that when the police state arrives, the people cheer.
We will all have our own stories of how this came to be. Some might begin with the passage of the Patriot Act and the establishment of the Department of Homeland Security in 2001. Some will focus on gun control and the taking away of citizens’ rights to defend themselves.
My own version of events is closer in time. It began four years ago this month with lockdowns. That’s what shattered the capacity of civil society to function in the United States. Everything that has happened since follows like one domino tumbling after another.
It goes like this:
1) lockdown,
2) loss of moral compass and spreading of loneliness and nihilism,
3) rioting resulting from citizen frustration, 4) police absent because of ideological hectoring,
5) a rise in uncontrolled immigration/refugees,
6) an epidemic of ill health from substance abuse and otherwise,
7) businesses flee the city
8) cities fall into decay, and that results in
9) more surveillance and police state.
The 10th stage is the sacking of liberty and civilization itself.
It doesn’t fall out this way at every point in history, but this seems like a solid outline of what happened in this case. Four years is a very short period of time to see all of this unfold. But it is a fact that New York City was more-or-less civilized only four years ago. No one could have predicted that it would come to this so quickly.
But once the lockdowns happened, all bets were off. Here we had a policy that most directly trampled on all freedoms that we had taken for granted. Schools, businesses, and churches were slammed shut, with various levels of enforcement. The entire workforce was divided between essential and nonessential, and there was widespread confusion about who precisely was in charge of designating and enforcing this.
It felt like martial law at the time, as if all normal civilian law had been displaced by something else. That something had to do with public health, but there was clearly more going on, because suddenly our social media posts were censored and we were being asked to do things that made no sense, such as mask up for a virus that evaded mask protection and walk in only one direction in grocery aisles.
Vast amounts of the white-collar workforce stayed home—and their kids, too—until it became too much to bear. The city became a ghost town. Most U.S. cities were the same.
As the months of disaster rolled on, the captives were let out of their houses for the summer in order to protest racism but no other reason. As a way of excusing this, the same public health authorities said that racism was a virus as bad as COVID-19, so therefore it was permitted.
The protests had turned to riots in many cities, and the police were being defunded and discouraged to do anything about the problem. Citizens watched in horror as downtowns burned and drug-crazed freaks took over whole sections of cities. It was like every standard of decency had been zapped out of an entire swath of the population.
Meanwhile, large checks were arriving in people’s bank accounts, defying every normal economic expectation. How could people not be working and get their bank accounts more flush with cash than ever? There was a new law that didn’t even require that people pay rent. How weird was that? Even student loans didn’t need to be paid.
By the fall, recess from lockdown was over and everyone was told to go home again. But this time they had a job to do: They were supposed to vote. Not at the polling places, because going there would only spread germs, or so the media said. When the voting results finally came in, it was the absentee ballots that swung the election in favor of the opposition party that actually wanted more lockdowns and eventually pushed vaccine mandates on the whole population.
The new party in control took note of the large population movements out of cities and states that they controlled. This would have a large effect on voting patterns in the future. But they had a plan. They would open the borders to millions of people in the guise of caring for refugees. These new warm bodies would become voters in time and certainly count on the census when it came time to reapportion political power.
Meanwhile, the native population had begun to swim in ill health from substance abuse, widespread depression, and demoralization, plus vaccine injury. This increased dependency on the very institutions that had caused the problem in the first place: the medical/scientific establishment.
The rise of crime drove the small businesses out of the city. They had barely survived the lockdowns, but they certainly could not survive the crime epidemic. This undermined the tax base of the city and allowed the criminals to take further control.
The same cities became sanctuaries for the waves of migrants sacking the country, and partisan mayors actually used tax dollars to house these invaders in high-end hotels in the name of having compassion for the stranger. Citizens were pushed out to make way for rampaging migrant hordes, as incredible as this seems.
But with that, of course, crime rose ever further, inciting citizen anger and providing a pretext to bring in the police state in the form of the National Guard, now tasked with cracking down on crime in the transportation system.
What’s the next step? It’s probably already here: mass surveillance and censorship, plus ever-expanding police power. This will be accompanied by further population movements, as those with the means to do so flee the city and even the country and leave it for everyone else to suffer.
As I tell the story, all of this seems inevitable. It is not. It could have been stopped at any point. A wise and prudent political leadership could have admitted the error from the beginning and called on the country to rediscover freedom, decency, and the difference between right and wrong. But ego and pride stopped that from happening, and we are left with the consequences.
The government grows ever bigger and civil society ever less capable of managing itself in large urban centers. Disaster is unfolding in real time, mitigated only by a rising stock market and a financial system that has yet to fall apart completely.
Are we at the middle stages of total collapse, or at the point where the population and people in leadership positions wise up and decide to put an end to the downward slide? It’s hard to know. But this much we do know: There is a growing pocket of resistance out there that is fed up and refuses to sit by and watch this great country be sacked and taken over by everything it was set up to prevent.
Spread & Containment
Another beloved brewery files Chapter 11 bankruptcy
The beer industry has been devastated by covid, changing tastes, and maybe fallout from the Bud Light scandal.
Share this:


Before the covid pandemic, craft beer was having a moment. Most cities had multiple breweries and taprooms with some having so many that people put together the brewery version of a pub crawl.
It was a period where beer snobbery ruled the day and it was not uncommon to hear bar patrons discuss the makeup of the beer the beer they were drinking. This boom period always seemed destined for failure, or at least a retraction as many markets seemed to have more craft breweries than they could support.
Related: Fast-food chain closes more stores after Chapter 11 bankruptcy
The pandemic, however, hastened that downfall. Many of these local and regional craft breweries counted on in-person sales to drive their business.
And while many had local and regional distribution, selling through a third party comes with much lower margins. Direct sales drove their business and the pandemic forced many breweries to shut down their taprooms during the period where social distancing rules were in effect.
During those months the breweries still had rent and employees to pay while little money was coming in. That led to a number of popular beermakers including San Francisco's nationally-known Anchor Brewing as well as many regional favorites including Chicago’s Metropolitan Brewing, New Jersey’s Flying Fish, Denver’s Joyride Brewing, Tampa’s Zydeco Brew Werks, and Cleveland’s Terrestrial Brewing filing bankruptcy.
Some of these brands hope to survive, but others, including Anchor Brewing, fell into Chapter 7 liquidation. Now, another domino has fallen as a popular regional brewery has filed for Chapter 11 bankruptcy protection.
Image source: Shutterstock
Covid is not the only reason for brewery bankruptcies
While covid deserves some of the blame for brewery failures, it's not the only reason why so many have filed for bankruptcy protection. Overall beer sales have fallen driven by younger people embracing non-alcoholic cocktails, and the rise in popularity of non-beer alcoholic offerings,
Beer sales have fallen to their lowest levels since 1999 and some industry analysts
"Sales declined by more than 5% in the first nine months of the year, dragged down not only by the backlash and boycotts against Anheuser-Busch-owned Bud Light but the changing habits of younger drinkers," according to data from Beer Marketer’s Insights published by the New York Post.
Bud Light parent Anheuser Busch InBev (BUD) faced massive boycotts after it partnered with transgender social media influencer Dylan Mulvaney. It was a very small partnership but it led to a right-wing backlash spurred on by Kid Rock, who posted a video on social media where he chastised the company before shooting up cases of Bud Light with an automatic weapon.
Another brewery files Chapter 11 bankruptcy
Gizmo Brew Works, which does business under the name Roth Brewing Company LLC, filed for Chapter 11 bankruptcy protection on March 8. In its filing, the company checked the box that indicates that its debts are less than $7.5 million and it chooses to proceed under Subchapter V of Chapter 11.
"Both small business and subchapter V cases are treated differently than a traditional chapter 11 case primarily due to accelerated deadlines and the speed with which the plan is confirmed," USCourts.gov explained.
Roth Brewing/Gizmo Brew Works shared that it has 50-99 creditors and assets $100,000 and $500,000. The filing noted that the company does expect to have funds available for unsecured creditors.
The popular brewery operates three taprooms and sells its beer to go at those locations.
"Join us at Gizmo Brew Works Craft Brewery and Taprooms located in Raleigh, Durham, and Chapel Hill, North Carolina. Find us for entertainment, live music, food trucks, beer specials, and most importantly, great-tasting craft beer by Gizmo Brew Works," the company shared on its website.
The company estimates that it has between $1 and $10 million in liabilities (a broad range as the bankruptcy form does not provide a space to be more specific).
Gizmo Brew Works/Roth Brewing did not share a reorganization or funding plan in its bankruptcy filing. An email request for comment sent through the company's contact page was not immediately returned.
bankruptcy pandemic social distancing
Government
Students lose out as cities and states give billions in property tax breaks to businesses − draining school budgets and especially hurting the poorest students
An estimated 95% of US cities provide economic development tax incentives to woo corporate investors, taking billions away from schools.
Share this:


Built in 1910, James Elementary is a three-story brick school in Kansas City, Missouri’s historic Northeast neighborhood, with a bright blue front door framed by a sand-colored stone arch adorned with a gargoyle. As bustling students and teachers negotiate a maze of gray stairs with worn wooden handrails, Marjorie Mayes, the school’s principal, escorts a visitor across uneven blue tile floors on the ground floor to a classroom with exposed brick walls and pipes. Bubbling paint mars some walls, evidence of the water leaks spreading inside the aging building.
“It’s living history,” said Mayes during a mid-September tour of the building. “Not the kind of living history we want.”
The district would like to tackle the US$400 million in deferred maintenance needed to create a 21st century learning environment at its 35 schools – including James Elementary – but it can’t. It doesn’t have the money.
Property tax redirect
The lack of funds is a direct result of the property tax breaks that Kansas City lavishes on companies and developers that do business there. The program is supposed to bring in new jobs and business but instead has ended up draining civic coffers and starving schools. Between 2017 and 2023, the Kansas City school district lost $237.3 million through tax abatements.
Kansas City is hardly an anomaly. An estimated 95% of U.S. cities provide economic development tax incentives to woo corporate investors. The upshot is that billions have been diverted from large urban school districts and from a growing number of small suburban and rural districts. The impact is seen in districts as diverse as Chicago and Cleveland, Hillsboro, Oregon, and Storey County, Nevada.
The result? A 2021 review of 2,498 financial statements from school districts across 27 states revealed that, in 2019 alone, at least $2.4 billion was diverted to fund tax incentives. Yet that substantial figure still downplays the magnitude of the problem, because three-quarters of the 10,370 districts analyzed did not provide any information on tax abatement agreements.
Tax abatement programs have long been controversial, pitting states and communities against one another in beggar-thy-neighbor contests. Their economic value is also, at best, unclear: Studies show most companies would have made the same location decision without taxpayer subsidies. Meanwhile, schools make up the largest cost item in these communities, meaning they suffer most when companies are granted breaks in property taxes.
A three-month investigation by The Conversation and three scholars with expertise in economic development, tax laws and education policy shows that the cash drain from these programs is not equally shared by schools in the same communities. At the local level, tax abatements and exemptions often come at the cost of critical funding for school districts that disproportionately serve students from low-income households and who are racial minorities.
In Missouri, for example, in 2022 nearly $1,700 per student was redirected from Kansas City public and charter schools, while between $500 and $900 was redirected from wealthier, whiter Northland schools on the north side of the river in Kansas City and in the suburbs beyond. Other studies have found similar demographic trends elsewhere, including New York state, South Carolina and Columbus, Ohio.
The funding gaps produced by abated money often force schools to delay needed maintenance, increase class sizes, lay off teachers and support staff and even close outright. Schools also struggle to update or replace outdated technology, books and other educational resources. And, amid a nationwide teacher shortage, schools under financial pressures sometimes turn to inexperienced teachers who are not fully certified or rely too heavily on recruits from overseas who have been given special visa status.
Lost funding also prevents teachers and staff, who often feed, clothe and otherwise go above and beyond to help students in need, from earning a living wage. All told, tax abatements can end up harming a community’s value, with constant funding shortfalls creating a cycle of decline.
Incentives, payoffs and guarantees
Perversely, some of the largest beneficiaries of tax abatements are the politicians who publicly boast of handing out the breaks despite the harm to poorer communities. Incumbent governors have used the incentives as a means of taking credit for job creation, even when the jobs were coming anyway.
“We know that subsidies don’t work,” said Elizabeth Marcello, a doctoral lecturer at Hunter College who studies governmental planning and policy and the interactions between state and local governments. “But they are good political stories, and I think that’s why politicians love them so much.”
While some voters may celebrate abatements, parents can recognize the disparities between school districts that are created by the tax breaks. Fairleigh Jackson pointed out that her daughter’s East Baton Rouge third grade class lacks access to playground equipment.
The class is attending school in a temporary building while their elementary school undergoes a two-year renovation.
The temporary site has some grass and a cement slab where kids can play, but no playground equipment, Jackson said. And parents needed to set up an Amazon wish list to purchase basic equipment such as balls, jump ropes and chalk for students to use. The district told parents there would be no playground equipment due to a lack of funds, then promised to install equipment, Jackson said, but months later, there is none.

Jackson said it’s hard to complain when other schools in the district don’t even have needed security measures in place. “When I think about playground equipment, I think that’s a necessary piece of child development,” Jackson said. “Do we even advocate for something that should be a daily part of our kids’ experience when kids’ safety isn’t being funded?”
Meanwhile, the challenges facing administrators 500-odd miles away at Atlanta Public Schools are nothing if not formidable: The district is dealing with chronic absenteeism among half of its Black students, many students are experiencing homelessness, and it’s facing a teacher shortage.
At the same time, Atlanta is showering corporations with tax breaks. The city has two bodies that dole them out: the Development Authority of Fulton County, or DAFC, and Invest Atlanta, the city’s economic development agency. The deals handed out by the two agencies have drained $103.8 million from schools from fiscal 2017 to 2022, according to Atlanta school system financial statements.
What exactly Atlanta and other cities and states are accomplishing with tax abatement programs is hard to discern. Fewer than a quarter of companies that receive breaks in the U.S. needed an incentive to invest, according to a 2018 study by the Upjohn Institute for Employment Research, a nonprofit research organization.
This means that at least 75% of companies received tax abatements when they’re not needed – with communities paying a heavy price for economic development that sometimes provides little benefit.
In Kansas City, for example, there’s no guarantee that the businesses that do set up shop after receiving a tax abatement will remain there long term. That’s significant considering the historic border war between the Missouri and Kansas sides of Kansas City – a competition to be the most generous to the businesses, said Jason Roberts, president of the Kansas City Federation of Teachers and School-Related Personnel. Kansas City, Missouri, has a 1% income tax on people who work in the city, so it competes for as many workers as possible to secure that earnings tax, Roberts said.
Under city and state tax abatement programs, companies that used to be in Kansas City have since relocated. The AMC Theaters headquarters, for example, moved from the city’s downtown to Leawood, Kansas, about a decade ago, garnering some $40 million in Promoting Employment Across Kansas tax incentives.
Roberts said that when one side’s financial largesse runs out, companies often move across the state line – until both states decided in 2019 that enough was enough and declared a cease-fire.
But tax breaks for other businesses continue. “Our mission is to grow the economy of Kansas City, and application of tools such as tax exemptions are vital to achieving that mission, said Jon Stephens, president and CEO of Port KC, the Kansas City Port Authority. The incentives speed development, and providing them "has resulted in growth choosing KC versus other markets,” he added.
In Atlanta, those tax breaks are not going to projects in neighborhoods that need help attracting development. They have largely been handed out to projects that are in high demand areas of the city, said Julian Bene, who served on Invest Atlanta’s board from 2010 to 2018. In 2019, for instance, the Fulton County development authority approved a 10-year, $16 million tax abatement for a 410-foot-tall, 27,000-square-foot tower in Atlanta’s vibrant Midtown business district. The project included hotel space, retail space and office space that is now occupied by Google and Invesco.
In 2021, a developer in Atlanta pulled its request for an $8 million tax break to expand its new massive, mixed-use Ponce City Market development in the trendy Beltline neighborhood with an office tower and apartment building. Because of community pushback, the developer knew it likely did not have enough votes from the commission for approval, Bene said. After a second try for $5 million in lower taxes was also rejected, the developer went ahead and built the project anyway.
Invest Atlanta has also turned down projects in the past, Bene said. Oftentimes, after getting rejected, the developer goes back to the landowner and asks for a better price to buy the property to make their numbers work, because it was overvalued at the start.
Trouble in Philadelphia
On Thursday, Oct. 26, 2023, an environmental team was preparing Southwark School in Philadelphia for the winter cold. While checking an attic fan, members of the team saw loose dust on top of flooring that contained asbestos. The dust that certainly was blowing into the floors below could contain the cancer-causing agent. Within a day, Southwark was closed – the seventh Philadelphia school temporarily shuttered since the previous academic year because of possible asbestos contamination.
A 2019 inspection of the John L Kinsey school in Philadelphia found asbestos in plaster walls, floor tiles, radiator insulation and electrical panels. Asbestos is a major problem for Philadelphia’s public schools. The district needs $430 million to clean up the asbestos, lead, and other environmental hazards that place the health of students, teachers and staff at risk. And that is on top of an additional $2.4 billion to fix failing and damaged buildings.
Yet the money is not available. Matthew Stem, a former district official, testified in a 2023 lawsuit about financing of Pennsylvania schools that the environmental health risks cannot be addressed until an emergency like at Southwark because “existing funding sources are not sufficient to remediate those types of issues.”
Meanwhile, the city keeps doling out abatements, draining money that could have gone toward making Philadelphia schools safer. In the fiscal year ending June 2022, such tax breaks cost the school district $118 million – more than 25% of the total amount needed to remove the asbestos and other health dangers. These abatements take 31 years to break even, according to the city’s own scenario impact analyses.
Huge subsets of the community – primarily Black, Brown, poor or a combination – are being “drastically impacted” by the exemptions and funding shortfalls for the school district, said Kendra Brooks, a Philadelphia City Council member. Schools and students are affected by mold, asbestos and lead, and crumbling infrastructure, as well as teacher and staffing shortages – including support staff, social workers and psychologists.
More than half the district’s schools that lacked adequate air conditioning – 87 schools – had to go to half days during the first week of the 2023 school year because of extreme heat. Poor heating systems also leave the schools cold in the winter. And some schools are overcrowded, resulting in large class sizes, she said.

Teachers and researchers agree that a lack of adequate funding undermines educational opportunities and outcomes. That’s especially true for children living in poverty. A 2016 study found that a 10% increase in per-pupil spending each year for all 12 years of public schooling results in nearly one-third of a year of more education, 7.7% higher wages and a 3.2% reduction in annual incidence of adult poverty. The study estimated that a 21.7% increase could eliminate the high school graduation gap faced by children from low-income families.
More money for schools leads to more education resources for students and their teachers. The same researchers found that spending increases were associated with reductions in student-to-teacher ratios, increases in teacher salaries and longer school years. Other studies yielded similar results: School funding matters, especially for children already suffering the harms of poverty.
While tax abatements themselves are generally linked to rising property values, the benefits are not evenly distributed. In fact, any expansion of the tax base due to new property construction tends to be outside of the county granting the tax abatement. For families in school districts with the lost tax revenues, their neighbors’ good fortune likely comes as little solace. Meanwhile, a poorly funded education system is less likely to yield a skilled and competitive workforce, creating longer-term economic costs that make the region less attractive for businesses and residents.
“There’s a head-on collision here between private gain and the future quality of America’s workforce,” said Greg LeRoy, executive director at Good Jobs First, a Washington, D.C., advocacy group that’s critical of tax abatement and tracks the use of economic development subsidies.

As funding dwindles and educational quality declines, additional families with means often opt for alternative educational avenues such as private schooling, home-schooling or moving to a different school district, further weakening the public school system.
Throughout the U.S., parents with the power to do so demand special arrangements, such as selective schools or high-track enclaves that hire experienced, fully prepared teachers. If demands aren’t met, they leave the district’s public schools for private schools or for the suburbs. Some parents even organize to splinter their more advantaged, and generally whiter, neighborhoods away from the larger urban school districts.
Those parental demands – known among scholars as “opportunity hoarding” – may seem unreasonable from the outside, but scarcity breeds very real fears about educational harms inflicted on one’s own children. Regardless of who’s to blame, the children who bear the heaviest burden of the nation’s concentrated poverty and racialized poverty again lose out.
Rethinking in Philadelphia and Riverhead
Americans also ask public schools to accomplish Herculean tasks that go far beyond the education basics, as many parents discovered at the onset of the pandemic when schools closed and their support for families largely disappeared.
A school serving students who endure housing and food insecurity must dedicate resources toward children’s basic needs and trauma. But districts serving more low-income students spend less per student on average, and almost half the states have regressive funding structures.
Facing dwindling resources for schools, several cities have begun to rethink their tax exemption programs.
The Philadelphia City Council recently passed a scale-back on a 10-year property tax abatement by decreasing the percentage of the subsidy over that time. But even with that change, millions will be lost to tax exemptions that could instead be invested in cash-depleted schools. “We could make major changes in our schools’ infrastructure, curriculum, staffing, staffing ratios, support staff, social workers, school psychologists – take your pick,” Brooks said.
Other cities looking to reform tax abatement programs are taking a different approach. In Riverhead, New York, on Long Island, developers or project owners can be granted exemptions on their property tax and allowed instead to shell out a far smaller “payment in lieu of taxes,” or PILOT. When the abatement ends, most commonly after 10 years, the businesses then will pay full property taxes.
At least, that’s the idea, but the system is far from perfect. Beneficiaries of the PILOT program have failed to pay on time, leaving the school board struggling to fill a budget hole. Also, the payments are not equal to the amount they would receive for property taxes, with millions of dollars in potential revenue over a decade being cut to as little as a few hundred thousand. On the back end, if a business that’s subsidized with tax breaks fails after 10 years, the projected benefits never emerge.
And when the time came to start paying taxes, developers have returned to the city’s Industrial Development Agency with hat in hand, asking for more tax breaks. A local for-profit aquarium, for example, was granted a 10-year PILOT program break by Riverhead in 1999; it has received so many extensions that it is not scheduled to start paying full taxes until 2031 – 22 years after originally planned.
Kansas City border politics
Like many cities, Kansas City has a long history of segregation, white flight and racial redlining, said Kathleen Pointer, senior policy strategist for Kansas City Public Schools.

Troost Avenue, where the Kansas City Public Schools administrative office is located, serves as the city’s historic racial dividing line, with wealthier white families living in the west and more economically disadvantaged people of color in the east. Most of the district’s schools are located east of Troost, not west.
Students on the west side “pretty much automatically funnel into the college preparatory middle school and high schools,” said The Federation of Teachers’ Roberts. Those schools are considered signature schools that are selective and are better taken care of than the typical neighborhood schools, he added.
The school district’s tax levy was set by voters in 1969 at 3.75%. But successive attempts over the next few decades to increase the levy at the ballot box failed. During a decadeslong desegregation lawsuit that was eventually resolved through a settlement agreement in the 1990s, a court raised the district’s levy rate to 4.96% without voter approval. The levy has remained at the same 4.96% rate since.
Meanwhile, Kansas City is still distributing 20-year tax abatements to companies and developers for projects. The district calculated that about 92% of the money that was abated within the school district’s boundaries was for projects within the whiter west side of the city, Pointer said.
“Unfortunately, we can’t pick or choose where developers build,” said Meredith Hoenes, director of communications for Port KC. “We aren’t planning and zoning. Developers typically have plans in place when they knock on our door.”
In Kansas City, several agencies administer tax incentives, allowing developers to shop around to different bodies to receive one. Pointer said he believes the Port Authority is popular because they don’t do a third-party financial analysis to prove that the developers need the amount that they say they do.
With 20-year abatements, a child will start pre-K and graduate high school before seeing the benefits of a property being fully on the tax rolls, Pointer said. Developers, meanwhile, routinely threaten to build somewhere else if they don’t get the incentive, she said.
In 2020, BlueScope Construction, a company that had received tax incentives for nearly 20 years and was about to roll off its abatement, asked for another 13 years and threatened to move to another state if it didn’t get it. At the time, the U.S. was grappling with a racial reckoning following the murder of George Floyd, who was killed by a Minneapolis police officer.
“That was a moment for Kansas City Public Schools where we really drew a line in the sand and talked about incentives as an equity issue,” Pointer said.
After the district raised the issue – tying the incentives to systemic racism – the City Council rejected BlueScope’s bid and, three years later, it’s still in Kansas City, fully on the tax rolls, she said. BlueScope did not return multiple requests for comment.
Recently, a multifamily housing project was approved for a 20-year tax abatement by the Port Authority of Kansas City at Country Club Plaza, an outdoor shopping center in an affluent part of the city. The housing project included no affordable units. “This project was approved without any independent financial analysis proving that it needed that subsidy,” Pointer said.
All told, the Kansas City Public Schools district faces several shortfalls beyond the $400 million in deferred maintenance, Superintendent Jennifer Collier said. There are staffing shortages at all positions: teachers, paraprofessionals and support staff. As in much of the U.S., the cost of housing is surging. New developments that are being built do not include affordable housing, or when they do, the units are still out of reach for teachers.
That’s making it harder for a district that already loses about 1 in 5 of its teachers each year to keep or recruit new ones, who earn an average of only $46,150 their first year on the job, Collier said.
East Baton Rouge and the industrial corridor
It’s impossible to miss the tanks, towers, pipes and industrial structures that incongruously line Baton Rouge’s Scenic Highway landscape. They’re part of Exxon Mobil Corp.’s campus, home of the oil giant’s refinery in addition to chemical and plastics plants.

Sitting along the Mississippi River, the campus has been a staple of Louisiana’s capital for over 100 years. It’s where 6,000 employees and contractors who collectively earn over $400 million annually produce 522,000 barrels of crude oil per day when at full capacity, as well as the annual production and manufacture of 3 billion pounds of high-density polyethylene and polypropylene and 6.6 billion pounds of petrochemical products. The company posted a record-breaking $55.7 billion in profits in 2022 and $36 billion in 2023.
Across the street are empty fields and roads leading into neighborhoods that have been designated by the U.S. Department of Agriculture as a low-income food desert. A mile drive down the street to Route 67 is a Dollar General, fast-food restaurants, and tiny, rundown food stores. A Hi Nabor Supermarket is 4 miles away.
East Baton Rouge Parish’s McKinley High School, a 12-minute drive from the refinery, serves a student body that is about 80% Black and 85% poor. The school, which boasts famous alums such as rapper Kevin Gates, former NBA player Tyrus Thomas and Presidential Medal of Freedom recipient Gardner C. Taylor, holds a special place in the community, but it has been beset by violence and tragedy lately. Its football team quarterback, who was killed days before graduation in 2017, was among at least four of McKinley’s students who have been shot or murdered over the past six years.
The experience is starkly different at some of the district’s more advantaged schools, including its magnet programs open to high-performing students.

Baton Rouge is a tale of two cities, with some of the worst outcomes in the state for education, income and mortality, and some of the best outcomes. “It was only separated by sometimes a few blocks,” said Edgar Cage, the lead organizer for the advocacy group Together Baton Rouge. Cage, who grew up in the city when it was segregated by Jim Crow laws, said the root cause of that disparity was racism.
“Underserved kids don’t have a path forward” in East Baton Rouge public schools, Cage said.
A 2019 report from the Urban League of Louisiana found that economically disadvantaged African American and Hispanic students are not provided equitable access to high-quality education opportunities. That has contributed to those students underperforming on standardized state assessments, such as the LEAP exam, being unprepared to advance to higher grades and being excluded from high-quality curricula and instruction, as well as the highest-performing schools and magnet schools.
“Baton Rouge is home to some of the highest performing schools in the state,” according to the report. “Yet the highest performing schools and schools that have selective admissions policies often exclude disadvantaged students and African American and Hispanic students.”
Dawn Collins, who served on the district’s school board from 2016 to 2022, said that with more funding, the district could provide more targeted interventions for students who were struggling academically or additional support to staff so they can better assist students with greater needs.
But for decades, Louisiana’s Industrial Ad Valorem Tax Exemption Program, or ITEP, allowed for 100% property tax exemptions for industrial manufacturing facilities, said Erin Hansen, the statewide policy analyst at Together Louisiana, a network of 250 religious and civic organizations across the state that advocates for grassroots issues, including tax fairness.
The ITEP program was created in the 1930s through a state constitutional amendment, allowing companies to bypass a public vote and get approval for the exemption through the governor-appointed Board of Commerce and Industry, Hansen said. For over 80 years, that board approved nearly all applications that it received, she said.
Since 2000, Louisiana has granted a total of $35 billion in corporate property tax breaks for 12,590 projects.
Louisiana’s executive order
A few efforts to reform the program over the years have largely failed. But in 2016, Gov. John Bel Edwards signed an executive order that slightly but importantly tweaked the system. On top of the state board vote, the order gave local taxing bodies – such as school boards, sheriffs and parish or city councils – the ability to vote on their own individual portions of the tax exemptions. And in 2019 the East Baton Rouge Parish School Board exercised its power to vote down an abatement.
Throughout the U.S., school boards’ power over the tax abatements that affect their budgets vary, and in some states, including Georgia, Kansas, Nevada, New Jersey and South Carolina, school boards lack any formal ability to vote or comment on tax abatement deals that affect them.
Edwards’ executive order also capped the maximum exemption at 80% and tightened the rules so routine capital investments and maintenance were no longer eligible, Hansen said. A requirement concerning job creation was also put in place.
Concerned residents and activists, led by Together Louisiana and sister group Together Baton Rouge, rallied around the new rules and pushed back against the billion-dollar corporation taking more tax money from the schools. In 2019, the campaign worked: the school board rejected a $2.9 million property tax break bid by Exxon Mobil.
After the decision, Exxon Mobil reportedly described the city as “unpredictable.”
However, members of the business community have continued to lobby for the tax breaks, and they have pushed back against further rejections. In fact, according to Hansen, loopholes were created during the rulemaking process around the governor’s executive order that allowed companies to weaken its effectiveness.
In total, 223 Exxon Mobil projects worth nearly $580 million in tax abatements have been granted in the state of Louisiana under the ITEP program since 2000.
“ITEP is needed to compete with other states – and, in ExxonMobil’s case, other countries,” according to Exxon Mobil spokesperson Lauren Kight.
She pointed out that Exxon Mobil is the largest property taxpayer for the EBR school system, paying more than $46 million in property taxes in EBR parish in 2022 and another $34 million in sales taxes.
A new ITEP contract won’t decrease this existing tax revenue, Kight added. “Losing out on future projects absolutely will.”
The East Baton Rouge Parish School Board has continued to approve Exxon Mobil abatements, passing $46.9 million between 2020 and 2022. Between 2017 and 2023, the school district has lost $96.3 million.
Taxes are highest when industrial buildings are first built. Industrial property comes onto the tax rolls at 40% to 50% of its original value in Louisiana after the initial 10-year exemption, according to the Ascension Economic Development Corp.
Exxon Mobil received its latest tax exemption, $8.6 million over 10 years – an 80% break – in October 2023 for $250 million to install facilities at the Baton Rouge complex that purify isopropyl alcohol for microchip production and that create a new advanced recycling facility, allowing the company to address plastic waste. The project created zero new jobs.
The school board approved it by a 7-2 vote after a long and occasionally contentious board meeting.
“Does it make sense for Louisiana and other economically disadvantaged states to kind of compete with each other by providing tax incentives to mega corporations like Exxon Mobil?” said EBR School Board Vice President Patrick Martin, who voted for the abatement. “Probably, in a macro sense, it does not make a lot of sense. But it is the program that we have.”
Obviously, Exxon Mobil benefits, he said. “The company gets a benefit in reducing the property taxes that they would otherwise pay on their industrial activity that adds value to that property.” But the community benefits from the 20% of the property taxes that are not exempted, he said.
“I believe if we don’t pass it, over time the investments will not come and our district as a whole will have less money,” he added.
Meanwhile, the district’s budgetary woes are coming to a head. Bus drivers staged a sickout at the start of the school year, refusing to pick up students – in protest of low pay and not having buses equipped with air conditioning amid a heat wave. The district was forced to release students early, leaving kids stranded without a ride to school, before it acquiesced and provided the drivers and other staff one-time stipends and purchased new buses with air conditioning.
The district also agreed to reestablish transfer points as a temporary response to the shortages. But that transfer-point plan has historically resulted in students riding on the bus for hours and occasionally missing breakfast when the bus arrives late, according to Angela Reams-Brown, president of the East Baton Rouge Federation of Teachers. The district plans to purchase or lease over 160 buses and solve its bus driver shortage next year, but the plan could lead to a budget crisis.
A teacher shortage looms as well, because the district is paying teachers below the regional average. At the school board meeting, Laverne Simoneaux, an ELL specialist at East Baton Rouge’s Woodlawn Elementary, said she was informed that her job was not guaranteed next year since she’s being paid through federal COVID-19 relief funds. By receiving tax exemptions, Exxon Mobil was taking money from her salary to deepen their pockets, she said.
A young student in the district told the school board that the money could provide better internet access or be used to hire someone to pick up the glass and barbed wire in the playground. But at least they have a playground – Hayden Crockett, a seventh grader at Sherwood Middle Academic Magnet School, noted that his sister’s elementary school lacked one.
“If it wasn’t in the budget to fund playground equipment, how can it also be in the budget to give one of the most powerful corporations in the world a tax break?” Crockett said. “The math just ain’t mathing.”
Christine Wen worked for the nonprofit organization Good Jobs First from June 2019 to May 2022 where she helped collect tax abatement data.
Nathan Jensen has received funding from the John and Laura Arnold Foundation, the Smith Richardson Foundation, the Ewing Marion Kauffman Foundation and the Washington Center for Equitable Growth. He is a Senior Fellow at the Niskanen Center.
Danielle McLean and Kevin Welner do not work for, consult, own shares in or receive funding from any company or organization that would benefit from this article, and have disclosed no relevant affiliations beyond their academic appointment.
subsidies pandemic covid-19 governor mortality oil

The Coming Of The Police State In America


When Military Rule Supplants Democracy


Catastrophic Risk: Investing and Business Implications


Dropping Like a Stone: ON RRP Take‑up in the Second Half of 2023


Where Is R‑Star and the End of the Refi Boom: The Top 5 Posts of 2023


The Digest #187


Redefining Poverty: Towards a Transpartisan Approach


Students lose out as cities and states give billions in property tax breaks to businesses − draining school budgets and especially hurting the poorest students


Is the United States overestimating China’s power?


Biden to call for first-time homebuyer tax credit, construction of 2 million homes
-

 Uncategorized2 weeks ago
All Of The Elements Are In Place For An Economic Crisis Of Staggering Proportions
-

 Uncategorized1 month ago
Cathie Wood sells a major tech stock (again)
-

 Uncategorized3 weeks ago
California Counties Could Be Forced To Pay $300 Million To Cover COVID-Era Program
-

 Uncategorized2 weeks ago
Apparel Retailer Express Moving Toward Bankruptcy
-

 Uncategorized3 weeks ago
Industrial Production Decreased 0.1% in January
-

 International2 days ago
Walmart launches clever answer to Target’s new membership program
-

 Uncategorized3 weeks ago
RFK Jr: The Wuhan Cover-Up & The Rise Of The Biowarfare-Industrial Complex
-

 International2 days ago
EyePoint poaches medical chief from Apellis; Sandoz CFO, longtime BioNTech exec to retire