Tenured investors understand they’re deploying capital during two of the greatest unknowns in recent history. It’s important for all investors to maintain perspective and use the following three ways to navigate 2023’s greatest unknowns.
After over a decade of decadent Fed policy, investors are asking themselves the following questions:
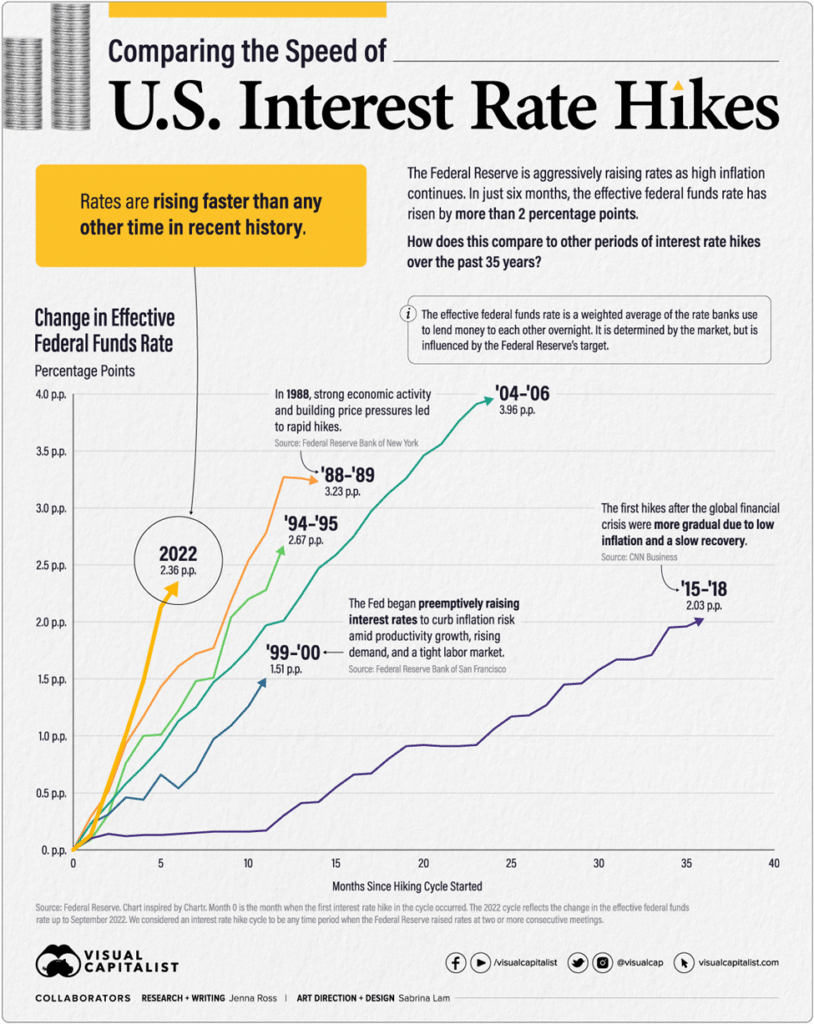
Will the stock market’s bullish trend continue, or is a reversion of long-term averages imminent now that the Fed is increasing interest rates at the fastest pace in four decades?
How do investors and portfolios navigate one of the most globally synchronized quantitative tightening cycles in the last twelve years?
Unfortunately, I do not have the answers. Only time will tell. However, I will provide three ways to navigate 2023’s greatest unknowns. Perspective, rules, and unemotional considerations are most important.
To stay grounded, I never forget the seminal advice from legendary market pundit Martin Zweig:
Don’t Fight the Fed.
Well, here’s the gist of what he wrote, a bit more eloquent: The market’s major direction is dominated by monetary considerations, primarily Federal Reserve policy and the movement of interest rates.
He penned those words in his 1970’s book Winning on Wall Street, and they’ve stood the test of time. And while I certainly can fool myself into thinking otherwise (investors do that a lot), it’s important for me to prick my own emotional balloon by remembering his sage advice often.
As a matter of fact, I created an adage of my own: The Fed is my greatest ally or vilest foe.
By the way, the revised version of Winning on Wall Street is well worth a read for every investor, especially those just starting out.
As we know, the Fed has been a market nemesis since its initial rate hike in March. Nothing spells out ‘foe’ like the following chart from Visual Capitalist.
The Fed is serious. There’s no pivot, just a market of denial.
Certainly, the Fed can slow down the speed and size of rate hikes, but I’ll outline why I believe not only that interest rates may be higher than longer, but also their nebulous 2% inflation target requires revisiting.
According to economist Larry Summers, the Fed’s inflation goal should be 3%. In a report, Joseph Quinlan, head of market strategy for Merrill and Bank of America Private Bank, outlines how the Fed’s 2% target, which began in 1996, was based on the growing popularity of globalization and efficient supply chains. The current target won’t work going forward and requires revision.
One of the best cases for deglobalization is made by Peter Zeihan in his recent book. Click here to watch his analysis.
Currently, the global macro trends appear to be moving in the opposite direction. Deglobalization and structurally upended supply chains are on the horizon for the next economic cycle.
Although we’ve seen some relief to supply chain inflation, the following data convinces me the Fed will remain a market nemesis for longer.
Per the Atlanta Fed’s Wage Growth Tracker, there’s been little relief from wage inflation which tends to be tough to break. After all, once companies raise wages, they don’t tend to retract them.
Trimmed-mean inflation filters out the transitory variation to provide a clearer view of the rate of change and exhibits less real-time bias than ex-food-and-energy core inflation. The trimmed mean is more tightly linked to labor-market slack than headline inflation or the conventional core (per the Federal Reserve Bank of Dallas).
The six-month PCE inflation, the annual rate below, is increasing again.
May-22
Jun-22
Jul-22
Aug-22
Sept-22
Oct-22
PCE
7.1
8.0
6.7
6.0
4.7
5.0
PCE vs. F&E
5.0
5.2
4.3
4.7
4.9
4.7
Trimmed mean
4.5
5.0
4.5
4.8
5.0
5.1
The Atlanta Fed’s Sticky-Price CPI sorts the components of the CPI into flexible or sticky (slow to change).
The News Isn’t All Bad.
On a positive note, flexible prices for goods such as used cars and trucks, cereal, baking products, apparel, and fresh fruit and vegetables are headed in the right direction. However, they still have a way before reverting to longer-term trends. Sticky CPI – prices for rent, water, sewer, and trash collection remain stubborn.
Even in the latest CPI report from December 13, although headed in the right direction, owner-equivalent rents (sticky inflation) increased. From the BLS report:
The index for shelter was by far the largest contributor to the monthly all items increase, more than offsetting decreases in energy indexes. The food index increased 0.5 percent over the month, with the food at home index also rising 0.5 percent. The energy index decreased 1.6 percent over the month as the gasoline index, the natural gas index, and the electricity index all declined.
I won’t say the current report wasn’t an improvement. I will say it’s not enough for the Fed to pivot anytime soon. After all, their target is 2%, and there’s a long way to go. Another reason why you’ll need to understand the three ways to navigate 2023’s greatest unknowns.
Overall, this inflationary condition post-pandemic is a bit of ‘no man’s land’ for economists. Therefore, equity investing will remain volatile through 2023 and continue to shake out weak holders.
In light of this information, here are three ways to navigate 2023’s greatest unknowns.
Place An Investment Foot In The Saver Camp.
Investors and financial professionals have experienced the worst performance in 60/40 portfolios in their investment lifetimes. While the Fed remains an investment foe, it’s an ally to savers.
Stocks haven’t worked (especially growth style), and bonds have been disappointing. So why not allocate a portion of your portfolio to Treasury Bills, high-yield or brokerage CDs from online banks and brokerages, respectively, and investment-grade corporate debt?
Market Timing Doesn’t Work.
All out or all in when it comes to your allocation to stocks is a loser’s game. I work with investors who attempt it. Emotional decisions impact their returns. Second, market timing differs from risk management, which includes minimizing losses and trimming profits based on a rules-based system.
Third, the best market days occur during the most turbulent market cycles. Like some form of torture, to get the highest returns, investors must earn their equity risk premiums by riding the wave, so to speak.
Remember, per JP Morgan, over the last 42 years; markets have fallen 14% during the year yet finish positive 75% of the time. Volatility, as investors have forgotten, is the price of market admission. With the Fed as a foe, investors are reminded of this fact.
Rate Volatility And Market Volatility Are Connected.
Last, it’s through these times I’d rather ride a hobby horse vs. a T-Rex. Therefore, shrinking the portfolio allocation to stocks, building cash, or utilizing short-term fixed-income instruments, could bolster you in your seat during the ride. Remember, you mount your investment saddle on a tamer beast when the Fed is a foe.
Speaking of tamer horses: Synchrony offers a 15-month certificate of deposit at 4.5% APY. A 3-month Treasury bill has a yield-to-maturity of 4.4%. See where I’m going?
When the Fed isn’t your friend as an investor, the best we can do is take a lesson from savers and consider how they’re like kids in a candy store at this juncture, and we like candy too!
Prepare For A Hard Landing.
Many investors were not prepared emotionally for this year’s market ride. I hope they can get their emotions in check for 2023. It’s rare to impossible for the Fed to navigate a soft landing. So, preparing for the worst regarding your emotional response to market volatility is best.
Per Jonathan Pain, author of the Pain Report and Director of JP Consulting NSW Pty Ltd, the metric worth your attention is the 3-month vs. 10-year yield inversion.
Here it is currently:
Jonathan mentions that the type of inversion above has preceded every recession since 1960. On average, a recession followed in 16 months. Although there was one false signal in 1966. Due to fiscal spending for the Vietnam war, a recession was averted. Notice the inversion currently vs. 2019.
Our Gut And Market Cycles Don’t Mix.
Currently, I believe we’re vacillating between anxiety and despair. The endless talk of a Fed pivot, a slight improvement in inflation, and reluctance to decrease 2023 S&P earnings estimates have kept our ‘lizard brains’ in a consistent state of manic but just not negative enough. Next year, we may find our emotions in the basement of capitulation and then discouragement. At these times, we should commit capital to stocks (just when we don’t want to).
Active Management May Be Back
Financial professionals have done a magnificent job of selling products or outsourcing money management which ostensibly distances themselves from ground zero of an imminent explosion (hey, it’s the market, not me), to possibly re-think their careers. Take on a fiduciary calling.
Perhaps a bear market is required to cleanse the system and drain the swamp by migrating miscreants to more fitting livelihoods like pushing phone service deals at T-Mobile or taking roles as activities directors for Carnival Cruise Lines. We’re due.
The front-line consultant of a publicly-traded big box financial retailer is under never-ending pressure to increase shareholders’ margins. The performance of the stock price is the priority. I have never forgotten this lesson from working on the brokerage side of the fence.
Active Investing To Navigate 2023.
With Fed as a foe, passive indexing may not perform as well as good, old-fashioned balance sheet, cash flow, and income statement analysis. Understanding equity balance sheets, cash flows, and dividend growth models and creating rules to help clients navigate risk can be rewarding for financial professionals.
In addition, investors will learn that investing solely to beat some arbitrary index is a fool’s game. What’s the point? To provide conversation fodder for holiday parties?
Financial Planning To The Rescue!
I’ll beat the drum again over comprehensive financial planning whereby investors get to know their PRR or personal rate of return required to meet specific, goals-based milestones such as retirement or saving for college.
For example, If your PRR is 3.62%, then we know, as planners and asset allocators, that there’s no need to take on additional risk than necessary.
Overall, I expect 2023 to be an investing challenge and an inevitable recession. I hope I’m wrong. The three ways to navigate 2023’s greatest unknowns should provide some guidance.
In the meantime, here’s some sage commentary from my favorite Bloomberg Opinion columnist:
The Fed has told us very clearly that it’s more hawkish than we thought, and it’s inherently very dangerous to ignore it.
BUFFALO, NY- March 11, 2024 – Impact Journals publishes scholarly journals in the biomedical sciences with a focus on all areas of cancer and aging research. Aging is one of the most prominent journals published by Impact Journals.
Credit: Impact Journals
BUFFALO, NY- March 11, 2024 – Impact Journals publishes scholarly journals in the biomedical sciences with a focus on all areas of cancer and aging research. Aging is one of the most prominent journals published by Impact Journals.
Impact Journals will be participating as an exhibitor at the American Association for Cancer Research (AACR) Annual Meeting 2024 from April 5-10 at the San Diego Convention Center in San Diego, California. This year, the AACR meeting theme is “Inspiring Science • Fueling Progress • Revolutionizing Care.”
Visit booth #4159 at the AACR Annual Meeting 2024 to connect with members of the Agingteam.
About Aging-US:
Agingpublishes research papers in all fields of aging research including but not limited, aging from yeast to mammals, cellular senescence, age-related diseases such as cancer and Alzheimer’s diseases and their prevention and treatment, anti-aging strategies and drug development and especially the role of signal transduction pathways such as mTOR in aging and potential approaches to modulate these signaling pathways to extend lifespan. The journal aims to promote treatment of age-related diseases by slowing down aging, validation of anti-aging drugs by treating age-related diseases, prevention of cancer by inhibiting aging. Cancer and COVID-19 are age-related diseases.
Agingis indexed and archived byPubMed/Medline (abbreviated as “Aging (Albany NY)”), PubMed Central, Web of Science: Science Citation Index Expanded (abbreviated as “Aging‐US” and listed in the Cell Biology and Geriatrics & Gerontology categories), Scopus (abbreviated as “Aging” and listed in the Cell Biology and Aging categories), Biological Abstracts, BIOSIS Previews, EMBASE, META (Chan Zuckerberg Initiative) (2018-2022), and Dimensions (Digital Science).
Please visit our website at www.Aging-US.com and connect with us:
NY Fed Finds Medium, Long-Term Inflation Expectations Jump Amid Surge In Stock Market Optimism
One month after the inflation outlook tracked by the NY Fed Consumer Survey extended their late 2023 slide, with 3Y inflation expectations in January sliding to a record low 2.4% (from 2.6% in December), even as 1 and 5Y inflation forecasts remained flat, moments ago the NY Fed reported that in February there was a sharp rebound in longer-term inflation expectations, rising to 2.7% from 2.4% at the three-year ahead horizon, and jumping to 2.9% from 2.5% at the five-year ahead horizon, while the 1Y inflation outlook was flat for the 3rd month in a row, stuck at 3.0%.
The increases in both the three-year ahead and five-year ahead measures were most pronounced for respondents with at most high school degrees (in other words, the "really smart folks" are expecting deflation soon). The survey’s measure of disagreement across respondents (the difference between the 75th and 25th percentile of inflation expectations) decreased at all horizons, while the median inflation uncertainty—or the uncertainty expressed regarding future inflation outcomes—declined at the one- and three-year ahead horizons and remained unchanged at the five-year ahead horizon.
Going down the survey, we find that the median year-ahead expected price changes increased by 0.1 percentage point to 4.3% for gas; decreased by 1.8 percentage points to 6.8% for the cost of medical care (its lowest reading since September 2020); decreased by 0.1 percentage point to 5.8% for the cost of a college education; and surprisingly decreased by 0.3 percentage point for rent to 6.1% (its lowest reading since December 2020), and remained flat for food at 4.9%.
We find the rent expectations surprising because it is happening just asking rents are rising across the country.
At the same time as consumers erroneously saw sharply lower rents, median home price growth expectations remained unchanged for the fifth consecutive month at 3.0%.
Turning to the labor market, the survey found that the average perceived likelihood of voluntary and involuntary job separations increased, while the perceived likelihood of finding a job (in the event of a job loss) declined. "The mean probability of leaving one’s job voluntarily in the next 12 months also increased, by 1.8 percentage points to 19.5%."
Mean unemployment expectations - or the mean probability that the U.S. unemployment rate will be higher one year from now - decreased by 1.1 percentage points to 36.1%, the lowest reading since February 2022. Additionally, the median one-year-ahead expected earnings growth was unchanged at 2.8%, remaining slightly below its 12-month trailing average of 2.9%.
Turning to household finance, we find the following:
The median expected growth in household income remained unchanged at 3.1%. The series has been moving within a narrow range of 2.9% to 3.3% since January 2023, and remains above the February 2020 pre-pandemic level of 2.7%.
Median household spending growth expectations increased by 0.2 percentage point to 5.2%. The increase was driven by respondents with a high school degree or less.
Median year-ahead expected growth in government debt increased to 9.3% from 8.9%.
The mean perceived probability that the average interest rate on saving accounts will be higher in 12 months increased by 0.6 percentage point to 26.1%, remaining below its 12-month trailing average of 30%.
Perceptions about households’ current financial situations deteriorated somewhat with fewer respondents reporting being better off than a year ago. Year-ahead expectations also deteriorated marginally with a smaller share of respondents expecting to be better off and a slightly larger share of respondents expecting to be worse off a year from now.
The mean perceived probability that U.S. stock prices will be higher 12 months from now increased by 1.4 percentage point to 38.9%.
At the same time, perceptions and expectations about credit access turned less optimistic: "Perceptions of credit access compared to a year ago deteriorated with a larger share of respondents reporting tighter conditions and a smaller share reporting looser conditions compared to a year ago."
Also, a smaller percentage of consumers, 11.45% vs 12.14% in prior month, expect to not be able to make minimum debt payment over the next three months
Last, and perhaps most humorous, is the now traditional cognitive dissonance one observes with these polls, because at a time when long-term inflation expectations jumped, which clearly suggests that financial conditions will need to be tightened, the number of respondents expecting higher stock prices one year from today jumped to the highest since November 2021... which incidentally is just when the market topped out during the last cycle before suffering a painful bear market.
Homes listed for sale in early June sell for $7,700 more
New Zillow research suggests the spring home shopping season may see a second wave this summer if mortgage rates fall
The post Homes listed for sale in…
A Zillow analysis of 2023 home sales finds homes listed in the first two weeks of June sold for 2.3% more.
The best time to list a home for sale is a month later than it was in 2019, likely driven by mortgage rates.
The best time to list can be as early as the second half of February in San Francisco, and as late as the first half of July in New York and Philadelphia.
Spring home sellers looking to maximize their sale price may want to wait it out and list their home for sale in the first half of June. A new Zillow® analysis of 2023 sales found that homes listed in the first two weeks of June sold for 2.3% more, a $7,700 boost on a typical U.S. home.
The best time to list consistently had been early May in the years leading up to the pandemic. The shift to June suggests mortgage rates are strongly influencing demand on top of the usual seasonality that brings buyers to the market in the spring. This home-shopping season is poised to follow a similar pattern as that in 2023, with the potential for a second wave if the Federal Reserve lowers interest rates midyear or later.
The 2.3% sale price premium registered last June followed the first spring in more than 15 years with mortgage rates over 6% on a 30-year fixed-rate loan. The high rates put home buyers on the back foot, and as rates continued upward through May, they were still reassessing and less likely to bid boldly. In June, however, rates pulled back a little from 6.79% to 6.67%, which likely presented an opportunity for determined buyers heading into summer. More buyers understood their market position and could afford to transact, boosting competition and sale prices.
The old logic was that sellers could earn a premium by listing in late spring, when search activity hit its peak. Now, with persistently low inventory, mortgage rate fluctuations make their own seasonality. First-time home buyers who are on the edge of qualifying for a home loan may dip in and out of the market, depending on what’s happening with rates. It is almost certain the Federal Reserve will push back any interest-rate cuts to mid-2024 at the earliest. If mortgage rates follow, that could bring another surge of buyers later this year.
Mortgage rates have been impacting affordability and sale prices since they began rising rapidly two years ago. In 2022, sellers nationwide saw the highest sale premium when they listed their home in late March, right before rates barreled past 5% and continued climbing.
Zillow’s research finds the best time to list can vary widely by metropolitan area. In 2023, it was as early as the second half of February in San Francisco, and as late as the first half of July in New York. Thirty of the top 35 largest metro areas saw for-sale listings command the highest sale prices between May and early July last year.
Zillow also found a wide range in the sale price premiums associated with homes listed during those peak periods. At the hottest time of the year in San Jose, homes sold for 5.5% more, a $88,000 boost on a typical home. Meanwhile, homes in San Antonio sold for 1.9% more during that same time period.
We use cookies on our website to give you the most relevant experience by remembering your preferences and repeat visits. By clicking “Accept”, you consent to the use of ALL the cookies.
This website uses cookies to improve your experience while you navigate through the website. Out of these, the cookies that are categorized as necessary are stored on your browser as they are essential for the working of basic functionalities of the website. We also use third-party cookies that help us analyze and understand how you use this website. These cookies will be stored in your browser only with your consent. You also have the option to opt-out of these cookies. But opting out of some of these cookies may affect your browsing experience.
Necessary cookies are absolutely essential for the website to function properly. These cookies ensure basic functionalities and security features of the website, anonymously.
Cookie
Duration
Description
cookielawinfo-checbox-analytics
11 months
This cookie is set by GDPR Cookie Consent plugin. The cookie is used to store the user consent for the cookies in the category "Analytics".
cookielawinfo-checbox-functional
11 months
The cookie is set by GDPR cookie consent to record the user consent for the cookies in the category "Functional".
cookielawinfo-checbox-others
11 months
This cookie is set by GDPR Cookie Consent plugin. The cookie is used to store the user consent for the cookies in the category "Other.
cookielawinfo-checkbox-necessary
11 months
This cookie is set by GDPR Cookie Consent plugin. The cookies is used to store the user consent for the cookies in the category "Necessary".
cookielawinfo-checkbox-performance
11 months
This cookie is set by GDPR Cookie Consent plugin. The cookie is used to store the user consent for the cookies in the category "Performance".
viewed_cookie_policy
11 months
The cookie is set by the GDPR Cookie Consent plugin and is used to store whether or not user has consented to the use of cookies. It does not store any personal data.
Functional cookies help to perform certain functionalities like sharing the content of the website on social media platforms, collect feedbacks, and other third-party features.
Performance cookies are used to understand and analyze the key performance indexes of the website which helps in delivering a better user experience for the visitors.
Analytical cookies are used to understand how visitors interact with the website. These cookies help provide information on metrics the number of visitors, bounce rate, traffic source, etc.
Advertisement cookies are used to provide visitors with relevant ads and marketing campaigns. These cookies track visitors across websites and collect information to provide customized ads.


