Uncategorized
Have we found the bottom in existing home sales?
On Wednesday, existing home sales collapsed near the lows we saw during COVID-19 and back in 2007 when the housing bubble burst.
Share this:

On Wednesday, existing home sales collapsed near the lows we saw during COVID-19 and back in 2007 when the housing bubble burst. In addition, this is the fourth straight month of inventory declining, while days on the market are growingl! Confused by this? I hear you; let’s dive deeper into today’s report.
From NAR: “In essence, the residential real estate market was frozen in November, resembling the sales activity seen during the COVID-19 economic lockdowns in 2020,” said NAR Chief Economist Lawrence Yun. “The principal factor was the rapid increase in mortgage rates, which hurt housing affordability and reduced incentives for homeowners to list their homes. Plus, available housing inventory remains near historic lows.”
One of the housing economic realities that I have been trying to stress this year is that a traditional seller of a home is typically a buyer as well. This explains why total active listing inventory data has been stable over the decades, with the exception of 2006-2011, when those forced distressed credit home sellers couldn’t buy.
Since the credit standards have improved post-2010, we shouldn’t see distressed sellers until a job loss recession happens, even if sales fall noticeably. This happened during the early months of COVID-19, and we have not seen the panic selling in 2022 like some people predicted.
Housing inventory
Today, inventory is almost 900,000 active listings below the lowest level of the four-decade average between 2 million and 2.5 million.
Inventory is now down again in the NAR report; this is the fourth month of inventory decline, now running at 1.14 million. The all-time lows were around 860,000 this year, and the all-time high was a tad over 4 million in 2007.
We have had two historic events that created a waterfall dive in demand recently; we now have precise data showing new listing data declining with those events, which shows how important that data line is to housing demand. This is the biggest story in housing.
For a decade, the traditional view on housing has been that when demand collapses, inventory will spike higher, which is what we saw during the years when the housing bubble burst.
I have never believed in this concept because of how the housing market credit channels work. I have stressed that inventory can grow through a weakness in demand over time. This means what we saw in 2005-2008 with the inventory spike was a historic event that hasn’t been replicated at any time in recent U.S. economic history.
We have one data line that clearly shows the credit stress in the system, and it’s been my favorite chart at all my events (see below). Without significant credit stress in the system, we can’t ever assume we will see inventory scale spikes where sellers will not be able to buy homes because of a foreclosure or short sale.
We can believe in a forced equity seller premise, where someone loses their job and needs to sell their home to gain access to money. That is a real live talking point, but it will require a job loss recession. As we can see below, the U.S. housing market had high levels of credit stress in 2005 through 2008; then, after all that, we had the job loss recession. None of that has ever happened again since 2012.
Hopefully, this explains why total active listings are still low, and the NAR data has now shown four months of decline. We have a shot at having total active listings below 1 million over the next two months because demand is picking up during a seasonal inventory decline period.
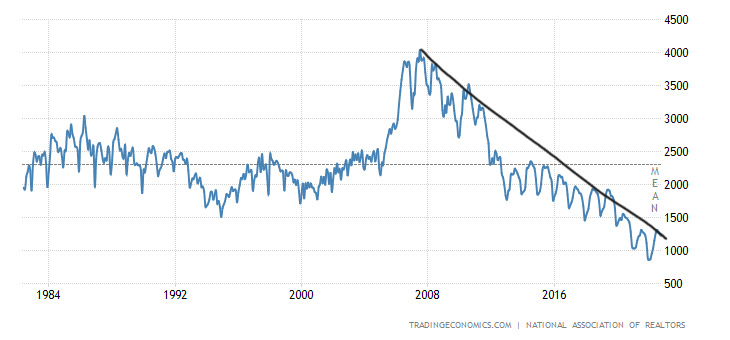
Below, you can see the decline in sales data, which is not as sharp and short as we saw during COVID-19 but a waterfall dive in demand nonetheless. Mortgage rates spiked in March, and then the new listing data started to decline at the end of June. My line in the sand has always been 4 million on the monthly existing home sales prints because it’s been a rare event that sales go below that level post-1996.
We have broken under 4 million existing home sales only twice post-1996. First was the tail end of the housing bubble bursting in 2008, and second was in 2010 in the aftermath of the homebuyer tax credit when sales were pulled forward and then collapsed.
From NAR: Total existing-home sales waned 7.7% from October to a seasonally adjusted annual rate of 4.09 million in November.
One of the most encouraging signs I see in today’s report, which I also loved in the last report, is that the days on the market are growing.
I am not, nor will I ever be, a fan of a housing market with days on the market in the teens or lower. This means we don’t have enough active listings for buyers, forcing people to bid against each other. I consider this growth year over year from 18 days to 24 days as a plus and a step toward a more normalized housing market.
NAR: First-time buyers were responsible for 28% of sales in November; Individual investors purchased 14% of homes; All-cash sales accounted for 26% of transactions; Distressed sales represented 2% of sales; Properties typically remained on the market for 24 days.

Home-price growth is cooling off dramatically, which is another awesome thing about housing this year. Yes, I know I am very biased here. Since February 2022, I have labeled the housing market savagely unhealthy as home prices have escalated well above my 23% home price growth model for 2020-2024 in less than two years.
This is why my rants of needing higher mortgage rates went into overdrive back then. However, now we are working our way back to a normal marketplace, which is good, not bad.
NAR: The median existing-home price for all housing types in November was $370,700, an increase of 3.5% from November 2021 ($358,200), as prices rose in all regions. This marks 129 consecutive months of year-over-year increases, the longest-running streak on record. 
Purchase applications
The other housing news of the day, the forward-looking purchase application data, had another positive trend data line report. The week-to-week action saw a slight 0.1% decline, but now the year-over-year decline is 36%. As crazy as this sounds, that is 10% above the lows we had this year when this index was down 46% year over year.
Now, we need to add some context to this data line.
During the months of October 2021 to January 2022, we had a rare volume rise in the purchase application data, which took existing home sales toward 6.49 million in January of this year. This meant that all housing data, especially purchase application data, would have extremely hard comps to work with this year from October to January.
When I saw where trend sales data was going, I was anticipating that purchase application data would be down on average between 35%-45% year over year from October to January. So far this year, we have been down 36%-46% during this period. So, the data looks normal to me, as I was anticipating this.
What I didn’t anticipate was how well the market reacted to mortgage rates that went 1.25% lower in a short amount of time. This sent this data line positive for seven straight weeks, making us rise from the bottom decline of 46% year over year to now just 36%.
This means, for now, we have found a bottom in the data and bounced off the lows with positive trending data. This means in a few months, the existing home sales data should look better as this data line looks out 30-90 days.

The big takeaway in today’s existing home sales report is that we need to see new listing data grow in 2023 to get more home sales. Some people might believe that new listing data being negative is good for the housing market because it means inventory is stable. I believe this is the wrong way to look at the housing market. We want to see people list their homes and move when they want to. That is just a function of life; not everyone sits in the same home for 18 years like me.
Hopefully, in 2023, when we see the traditional inventory rise, this will come with new listing data growth, and we can get the total national inventory levels back to 2019 levels, which I will be very happy to see.
The housing market couldn’t take the shock of mortgage rates moving from 3% to 7.375% in one year, and this forced some people to change their minds about selling their home since they will have to buy another one. Hopefully, a more stable mortgage rate market means new listing data can grow in 2023.
recession foreclosure covid-19 home sales mortgage rates real estate housing market recessionUncategorized
One city held a mass passport-getting event
A New Orleans congressman organized a way for people to apply for their passports en masse.
Share this:


While the number of Americans who do not have a passport has dropped steadily from more than 80% in 1990 to just over 50% now, a lack of knowledge around passport requirements still keeps a significant portion of the population away from international travel.
Over the four years that passed since the start of covid-19, passport offices have also been dealing with significant backlog due to the high numbers of people who were looking to get a passport post-pandemic.
Related: Here is why it is (still) taking forever to get a passport
To deal with these concurrent issues, the U.S. State Department recently held a mass passport-getting event in the city of New Orleans. Called the "Passport Acceptance Event," the gathering was held at a local auditorium and invited residents of Louisiana’s 2nd Congressional District to complete a passport application on-site with the help of staff and government workers.
'Come apply for your passport, no appointment is required'
"Hey #LA02," Rep. Troy A. Carter Sr. (D-LA), whose office co-hosted the event alongside the city of New Orleans, wrote to his followers on Instagram (META) . "My office is providing passport services at our #PassportAcceptance event. Come apply for your passport, no appointment is required."
More Travel:
- A new travel term is taking over the internet (and reaching airlines and hotels)
- The 10 best airline stocks to buy now
- Airlines see a new kind of traveler at the front of the plane
The event was held on March 14 from 10 a.m. to 1 p.m. While it was designed for those who are already eligible for U.S. citizenship rather than as a way to help non-citizens with immigration questions, it helped those completing the application for the first time fill out forms and make sure they have the photographs and identity documents they need. The passport offices in New Orleans where one would normally have to bring already-completed forms have also been dealing with lines and would require one to book spots weeks in advance.
These are the countries with the highest-ranking passports in 2024
According to Carter Sr.'s communications team, those who submitted their passport application at the event also received expedited processing of two to three weeks (according to the State Department's website, times for regular processing are currently six to eight weeks).
While Carter Sr.'s office has not released the numbers of people who applied for a passport on March 14, photos from the event show that many took advantage of the opportunity to apply for a passport in a group setting and get expedited processing.
Every couple of months, a new ranking agency puts together a list of the most and least powerful passports in the world based on factors such as visa-free travel and opportunities for cross-border business.
In January, global citizenship and financial advisory firm Arton Capital identified United Arab Emirates as having the most powerful passport in 2024. While the United States topped the list of one such ranking in 2014, worsening relations with a number of countries as well as stricter immigration rules even as other countries have taken strides to create opportunities for investors and digital nomads caused the American passport to slip in recent years.
A UAE passport grants holders visa-free or visa-on-arrival access to 180 of the world’s 198 countries (this calculation includes disputed territories such as Kosovo and Western Sahara) while Americans currently have the same access to 151 countries.
stocks pandemic covid-19 grantsUncategorized
Fast-food chain closes restaurants after Chapter 11 bankruptcy
Several major fast-food chains recently have struggled to keep restaurants open.
Share this:


Competition in the fast-food space has been brutal as operators deal with inflation, consumers who are worried about the economy and their jobs and, in recent months, the falling cost of eating at home.
Add in that many fast-food chains took on more debt during the covid pandemic and that labor costs are rising, and you have a perfect storm of problems.
It's a situation where Restaurant Brands International (QSR) has suffered as much as any company.
Related: Wendy's menu drops a fan favorite item, adds something new
Three major Burger King franchise operators filed for bankruptcy in 2023, and the chain saw hundreds of stores close. It also saw multiple Popeyes franchisees move into bankruptcy, with dozens of locations closing.
RBI also stepped in and purchased one of its key franchisees.
"Carrols is the largest Burger King franchisee in the United States today, operating 1,022 Burger King restaurants in 23 states that generated approximately $1.8 billion of system sales during the 12 months ended Sept. 30, 2023," RBI said in a news release. Carrols also owns and operates 60 Popeyes restaurants in six states."
The multichain company made the move after two of its large franchisees, Premier Kings and Meridian, saw multiple locations not purchased when they reached auction after Chapter 11 bankruptcy filings. In that case, RBI bought select locations but allowed others to close.
Image source: Chen Jianli/Xinhua via Getty
Another fast-food chain faces bankruptcy problems
Bojangles may not be as big a name as Burger King or Popeye's, but it's a popular chain with more than 800 restaurants in eight states.
"Bojangles is a Carolina-born restaurant chain specializing in craveable Southern chicken, biscuits and tea made fresh daily from real recipes, and with a friendly smile," the chain says on its website. "Founded in 1977 as a single location in Charlotte, our beloved brand continues to grow nationwide."
Like RBI, Bojangles uses a franchise model, which makes it dependent on the financial health of its operators. The company ultimately saw all its Maryland locations close due to the financial situation of one of its franchisees.
Unlike. RBI, Bojangles is not public — it was taken private by Durational Capital Management LP and Jordan Co. in 2018 — which means the company does not disclose its financial information to the public.
That makes it hard to know whether overall softness for the brand contributed to the chain seeing its five Maryland locations after a Chapter 11 bankruptcy filing.
Bojangles has a messy bankruptcy situation
Even though the locations still appear on the Bojangles website, they have been shuttered since late 2023. The locations were operated by Salim Kakakhail and Yavir Akbar Durranni. The partners operated under a variety of LLCs, including ABS Network, according to local news channel WUSA9.
The station reported that the owners face a state investigation over complaints of wage theft and fraudulent W2s. In November Durranni and ABS Network filed for bankruptcy in New Jersey, WUSA9 reported.
"Not only do former employees say these men owe them money, WUSA9 learned the former owners owe the state, too, and have over $69,000 in back property taxes."
Former employees also say that the restaurant would regularly purchase fried chicken from Popeyes and Safeway when it ran out in their stores, the station reported.
Bojangles sent the station a comment on the situation.
"The franchisee is no longer in the Bojangles system," the company said. "However, it is important to note in your coverage that franchisees are independent business owners who are licensed to operate a brand but have autonomy over many aspects of their business, including hiring employees and payroll responsibilities."
Kakakhail and Durranni did not respond to multiple requests for comment from WUSA9.
bankruptcy pandemicUncategorized
Industrial Production Increased 0.1% in February
From the Fed: Industrial Production and Capacity Utilization
Industrial production edged up 0.1 percent in February after declining 0.5 percent in January. In February, the output of manufacturing rose 0.8 percent and the index for mining climbed 2.2 p…
Share this:


Industrial production edged up 0.1 percent in February after declining 0.5 percent in January. In February, the output of manufacturing rose 0.8 percent and the index for mining climbed 2.2 percent. Both gains partly reflected recoveries from weather-related declines in January. The index for utilities fell 7.5 percent in February because of warmer-than-typical temperatures. At 102.3 percent of its 2017 average, total industrial production in February was 0.2 percent below its year-earlier level. Capacity utilization for the industrial sector remained at 78.3 percent in February, a rate that is 1.3 percentage points below its long-run (1972–2023) average.Click on graph for larger image.
emphasis added
This graph shows Capacity Utilization. This series is up from the record low set in April 2020, and above the level in February 2020 (pre-pandemic).
Capacity utilization at 78.3% is 1.3% below the average from 1972 to 2022. This was below consensus expectations.
Note: y-axis doesn't start at zero to better show the change.
 The second graph shows industrial production since 1967.
Industrial production increased to 102.3. This is above the pre-pandemic level.
Industrial production was above consensus expectations.


Key shipping company files for Chapter 11 bankruptcy


These Cities Have The Highest (And Lowest) Share Of Unaffordable Neighborhoods In 2024


Tight inventory and frustrated buyers challenge agents in Virginia


The Question You Should Ask Whenever You’re Wrong


Walmart and Target make key self-checkout changes to fight theft


Industrial Production Increased 0.1% in February


Your financial plan may be riskier without bitcoin
Key shipping company files Chapter 11 bankruptcy


One city held a mass passport-getting event


Futures Rise To New Record High Ahead Of Data Deluge
-

 Uncategorized3 weeks ago
All Of The Elements Are In Place For An Economic Crisis Of Staggering Proportions
-

 International1 week ago
EyePoint poaches medical chief from Apellis; Sandoz CFO, longtime BioNTech exec to retire
-

 Uncategorized4 weeks ago
California Counties Could Be Forced To Pay $300 Million To Cover COVID-Era Program
-

 Uncategorized3 weeks ago
Apparel Retailer Express Moving Toward Bankruptcy
-

 Uncategorized4 weeks ago
Industrial Production Decreased 0.1% in January
-

 International1 week ago
Walmart launches clever answer to Target’s new membership program
-

 Spread & Containment3 days ago
IFM’s Hat Trick and Reflections On Option-To-Buy M&A
-

 Uncategorized4 weeks ago
RFK Jr: The Wuhan Cover-Up & The Rise Of The Biowarfare-Industrial Complex