Uncategorized
“The Debt Crisis Is Here”: The Conference Board Is At It Again
The Committee for Economic Development (CED) of Conference Board recently put out “Explainer: The National Debt” which is pretty much a greatest hits of debt scare mongering. Other than the references to recent events and data, it is timeless: the auth…
Share this:

The Committee for Economic Development (CED) of Conference Board recently put out “Explainer: The National Debt” which is pretty much a greatest hits of debt scare mongering. Other than the references to recent events and data, it is timeless: the authors could have put out the same report in any year since the mid-1980s and not much of the contents would have changed. Anyone who thinks that the MMT debate would improve things just needs to read the report to see that progress in conventional economics is largely illusionary.
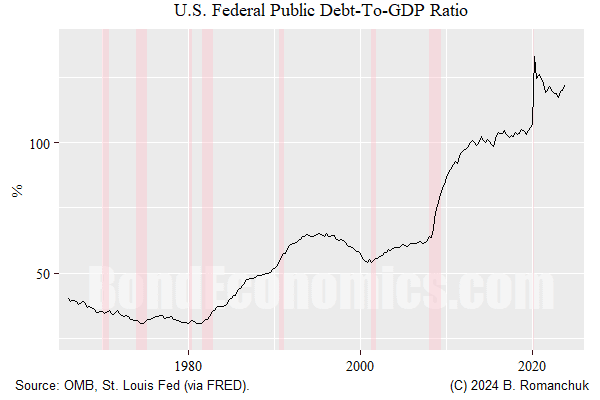
The shtick of the “explainer” is that “the fiscal crisis is here.” The evidence is everybody’s favourite time series: the debt/GDP ratio (above).
I will immediately note that the United States does face a crisis: its ability to govern itself appears to have collapsed. Getting the budget process to work when one party of a two party system wants to burn the system to the ground is obviously difficult. What type of dysfunction the United States will have after November depends upon the electoral results (and whether a certain party would accept those results).
The “Analysis”
The report runs through the basics of fiscal policy, and the various categories of spending.
Comparing the national debt to GDP (Figure 5) produces a ratio that reveals the United States’ ability to pay down its debt. The debt-to-GDP ratio shows the burden of the national debt relative to the country’s total economic output and can provide greater context than looking at total debt numbers alone. Based on examples from international financial institutions, the recent past, and econometric analysis, CED recommends a public debt-to-GDP ratio of no higher than 70 percent as a stable and sustainable level of debt burden. The European Union requires member states to limit government debt to 60 percent of GDP as a condition for joining the euro, and a World Bank analysis finds 77 percent as the threshold at which debt begins to impede economic growth in developed countries. CED’s recommendation is roughly in the middle of this reference frame.
The CED thus declares the U.S. debt unsustainable based on (a) a number pulled out of the nether regions of Eurocrats and (b) a number from a report that undoubtedly reversed the causality between high debt/GDP ratios and low nominal GDP growth rates.

When we compare the magic “unsustainable 70% debt/GDP limit” to Japan’s history, we see an immediate problem. Of course, the authors of the report explain this as being due to high personal savings rates, and Japanese growth was slow. Given the rather low levels of JGB yields, it is hard to see how the debt levels impeded growth.
Yeah, The 1980s
What stands out to me is the following passage.
After the economic turmoil of the 1970s, President Reagan entered office in 1981 promising to tackle inflation and the budget deficit. While inflation did come down, the Federal government also ran high deficits because of tax cuts and significant increases in military spending that were not matched by cuts in other areas of discretionary or mandatory spending. Nevertheless, economic growth was relatively strong, which tempered the rise of the debt-to-GDP ratio in the 1980s to 39 percent of GDP by 1989.
If we look at the chart I provide at the top of the article, we get a somewhat different view of the debt/GDP situation in that era. The debt/GDP ratio hit its lowest level during the peak inflation period around 1980. Rapid nominal GDP growth crushes the debt/GDP ratio courtesy of how division works.
If we accept the MMT premise that the sustainability risk associated with fiscal policy is inflation, then the debt/GDP ratio is an anti-indicator: it falls when inflation rises.
Interest Costs
The discussion of interest costs also underlines the incoherence of conventional thinking: interest costs are rising because the central bank is raising rates because it wants lower inflation. Yet those rate hikes represent an inflation risk.
Outlook Is Concerning Because the U.S. Federal Government is Adrift
Hand-wringing about discretionary versus non-discretionary spending is just political cover for fiscal conservatives to demand cuts to the welfare state. To the extent that there is a fiscal problem, tax hikes are also a solution. The inability of the U.S. Federal Government to run a budgetary process in a sane fashion is always going to be an issue.
Fiscal policy was forced into extraordinary measures by the unusual nature of the pandemic. There was an inflationary bump — but no lost decade afterward. If fiscal policy is structurally loose, there might be future tightening measures needed. However, it is unlikely that the U.S. can approach that prospect in a sane fashion.
Concluding Remarks
It is very easy to respond to such reports by fiscal conservatives. They keep publishing the same report, and I keep publishing the same response.
Uncategorized
Is the biotech market rally real? Data suggest comeback in private, public markets
After some halting starts, false dawns and fragile rallies, the biotech market may finally be back.
No, really.
In the last several months, several important…
Share this:


After some halting starts, false dawns and fragile rallies, the biotech market may finally be back.
No, really.
In the last several months, several important signals have added up to what feels like a rally, with more depth and certainty than some of the short-lived upticks during the doldrums of 2022 and 2023, when only the industry’s most optimistic souls were willing to call it a comeback.
But now, public biotechs are releasing positive data and raising money in follow-on offerings with ease. Biopharmas have already raised $13.7 billion in secondary raises in 2024, according to Stifel’s Tim Opler. Biotech’s benchmark index, the $XBI, is up 56% from last year’s lows and has broken the $100 mark, thanks to gains that go deep into the 120-company index. And in the private markets, crossover rounds are trickling back, and IPOs are showing signs of life.
Investors and executives told Endpoints News that this moment feels different, encouraged by a return to the basics, a focus on data, and signs of a healthier — if smaller — biotech ecosystem.
“We should be beyond any of the lows,” said Chris Garabedian, a venture portfolio manager at Perceptive Advisors and founder of the firm’s early-stage investing unit Xontogeny. “We are going to see continued forward momentum.”
Investor sentiment is “very different from what it was in ‘22 to ‘23, where it was all doom and gloom,” MoonLake Immunotherapeutics CEO Jorge Santos da Silva said. A year ago, “The question was like, ‘What are the 22 ways in which you can die?’ That has really changed.”

The XBI cracking $100 is encouraging, but a deeper look at the index shows more signs of strength. The exchange-traded fund, which lets investors buy shares of its basket of 120 biotech companies, has seen $457 million in net inflows over the past month, according to YCharts data. And about 80% of biotechs on the index — which includes giants like Vertex $VRTX and small companies like Avidity Biosciences $RNA — have seen their stock in the green over the past three months.
Some of that gain is clearly driven by a surge in M&A, including the buyouts of Seagen, Horizon, Cerevel, and Karuna, all of which have returned billions of dollars back to investors who need to put it back to work in the private or public markets. And industry insiders have said there’s also a breadth in the disease areas drawing interest, including obesity, cancer, cardiology, neurology, and inflammation.
Even ARCH Venture Partners managing director Bob Nelsen voiced some broader — albeit measured — optimism for the market.
“For our internal base case, we’re still assuming that things are going to suck like they have in the last couple of years,” Nelsen told Endpoints. “But we all believe that it has turned.”
Nelsen still implores his portfolio companies and limited partners to “assume it’s going to be worse than you think.” But his optimism is driven by two major trends: the easing of macro factors like interest rates and the persistence of M&A. He’s closely watching whether generalist investors — whose huge dollars can swing a sector up or down, as they did dramatically during the pandemic — will come back to biotech.
“The conventional wisdom in Q4 is, they were never coming back in the market,” he said. “Turns out, in Q4 they were buying.”
From atonement to ‘FOMO’
 Jorge Santos da Silva
Da Silva said the industry had been “paying for our sins” committed in the boom years of 2019 to 2021, when hundreds of biotechs went public — many far from going into the clinic. Along with layoffs and company closures, it resulted in an infestation of the corporate walking dead in companies trading at values below the amount of cash on their books.
But the number of those companies with negative equity value has dropped in the past few months, suggesting that a much-needed cleanup from the go-go years is well in progress.
“I call it a detox,” da Silva said. “Whatever we did was clearly excessive and everyone knew it at the time. But when you’re at a party, it’s like, ‘Oh my God, this is crazy, but let’s keep going.’ The detox phase is definitely coming to an end.”

 Otello Stampacchia
Otello Stampacchia, the managing director of the Boston-based VC firm Omega Funds, said the mood is even “getting a little bit bubblicious” for biotechs with clinical-stage drug candidates in large markets with meaningful milestones in the next 12 to 18 months.
“There’s really a rush to get into those, particularly now that the indices have started flipping their dynamic,” said Stampacchia, who founded Omega two decades ago. “Up until early last fall, nobody wanted to catch the falling knife. It’s now the exact opposite dynamic, and there’s a bit of crowding in some of these names.”
“There’s real FOMO to invest in the right therapeutic products and the right therapeutic companies,” he added.
That’s carried through the private and public markets, Stampacchia said, noting that Omega participated in Alumis’ recent $259 million Series C raise — biotech’s biggest round this year. He said he was “incredibly surprised by the amount of demand there was for the deal.” All told, Omega has seen roughly half a dozen of its portfolio companies raise close to half a billion dollars over the last few months, with increased valuations.
“In each case, it really wasn’t difficult to syndicate,” he said. “There’s real demand.”
rna pandemic interest ratesUncategorized
“It seems impossible:” Bergen County, NJ’s housing market is vexing agents and buyers
While the housing market has cooled from the buying frenzy during the pandemic, agents in the leafy Bergen County suburbs say it’s also gotten worse. We…
Share this:

Real estate agents in the leafy suburbs of Bergen County, New Jersey say the current housing market — with historically low inventory and record-high prices — is actually more challenging than the multiple offer chaos they sweated through during the pandemic.
“At the height of the pandemic there were bidding wars and all that, but it didn’t seem impossible, but now it seems impossible to get our buyers into homes,” said Heather Corrigan, a RE/MAX Signature Homes agent based in Closter, a borough that is 24 miles north of Manhattan and renown for its schools.
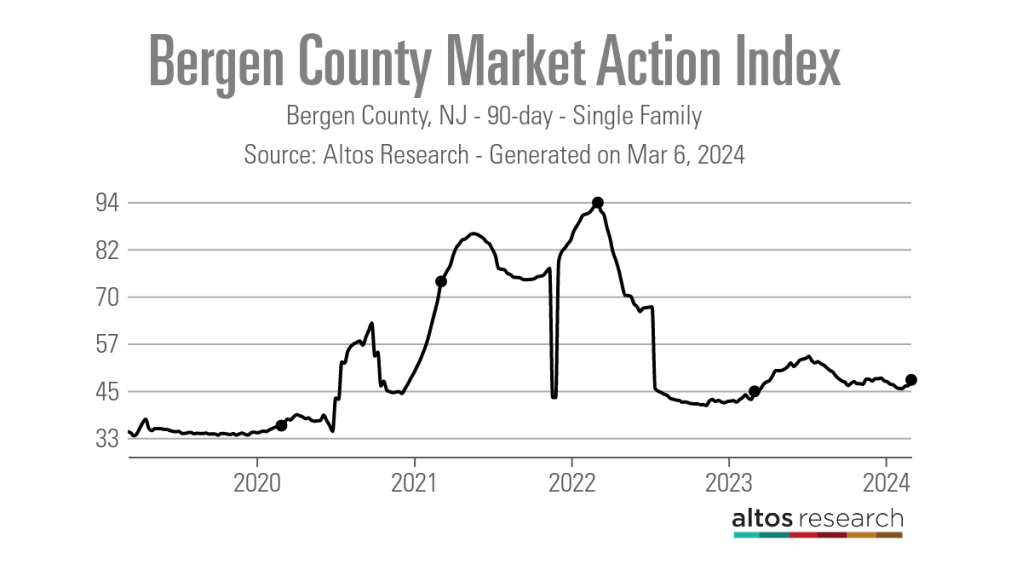
Altos Research’s Market Action Index score for the county, which has 70 municipalities, illustrates the challenges agents and their clients have faced. In March of 2022, the 90-day average Market Action Index score for the county hit a high of 93.84, before cooling over the past two years to a score of 47.98 as of March 6, 2024. Altos considers any score above 30 to be a seller’s market.
70 towns, 90 new listings
Local agents say the county’s tight inventory situation is largely to blame.
“We have been complaining about the lack of inventory for as long as I can remember, but then we at least had more listings,” Danny Yoon, an Edgewater, New Jersey-based Sotheby’s International Realty agent, said. “I was able to bring my clients to multiple listings for their consideration, but now I can only show them one or two in a given week. There is nothing to show.”
As of March 6, 2024, there was a 90-day average of 570 active single-family listings in Bergen County, according to Altos. This is down from a 90-day average of 752 active single-family listings a year ago and 2,052 active single-family listings in early March 2020, just at the onset of the COVID-19 pandemic.

“Bidding wars are still there but it isn’t as bad as during COVID,” said Lisa Comito, a broker at Howard Hanna Rand Realty and the president of Greater Bergen Realtors, which has nearly 9,000 members. “When we were coming out of COVID we were seeing 15 to 20 offers on a house, where you’d have to make a spreadsheet to show your seller. You aren’t getting that, but there is still a lot of competitive bidding.”
Like elsewhere in the country, agents blame the low interest rates of 2020 and 2021 for locking many would-be sellers into their homes.
“During the pandemic, people would downsize or sell their home on a whim,” Comito said. “Now it is a different conversation. If they are downsizing it is for quality of life or that they can’t maintain a large home anymore.”
Although agents are optimistic about what may come with the fast-approaching spring housing market, the numbers are not promising. Data from Altos Research shows that there were just 90 new single-family listings in Bergen County for the week ending March 1, 2024. This is the fewest number of new listings for the first week in March recorded in Altos’ data, which dates back to 2013.

“Some of the reports indicate that we are going to have more listings this year than last year, but the only way I can see that being correct is because we had so few listings last year,” Yoon said. “Even if we get more listings, it is not going to be enough for people. We are still going to suffer from lack of inventory.”
Prices climbing toward $1M
While questions remain over how many sellers will decide to enter the market this spring, agents are already seeing more buyers come to the market. That’s despite median list prices climbing to a record $899,000 in the first week of March 2024, up nearly $150,000 from March 2022, which Altos considers the market’s peak.
“There is a meme with two buyers sitting in chairs waiting for prices and interest rates to drop and the buyers are skeletons and I think there is some truth to that,” Corrigan said. “But now buyers are sick of waiting around and are deciding it is time to buy.”
Comito also believes the current interest rate environment is helping to encourage buyers to enter the market.
“Buyers right now have gotten more comfortable with the mortgage rates,” Comito said. “They have stayed pretty consistent, allowing people to adjust to them and they aren’t thinking as much about those low rates of the pandemic market.”
While buyers are facing inventory and interest rate challenges, agents say they are also facing competition from investors and the all-cash offers they are capable of making.
“I have well qualified clients who are putting down 25% and are coming over asking with no or limited inspections and they are getting beat out by investors with all-cash,” Corrigan said.
She noted that while some of the investors are larger corporations, there are also a lot of mom-and-pop investors out in the market, buying up inventory.
Comito noted that even first-time buyers are looking to get into rental properties.
“You are seeing first time buyers looking for multifamily properties where they can rent out the other units to help pay for their mortgage,” Comito said.
Even with the challenging housing market conditions, buyers are still flocking to Bergen County, and agents like Corrigan don’t see that changing.
“The schools are good, and everything is in close proximity,” Corrigan said. “Every town has its own unique features, whether it is a great library, the town pool, events they put on, great restaurants, it is really just a desirable place to live for so many people.”
mortgage rates real estate housing market pandemic covid-19 interest ratesUncategorized
A review of the Australian private credit market in 2023
2023 marked a year of both challenges and opportunities for the Australian private credit market. On the one hand, the tighter credit conditions in the…
Share this:


2023 marked a year of both challenges and opportunities for the Australian private credit market. On the one hand, the tighter credit conditions in the first half of the year saw decreased activity in mergers and acquisitions (M&A), project finance and real estate development financing. On the other, the latter part of the year boasted a more stable interest rate and inflation outlook, as well as improved credit margins, supporting more resilient private credit portfolios.
Ernst and Young (EY) publish an annual report on the Australian private credit landscape, which is a must-read for anyone following this asset class, whether you are a believer or still sitting on the fence. I have summarised my key learnings from this report in the article below.
Market size – despite a slow 2023, there is still a big runway for growth
In 2023, the Australian private credit market saw robust growth of 7 per cent, with total assets under management reaching AU$188 billion. Whilst solid, this was moderate compared to the 32 per cent growth experienced in 2022. According to EY, business-related loans amounted to AU$112 billion, while commercial real estate-related loans amounted to AU$76 billion. Focussing on business-related loans, this included all lending that was not commercial real estate-related, such as leveraged and sponsor lending, direct lending, middle-market, small-to-medium sized business lending (SME), special situations, distressed and venture debt.
Importantly, private credit in Australia only represented 12 per cent of the total business related-loan market. Offshore, the private credit market globally was estimated to be as large as U.S.$1.6 trillion during 2023 and forecasted to continue to grow double digits well into 2028. As such, there is clearly still a big runway for growth here domestically.
Resilient performance – some sector challenges but borrower quality is key
Performance has been a strong point of attraction in accessing Australian private credit, with majority of providers being able to continue to pay out anywhere from cash plus three per cent per annum through economic shifts and challenges such as COVID-19 and the interest rate environment over the last couple of years.
In 2023, this, in part, can be attributed to insolvencies being very company-specific and experienced in more cyclical and challenged sectors. EY noted these to be construction, accommodation, hospitality and food, business services and retail trade. The ability for private credit providers to access a growing universe of quality borrowers, leaving more traditional finance providers, is a key thematic fuelling the continued stability of outcomes. Moreover, the Reserve Bank of Australia (RBA) noted in a recent report that SME lending accounted for over 50 per cent of total business lending in Australia. Despite this, lending to Australian SMEs only grew by six per cent over the year to September 2023.
The report also notes that more than 50 per cent of SMEs have issues accessing finance from traditional providers, with time to assess and approve being cited as a major impediment. Borrowers are also seeking alternate funding providers due to the size of the loans they are after (generally less than $2 million), duration (generally less than 12 months) and seeking to provide security outside of residential property. As such, this has carved out an area of the market that is starved for funding where niche private credit providers are still able to source strong forms of protection at the borrower level for working capital-focussed lending. In fact, the Australian Banking Association approximated the Australian SME loan market to be as large as AU$451 billion in 2022.
Outlook – energy transition is a big opportunity
EY further deduces that the economy-wide energy transition is another significant theme that will impact the Australian private credit market. With the need for capital investment in energy generation, technology, and infrastructure, private credit lenders are expected to play a crucial role.
In fact, quoting another recent EY publication, “Australia must attract an estimated $1.5 trillion in capital by 2030 and up to $9 trillion by 2060 to fund the transition to net zero emissions.” What role will private credit providers play here? EY namely cites in the form of new capital investments, refinancing and acquisition of lenders or loan books as traditional finance providers closely monitor their climate-related exposures under the new Australian sustainability reporting standards.
In conclusion, the Australian private credit market is navigating challenges with resilience and is well-positioned for growth in 2024. With improving economic conditions, a focus on sustainable investments, and a track record of portfolio quality, private credit lenders are poised to play a vital role in supporting Australia’s growing debt market.
real estate covid-19

Watch Live: President Biden Reminds Americans Just How Good They’ve Got It Thanks To Him


Liquidity Problems Are Closer Than You Think


Watch: President Biden Delivers The “Darkest, Most Un-American Speech Given By A President”


Normalise the underlying conditions when “rating” a company’s share price


Interest rates, the best it gets. It’s time to deploy cash


COVID-19 Lockdowns Had High Health, Economic Costs: Swedish Study


Stock Market’s Top Will Outlast Your Disbelief
Democrats “Nervous” Ahead Of Biden’s State Of The Union Address


The Sensitivity of Economic Sentiment to News Sentiment, By Partisan Affiliation


Alteration Of Gut Microbiota Affects The Severity And Complications Of COVID-19
-

 Uncategorized2 weeks ago
All Of The Elements Are In Place For An Economic Crisis Of Staggering Proportions
-

 Uncategorized1 month ago
Cathie Wood sells a major tech stock (again)
-

 Uncategorized3 weeks ago
California Counties Could Be Forced To Pay $300 Million To Cover COVID-Era Program
-

 Uncategorized2 weeks ago
Apparel Retailer Express Moving Toward Bankruptcy
-

 Uncategorized3 weeks ago
Industrial Production Decreased 0.1% in January
-

 International1 month ago
War Delirium
-

 Uncategorized3 weeks ago
RFK Jr: The Wuhan Cover-Up & The Rise Of The Biowarfare-Industrial Complex
-

 Uncategorized3 weeks ago
GOP Efforts To Shore Up Election Security In Swing States Face Challenges