Uncategorized
Part 1: Current State of the Housing Market; Overview for mid-April 2024
Today, in the Calculated Risk Real Estate Newsletter: Part 1: Current State of the Housing Market; Overview for mid-April 2024
A brief excerpt: This 2-part overview for mid-April provides a snapshot of the current housing market.
I always like to star…
Share this:

A brief excerpt:
This 2-part overview for mid-April provides a snapshot of the current housing market.There is much more in the article.
I always like to start with inventory, since inventory usually tells the tale!
...
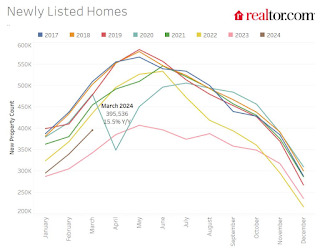
Here is a graph of new listing from Realtor.com’s March 2024 Monthly Housing Market Trends Report showing new listings were 15.5% year-over-year in March. This is still well below pre-pandemic levels. From Realtor.com:
However, providing a boost to overall inventory, sellers turned out in higher numbers this March as newly listed homes were 15.5% above last year’s levels. This marked the fifth month of increasing listing activity after a 17-month streak of decline.Note the seasonality for new listings. December and January are seasonally the weakest months of the year for new listings, followed by February and November. New listings will be up year-over-year in 2024, but still below normal levels.
There are always people that need to sell due to the so-called 3 D’s: Death, Divorce, and Disease. Also, in certain times, some homeowners will need to sell due to unemployment or excessive debt (neither is much of an issue right now).
And there are homeowners who want to sell for a number of reasons: upsizing (more babies), downsizing, moving for a new job, or moving to a nicer home or location (move-up buyers). It is some of the “want to sell” group that has been locked in with the golden handcuffs over the last couple of years, since it is financially difficult to move when your current mortgage rate is around 3%, and your new mortgage rate will be in the 6 1/2% to 7 1/2% range.
But time is a factor for this “want to sell” group, and eventually some of them will take the plunge. That is probably why we are seeing more new listings now.
Uncategorized
Popular shoe company gets a dire warning
The trendy label seems to have lost its luster with a once-enthusiastic consumer base.
Share this:


It seems like almost every day you check on the newest business headlines, a new company is either liquidating, filing for bankruptcy protection, getting delisting warnings, or somehow spiraling into what seems like a hopeless death of despair.
This is thanks in part to the continued Covid consolidation, whereby brands at anything less than their best performance over the past year have been forced to fold under the immense pressure of current market conditions.
Related: Kroger launches trendy new brand Costco doesn't have
As Covid forced — or expedited — seemingly unnatural migration patterns, many previously high-foot traffic metropolitan areas were largely abandoned for months or even years on end. High rents in these places were no longer justifiable, and a lack of incoming revenue forced many stores to shutter suddenly and ask for help.
To be sure, some retailers thrived during this period of consolidation. Giants like Walmart (WMT) , Target (TGT) , and Amazon (AMZN) rapidly gobbled up smaller competition and it now seems like every plaza has at least one of the five largest retailers in the U.S.
Other retailers like TJ Maxx, thrived as consumers finally returned to stores seeking deals and off-mall accessibility. So while retailers like Macy's (M) shuttered and crumbled, TJX was happy to sell some of its overstock labels for a fraction of the price.
Popular sneaker label gets a warning
One such company that thrived before the pandemic was Allbirds (BIRD) , a smaller brand that built comfortable shoes made of sustainable materials best suited for walking and commuting.
San Francisco Chronicle/Hearst Newspapers via Getty Images/Getty Images
A darling during the late 2010s when almost everybody went into the office every day, Allbirds catered to the crowd who wanted to look presentable at work but feel good in their feet -- and good about what they were doing for the planet. Allbirds' best-selling shoe, the Runners, are made from either wool or sustainable eucalyptus with cushioned midsoles for the perfect all-day temperature and support. They start at $98.
But Allbirds has struggled with declining sales and profit in recent years, as upscale and presentable commuters are no longer in vogue and shoppers instead opt for comfort over everything else, as is the case with Crocs (CROX) and Birkenstock.
The company tried to make a pivot to other activewear, as with women's leggings but soon found out that was a slippery slope with incumbents like Lululemon (LULU) ready to eat any newcomers' lunch — sustainable or not.
So in April, Allbirds received a noncompliance warning from Nasdaq, where it is currently listed and trades for under $1. Since the stock has traded below $1 for over 30 days, Nasdaq warned Allbirds it must get its stock price up — or be at risk of being delisted from the exchange.
It has 180 days, or until September 30, to make that change. In order to avoid delisting, it must trade for above $1 for at least 10 business days straight.
Allbirds said it "will consider actions," to take in order to avoid delisting, "but no decisions about a response have been made at this time."
Earlier in 2024, Allbirds said it will shutter between 10-15 brick-and-mortar locations in the U.S., but it still expects revenue to decline 25% or more in the fiscal year.
bankruptcy pandemic nasdaqUncategorized
March CPI: Should We Be Worried?
The inflation hawks took March’s CPI as cause for celebration, inflation may not be dead yet. There is no doubt that it was a disappointing report for…
Share this:

The inflation hawks took March’s CPI as cause for celebration, inflation may not be dead yet. There is no doubt that it was a disappointing report for those hoping we could put the pandemic inflation behind us, but there still is not much basis for thinking the Fed needs to get out the nukes and start shooting big-time.
The key point to remember is that this inflation continues to be driven overwhelmingly by rent. We know that rental inflation will be falling because we have data on marketed units, the ones that change hands, that show sharply lower rental inflation and in some cases, such as the BLS index for new tenants, actually deflation.
The CPI rental indexes will follow the index for new tenants, but with a lag. That lag is proving longer than had generally been expected, but there is no reason to question the basic logic. If people who change apartments are seeing lower rental inflation, it is pretty hard to tell a story where this doesn’t eventually show up in lower rental inflation for people who stay in the same unit.
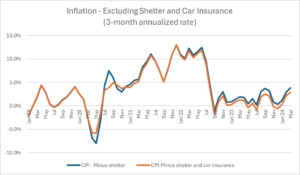
If we just look at the inflation rate excluding shelter, we have been skating close to, or even under, the Fed’s 2.0 percent target for most of 2023. The figure below shows annualized rates over the prior three months from 2019.
Source: Bureau of Labor Statistics and author’s calculations.
There definitely has been some acceleration in this measure in the last few months, but hardly an extraordinary one. We saw even larger upticks in inflation by this measure in the past, for example twice in 2019. Rent is typically a stabilizing factor in the overall inflation rate, precisely because the rate of rental inflation changes slowly.
There is another item that has played a big role in pushing inflation higher in recent years, auto insurance. The story is that premiums have risen sharply in recent years because of higher payouts in claims. (Profits have risen some as well, but we know payouts are most of the story from comparing the CPI measure which picks up gross payments, with the measure in the PCE deflator, which pulls out claims.)
Some of the story with premiums is higher costs due to higher prices for auto repairs, but much of it is simply more claims. Auto theft shot up in the pandemic but is now coming down. More long-term, people are seeing more damage due to climate-related events such as floods and hurricanes. That will be an ongoing problem.
To be clear, higher auto insurance premiums are a big deal in the sense that people have to bear these costs out of their pockets, however it is not part of a conventional inflation picture. The Fed will not be lowering auto insurance premiums by raising interest rates. The solution to climate-related damage is to try to limit climate change, but if that is off the agenda for political reasons, then people will just have to get used to higher-priced auto insurance, among other things.
Anyhow, if we pull auto insurance out of the story, in addition to rent, inflation was well below the Fed’s target for most of 2023 and actually negative at several points. We still get the acceleration in recent months to a 2.9 percent annualized rate as of March, but this hardly seems like something worth getting terribly excited over given the past behavior of this index.
In short, there is still plenty of reason for believing that the pandemic inflation is behind us. For now, the March report gave the inflation hawks some fresh meat, but a more careful look suggests that it doesn’t change the basic picture of inflation being largely under control.
The post March CPI: Should We Be Worried? appeared first on Center for Economic and Policy Research.
fed pandemic interest ratesUncategorized
A Retrospective on the Life Insurance Sector after the Failure of Silicon Valley Bank
Following the Silicon Valley Bank collapse, the stock prices of U.S banks fell amid concerns about the exposure of the banking sector to interest rate…
Share this:


Following the Silicon Valley Bank collapse, the stock prices of U.S banks fell amid concerns about the exposure of the banking sector to interest rate risk. Thus, between March 8 and March 15, 2023, the S&P 500 Bank index dropped 12.8 percent relative to S&P 500 returns (see right panel of the chart below). The stock prices of insurance companies tumbled as well, with the S&P 500 Insurance index losing 6.4 percent relative to S&P 500 returns over the same time interval (see the center panel below). Yet, insurance companies’ direct exposure to the three failed banks (Silicon Valley Bank, Silvergate, and Signature Bank) through debt and equity was modest. In this post, we examine the possible factors behind the reaction of insurance investors to the failure of Silicon Valley Bank.
Stock Price Performance in the Period Surrounding the Collapse of Silicon Valley Bank

Source: Authors’ calculations based on data from S&P Capital IQ.
Notes: This chart shows the S&P 500 index, S&P 500 Insurance index and S&P 500 Bank index over the time period February 15-March 15, 2023. The shaded area highlights the percentage change in the three indexes from March 8 to March 15 following the Silicon Valley Bank collapse.
Why Did Stock Prices of Insurance Companies Drop after the Failure of Silicon Valley Bank?
A close look at the asset and the liability sides of insurers’ balance sheets provides some insights on their exposure to interest rate risk. Our focus is on the life insurance sector, which accounts for 71 percent of U.S insurance industry assets.
Life insurance companies held $5 trillion in invested assets at the end of 2022. Corporate bonds represented the asset class in which life insurers invested the most, totaling $2 trillion, or 43 percent of invested assets. Mortgages, common stocks, municipal bonds, and government bonds followed next with portfolio shares of 13 percent, 4 percent, 4 percent, and 3 percent, respectively. Life insurance companies invested almost exclusively in investment grade bonds, but 37 percent of bonds in their portfolios are rated BBB, the lowest credit notch within the investment-grade space.
The vast majority (96 percent) of bond investments are reported in the book at cost, with the remaining being reported at fair value. As a result of the interest rate hikes, unrealized losses from marking-to-market bonds that were reported at cost in the statutory filings represented on aggregate 56 percent of total adjusted capital (the numerator of risk-based capital requirements) of life insurance companies in 2022, with significant heterogeneity across insurers. Thus, our first hypothesis is that the size of life insurers’ unrealized losses on bond investments in 2022 relative to total adjusted capital may have played a role in driving insurance investors’ response to the failure of Silicon Valley Bank.
If and the extent to which these losses may be realized depends on different factors including downgrades of securities, policyholders’ surrenders, and losses experienced on the life insurance and annuity business. On the liability-side, long-term insurance policies and annuities represent the most important sources of funding for the life insurance industry. Annuities accounted for 60 percent of total liabilities related to life, annuity, and deposit-type contracts in the general and separate accounts in 2022.
This funding source is considered quite stable given the limits and costs associated with withdrawals (for example, surrender fees and tax penalties). Surrenders are subject to swings and may increase in an environment of rising interest rates, especially in the case of fixed annuities. In 2022, withdrawable liabilities (that is, contracts that allow discretionary withdrawals) accounted for 55 percent of total liabilities related to life, annuity, and deposit type–contracts. We hypothesize that the size of withdrawable liabilities relative to total liabilities could be an additional factor behind insurance investors’ concerns after the failure of Silicon Valley Bank.
In recent years, particular attention has been devoted by academics and policymakers to variable annuities with minimum return guarantees (Drexler et al., 2017; Ellul et al., 2022; Koijen and Yogo, 2022), which represented 39 percent of aggregate reserves for annuity contracts in 2022. These consist of saving products where the funds contributed by policyholders are allocated to subaccounts invested in assets and a minimum growth rate in the annuity balance is guaranteed. Since variable annuities balances are mostly invested in stocks, insurers’ liability associated with guaranteed variable annuities increases not only if interest rates decline, but also if the stock market drops. If the returns generated by the investments are not enough to satisfy the guarantees, life insurers face a loss and may need to fund the guarantees by selling assets in their general account. Thus, we hypothesize that the size of variable annuities with minimum guarantees to total liabilities could be a third factor explaining investors’ response to the failure of Silicon Valley Bank.
The Stock Returns of Life Insurers around the Silicon Valley Bank Event Correlate with Their Unrealized Losses and Liability Conditions
To test our hypotheses, we collect stock prices and balance sheet data on twenty-nine U.S. insurance groups primarily engaged in the life insurance business (henceforth abridged “life insurance firms”). For each firm, we calculate the following three metrics: i) unrealized losses on bonds issued by unaffiliated entities and reported at cost as a percentage of total adjusted capital, ii) withdrawable liabilities as a percentage of total liabilities related to life, annuity, and deposit type-contracts, and iii) guaranteed variable annuity reserves as a percentage of total liabilities related to life, annuity, and deposit type-contracts. Although these metrics exhibit a positive pairwise correlation, they should nevertheless capture different dimensions of risk to some extent. Next, we construct a set of size-weighted portfolios of these publicly listed firms based on whether each of the three metrics is above or below its median in 2022 and then calculate the cumulative stock returns for each portfolio over the time period March 7 to March 15, 2023.
Cumulative Stock Returns of Life Insurers around the Silicon Valley Bank Collapse by Sub-groups based on Unrealized Losses and Liability Conditions

Notes: This chart shows cumulative stock returns over the time period March 7 to March 15, 2023, for different size-weighted portfolios of publicly listed life insurance firms. We construct each portfolio by splitting the sample based on firms above and below the 2022 median of the following metrics: i) unrealized losses on investments in bonds issued by unaffiliated entities and reported at cost as a percentage of total adjusted capital, ii) withdrawable liabilities as a percentage of total liabilities related to life, annuity, and deposit type-contracts, and iii) guaranteed variable annuity reserves as a percentage of total liabilities related to life, annuity, and deposit type-contracts.
The three plots presented in the chart above provide empirical evidence that is consistent with our hypotheses. In particular, insurance firms with unrealized losses exposure, withdrawable liability exposure, and variable annuity exposure above the median experienced negative cumulative returns that are 8 percent, 4 percent, and 5 percent lower than below-median firms, respectively. Our result for the variable annuity exposure is consistent with Ellul et al. (2022) and Koijen and Yogo (2022), who document that life insurance firms with large guaranteed variable annuity business exhibited a worse stock performance than the insurance industry during the global financial crisis and the COVID-19 pandemic. Overall, the negative performance of life insurance stocks amid the failure of Silicon Valley Bank exhibits the strongest relation with the size of unrealized losses relative to total adjusted capital.
Sensitivity of Life Insurance Companies’ Stock Returns to Bond Returns

Notes: This chart reports the estimates of the coefficient of the two-factor model, as in Brewer, Mondschean, and Strahan (1993) and Berends et al. (2013), capturing the sensitivity of life insurers’ stock returns to bond returns. In the two-factor model, we regress the daily stock returns of a set of twenty-nine life insurance firms on the CRSP value-weighted market index and the holding return of a ten-year Treasury bond. We estimate the model within non-overlapping rolling windows of one year.
Sensitivity of Life Insurers’ Stocks Returns to Interest Rates
How did the overall exposure of life insurance firms to interest rate risk evolve following the interest rate hikes of 2022? To address this question, we estimate the sensitivity of life insurance stock returns to changes in interest rates relying on a two-factor model as in Brewer, Mondschean, and Strahan (1993) and Berends et al. (2013). The above chart reports the estimates for each year of the coefficient capturing the sensitivity of life insurers’ stock returns to the return on a ten-year Treasury bond. During the 2016-22 period, the response of life insurers’ stock returns to bond returns is negative, consistent with a negative duration gap (that is, liabilities having a longer duration than assets). The upward jump in the estimated coefficient between 2021 and 2022 is consistent with a shortening of liabilities compared to assets (for example, because surrenders are more likely) following the interest rate hikes of 2022. The worse stock performance of insurance firms with larger unrealized losses exposure and withdrawable liability exposure after the failure of Silicon Valley Bank is in line with this market-implied shift in insurers’ exposure to interest rate risk.
Fulvia Fringuellotti is a financial research economist in Non-Bank Financial Institution Studies in the Federal Reserve Bank of New York’s Research and Statistics Group.

Sakteh Prazad is a senior research analyst in the Federal Reserve Bank of New York’s Research and Statistics Group.
How to cite this post:
Fulvia Fringuellotti and Saketh Prazad, “A Retrospective on the Life Insurance Sector after the Failure of Silicon Valley Bank,” Federal Reserve Bank of New York Liberty Street Economics, April 10, 2024, https://libertystreeteconomics.newyorkfed.org/2024/04/a-retrospective-on-the-life-insurance-sector-after-the-failure-of-silicon-valley-bank/.


Disclaimer
The views expressed in this post are those of the author(s) and do not necessarily reflect the position of the Federal Reserve Bank of New York or the Federal Reserve System. Any errors or omissions are the responsibility of the author(s).


NetZero And Human Rights Are Mutually Exclusive


The Media Hates It, But It’s Time to Go All In on This Kind of Stock


CMS121 mitigates aging-related obesity and metabolic dysfunction


March CPI: Should We Be Worried?


Guest Contribution: “The Federal Funds Rate: FOMC Projections, Policy Rule Prescriptions, and Futures Market Probabilities from the March 2024 Meeting”


Meet Grab: Southeast Asia’s post-Uber “everything app”


History of Crypto: DeFi revolution during a global crisis


Big comeback? The Q1 report on biotech is in, and there’s been some sputtering


A Retrospective on the Life Insurance Sector after the Failure of Silicon Valley Bank


Is Gold Warning Us Or Running With The Markets?
-

 International3 weeks ago
Parexel CEO to retire; CAR-T maker AffyImmune promotes business leader to chief executive
-

 Spread & Containment4 weeks ago
IFM’s Hat Trick and Reflections On Option-To-Buy M&A
-

 International1 month ago
EyePoint poaches medical chief from Apellis; Sandoz CFO, longtime BioNTech exec to retire
-

 International1 month ago
Walmart launches clever answer to Target’s new membership program
-

 Government4 days ago
Climate-Con & The Media-Censorship Complex – Part 1
-

 Spread & Containment2 days ago
FDA Finally Takes Down Ivermectin Posts After Settlement
-

 Uncategorized1 week ago
Vaccinated People Show Long COVID-Like Symptoms With Detectable Spike Proteins: Preprint Study
-

 Uncategorized5 days ago
Can language models read the genome? This one decoded mRNA to make better vaccines.