Uncategorized
A Retrospective on the Life Insurance Sector after the Failure of Silicon Valley Bank
Following the Silicon Valley Bank collapse, the stock prices of U.S banks fell amid concerns about the exposure of the banking sector to interest rate…
Share this:


Following the Silicon Valley Bank collapse, the stock prices of U.S banks fell amid concerns about the exposure of the banking sector to interest rate risk. Thus, between March 8 and March 15, 2023, the S&P 500 Bank index dropped 12.8 percent relative to S&P 500 returns (see right panel of the chart below). The stock prices of insurance companies tumbled as well, with the S&P 500 Insurance index losing 6.4 percent relative to S&P 500 returns over the same time interval (see the center panel below). Yet, insurance companies’ direct exposure to the three failed banks (Silicon Valley Bank, Silvergate, and Signature Bank) through debt and equity was modest. In this post, we examine the possible factors behind the reaction of insurance investors to the failure of Silicon Valley Bank.
Stock Price Performance in the Period Surrounding the Collapse of Silicon Valley Bank

Source: Authors’ calculations based on data from S&P Capital IQ.
Notes: This chart shows the S&P 500 index, S&P 500 Insurance index and S&P 500 Bank index over the time period February 15-March 15, 2023. The shaded area highlights the percentage change in the three indexes from March 8 to March 15 following the Silicon Valley Bank collapse.
Why Did Stock Prices of Insurance Companies Drop after the Failure of Silicon Valley Bank?
A close look at the asset and the liability sides of insurers’ balance sheets provides some insights on their exposure to interest rate risk. Our focus is on the life insurance sector, which accounts for 71 percent of U.S insurance industry assets.
Life insurance companies held $5 trillion in invested assets at the end of 2022. Corporate bonds represented the asset class in which life insurers invested the most, totaling $2 trillion, or 43 percent of invested assets. Mortgages, common stocks, municipal bonds, and government bonds followed next with portfolio shares of 13 percent, 4 percent, 4 percent, and 3 percent, respectively. Life insurance companies invested almost exclusively in investment grade bonds, but 37 percent of bonds in their portfolios are rated BBB, the lowest credit notch within the investment-grade space.
The vast majority (96 percent) of bond investments are reported in the book at cost, with the remaining being reported at fair value. As a result of the interest rate hikes, unrealized losses from marking-to-market bonds that were reported at cost in the statutory filings represented on aggregate 56 percent of total adjusted capital (the numerator of risk-based capital requirements) of life insurance companies in 2022, with significant heterogeneity across insurers. Thus, our first hypothesis is that the size of life insurers’ unrealized losses on bond investments in 2022 relative to total adjusted capital may have played a role in driving insurance investors’ response to the failure of Silicon Valley Bank.
If and the extent to which these losses may be realized depends on different factors including downgrades of securities, policyholders’ surrenders, and losses experienced on the life insurance and annuity business. On the liability-side, long-term insurance policies and annuities represent the most important sources of funding for the life insurance industry. Annuities accounted for 60 percent of total liabilities related to life, annuity, and deposit-type contracts in the general and separate accounts in 2022.
This funding source is considered quite stable given the limits and costs associated with withdrawals (for example, surrender fees and tax penalties). Surrenders are subject to swings and may increase in an environment of rising interest rates, especially in the case of fixed annuities. In 2022, withdrawable liabilities (that is, contracts that allow discretionary withdrawals) accounted for 55 percent of total liabilities related to life, annuity, and deposit type–contracts. We hypothesize that the size of withdrawable liabilities relative to total liabilities could be an additional factor behind insurance investors’ concerns after the failure of Silicon Valley Bank.
In recent years, particular attention has been devoted by academics and policymakers to variable annuities with minimum return guarantees (Drexler et al., 2017; Ellul et al., 2022; Koijen and Yogo, 2022), which represented 39 percent of aggregate reserves for annuity contracts in 2022. These consist of saving products where the funds contributed by policyholders are allocated to subaccounts invested in assets and a minimum growth rate in the annuity balance is guaranteed. Since variable annuities balances are mostly invested in stocks, insurers’ liability associated with guaranteed variable annuities increases not only if interest rates decline, but also if the stock market drops. If the returns generated by the investments are not enough to satisfy the guarantees, life insurers face a loss and may need to fund the guarantees by selling assets in their general account. Thus, we hypothesize that the size of variable annuities with minimum guarantees to total liabilities could be a third factor explaining investors’ response to the failure of Silicon Valley Bank.
The Stock Returns of Life Insurers around the Silicon Valley Bank Event Correlate with Their Unrealized Losses and Liability Conditions
To test our hypotheses, we collect stock prices and balance sheet data on twenty-nine U.S. insurance groups primarily engaged in the life insurance business (henceforth abridged “life insurance firms”). For each firm, we calculate the following three metrics: i) unrealized losses on bonds issued by unaffiliated entities and reported at cost as a percentage of total adjusted capital, ii) withdrawable liabilities as a percentage of total liabilities related to life, annuity, and deposit type-contracts, and iii) guaranteed variable annuity reserves as a percentage of total liabilities related to life, annuity, and deposit type-contracts. Although these metrics exhibit a positive pairwise correlation, they should nevertheless capture different dimensions of risk to some extent. Next, we construct a set of size-weighted portfolios of these publicly listed firms based on whether each of the three metrics is above or below its median in 2022 and then calculate the cumulative stock returns for each portfolio over the time period March 7 to March 15, 2023.
Cumulative Stock Returns of Life Insurers around the Silicon Valley Bank Collapse by Sub-groups based on Unrealized Losses and Liability Conditions

Notes: This chart shows cumulative stock returns over the time period March 7 to March 15, 2023, for different size-weighted portfolios of publicly listed life insurance firms. We construct each portfolio by splitting the sample based on firms above and below the 2022 median of the following metrics: i) unrealized losses on investments in bonds issued by unaffiliated entities and reported at cost as a percentage of total adjusted capital, ii) withdrawable liabilities as a percentage of total liabilities related to life, annuity, and deposit type-contracts, and iii) guaranteed variable annuity reserves as a percentage of total liabilities related to life, annuity, and deposit type-contracts.
The three plots presented in the chart above provide empirical evidence that is consistent with our hypotheses. In particular, insurance firms with unrealized losses exposure, withdrawable liability exposure, and variable annuity exposure above the median experienced negative cumulative returns that are 8 percent, 4 percent, and 5 percent lower than below-median firms, respectively. Our result for the variable annuity exposure is consistent with Ellul et al. (2022) and Koijen and Yogo (2022), who document that life insurance firms with large guaranteed variable annuity business exhibited a worse stock performance than the insurance industry during the global financial crisis and the COVID-19 pandemic. Overall, the negative performance of life insurance stocks amid the failure of Silicon Valley Bank exhibits the strongest relation with the size of unrealized losses relative to total adjusted capital.
Sensitivity of Life Insurance Companies’ Stock Returns to Bond Returns

Notes: This chart reports the estimates of the coefficient of the two-factor model, as in Brewer, Mondschean, and Strahan (1993) and Berends et al. (2013), capturing the sensitivity of life insurers’ stock returns to bond returns. In the two-factor model, we regress the daily stock returns of a set of twenty-nine life insurance firms on the CRSP value-weighted market index and the holding return of a ten-year Treasury bond. We estimate the model within non-overlapping rolling windows of one year.
Sensitivity of Life Insurers’ Stocks Returns to Interest Rates
How did the overall exposure of life insurance firms to interest rate risk evolve following the interest rate hikes of 2022? To address this question, we estimate the sensitivity of life insurance stock returns to changes in interest rates relying on a two-factor model as in Brewer, Mondschean, and Strahan (1993) and Berends et al. (2013). The above chart reports the estimates for each year of the coefficient capturing the sensitivity of life insurers’ stock returns to the return on a ten-year Treasury bond. During the 2016-22 period, the response of life insurers’ stock returns to bond returns is negative, consistent with a negative duration gap (that is, liabilities having a longer duration than assets). The upward jump in the estimated coefficient between 2021 and 2022 is consistent with a shortening of liabilities compared to assets (for example, because surrenders are more likely) following the interest rate hikes of 2022. The worse stock performance of insurance firms with larger unrealized losses exposure and withdrawable liability exposure after the failure of Silicon Valley Bank is in line with this market-implied shift in insurers’ exposure to interest rate risk.
Fulvia Fringuellotti is a financial research economist in Non-Bank Financial Institution Studies in the Federal Reserve Bank of New York’s Research and Statistics Group.

Sakteh Prazad is a senior research analyst in the Federal Reserve Bank of New York’s Research and Statistics Group.
How to cite this post:
Fulvia Fringuellotti and Saketh Prazad, “A Retrospective on the Life Insurance Sector after the Failure of Silicon Valley Bank,” Federal Reserve Bank of New York Liberty Street Economics, April 10, 2024, https://libertystreeteconomics.newyorkfed.org/2024/04/a-retrospective-on-the-life-insurance-sector-after-the-failure-of-silicon-valley-bank/.


Disclaimer
The views expressed in this post are those of the author(s) and do not necessarily reflect the position of the Federal Reserve Bank of New York or the Federal Reserve System. Any errors or omissions are the responsibility of the author(s).
Uncategorized
Big comeback? The Q1 report on biotech is in, and there’s been some sputtering
Bioregnum Opinion Column by John Carroll
DealForma’s Chris Dokomajilar has been running the numbers again and backs up some of the things we were already…
Share this:


DealForma’s Chris Dokomajilar has been running the numbers again and backs up some of the things we were already pretty sure about — while raising new questions about just how deep and lasting this biotech recovery can be.
At the top of the list of Q1 trends: PIPEs are brimming, follow-ons are up and the IPO window is open — kind of.

Quite a few of the so-called sophisticated investors — deep-pocket players who have been hanging out at the corner of biotech and Wall Street for some time — turned to PIPEs for their next round of returns after the IPO boom went bust at the end of the pandemic. And Dokomajilar picked up on that with his chart illustrating 48 privately negotiated fundraisings for publicly traded companies that contributed to a record $4.4 billion in PIPE cash for quite a few companies that had found their valuations under the gun.
 Chris Dokomajilar
That’s a record for this burgeoning sector, which clearly underscores the importance of finding new ways for public biotechs to raise cash. It also highlights where the money is these days as a slew of biotechs continue to grapple with problematic valuations.
In the first quarter of last year, PIPEs contributed a quarter of what we saw in the recent three-month tally as the buzz on PIPEs grew loud. The trend is definitely pointed up. We’ll be following this one closely throughout the year.
Follow-ons also took a big leap in Q1, helping make the case that biotech was staging a comeback. The surge of 48 deals — mirroring the figure for PIPEs — accounted for $10 billion for the industry. That’s the most we’ve seen since the end of 2021, and another indication of the biotech thaw we’ve been watching in the public markets.

IPOs rev up in Q1, but not everyone wins
After bumping along the bottom of the financial charts for two long years, IPOs clearly started pumping meaningful amounts of cash into the industry again, even though the returns were clearly variable.
There were some obvious trends to be seen in the numbers, including different handling for the preclinical and the clinical, as investors were hunting human data — just like most of the VCs have been. Some popped and faded, a few just faded and a hardy few held on to — or grew — ambitious pricing figures.
Add it all up and $3.9 billion in IPO money was added to the revenue pie chart. That followed a miserable $400 million or so in the same period in 2023, as biotech was sidelined during a long, cold winter on Wall Street.
One of the top IPOs of the quarter was posted by CG Oncology $CGON, now up sharply over its initial pricing for an upsized offering. Metagenomi bobbled the ball a bit at first but has been holding steady — not bad for a preclinical biotech. But some, like Fractyl Health $GUTS, are struggling.
Now we’ll be tracking the next round of IPOs to see just how selective investors are when it comes to picking and choosing from new offerings. What we’re seeing now is a distinct improvement, but it looks like the road back will come with plenty of pitfalls and speed bumps.

M&A falls quiet following a buzzy Q4 breakout
With Wall Street dormant, it was encouraging to see a spike in M&A at the end of last year. That movement, indicating that Big Pharma was finally ready to get down to filling some less-than-impressive pipelines, helped pave the way for the industry to get excited about exits again, and finally cashing out of projects that had — let’s face it — often gone much further than many execs and investors had hoped for.
The trend has been a bit jerky over the past two years and can be easily influenced by one or two big deals.
So what happened in Q1?
A whole lot less.
DealForma’s numbers indicate that the M&A pace — with total deal cash plus contingent payments falling just shy of $20 billion — came in at a significantly reduced pace over the $60.3 billion figure seen in Q4, with 26 deals accounted for.
Bolt-on buyouts have been all the rage for years now, and Dokomajilar highlights that pharma’s interest tends to center on modest gambles in the $1 billion to $2 billion mark. That’s in keeping with lower valuations and an asset-centered approach that’s all about finding promising human data to back up a case for near-term market capitalization. But Q1’s relatively slow pace isn’t likely to keep investors hungry for new investments that might also be rewarded a big slice of M&A for the payoff.
We’ll see soon if this was just a lull or something more deep-seated.


Licensing pacts also stumble off the Q4 pace
Overall, Q1 2024 dealmaking came in at about the same muted level as Q1 2023, accounting for $36 billion largely dependent on IOUs for success. It also arrived after the big Q4 bang, which takes the luster out of the number. And the $2.2 billion that arrived in cash upfront underscores how much of the whole licensing pact field relies on promises of biobucks.
That compares with about $12 billion in upfront for licensing deals for all of last year. In Q4 the total deal value hit an impressive $72.3 billion, with more than $7 billion handed out in cash or equity.
In addition, the frenzied ADC sector slowed in Q1, though we have seen recent evidence that the appetite for more of these pacts is far from sated. Note that this is one quarter versus each year, so it’s not really an apples-to-apples comparison. And Dokomajilar highlights the $22 billion Daiichi/Merck ADC deal last October, which included a $4 billion upfront in Q4. He adds that we’ve also seen a pickup in M&A deals for ADCs in Q1.

VCs stay on pace with 2019, but there’s still no upturn
The VC chart at DealForma recorded $12.4 billion for the sector, of which $6.5 billion went into drugs and platform tech.
That’s in keeping with Q2 and Q3 of last year when you narrow the score to biotech. There was also $4.2 billion for manufacturing/services last quarter, a level we haven’t seen in a couple of years.
There were 306 VC deals in the first three months of the year, according to DealForma. That’s slightly ahead of pace compared to 1,176 recorded last year — but just slightly.
As far as biotech is concerned, VCs continue to walk at a measured pace, compared to the sprint we saw during the Covid eruption when seemingly all deals worked and practically every biotech could find a home on Wall Street — provided they had a good enough story to tell.
Now they’re holding to a pattern that is just ahead of 2019, which is all perfectly respectable. But the VCs are also selectively backing private startups for longer periods of time. There’s no indication here that VCs are significantly changing the game as we head into Q2. And that will be a drag on company creation.
preclinical pandemic recoveryUncategorized
Visualizing America’s Shortage Of Affordable Homes
Visualizing America’s Shortage Of Affordable Homes
A large share of affordable homes vanished over the pandemic, leading the supply to hit…
Share this:

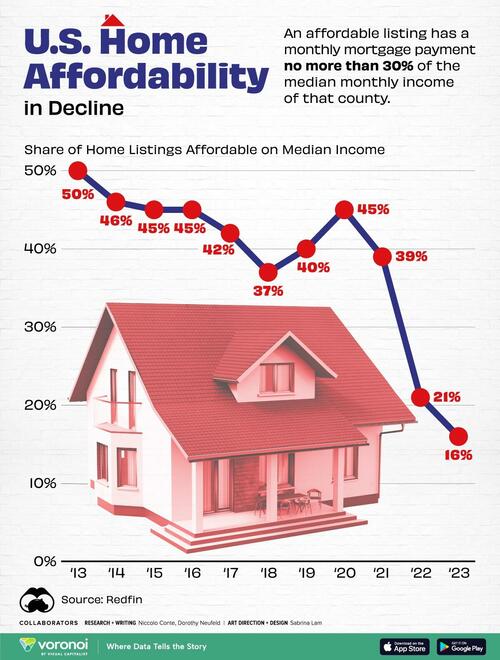
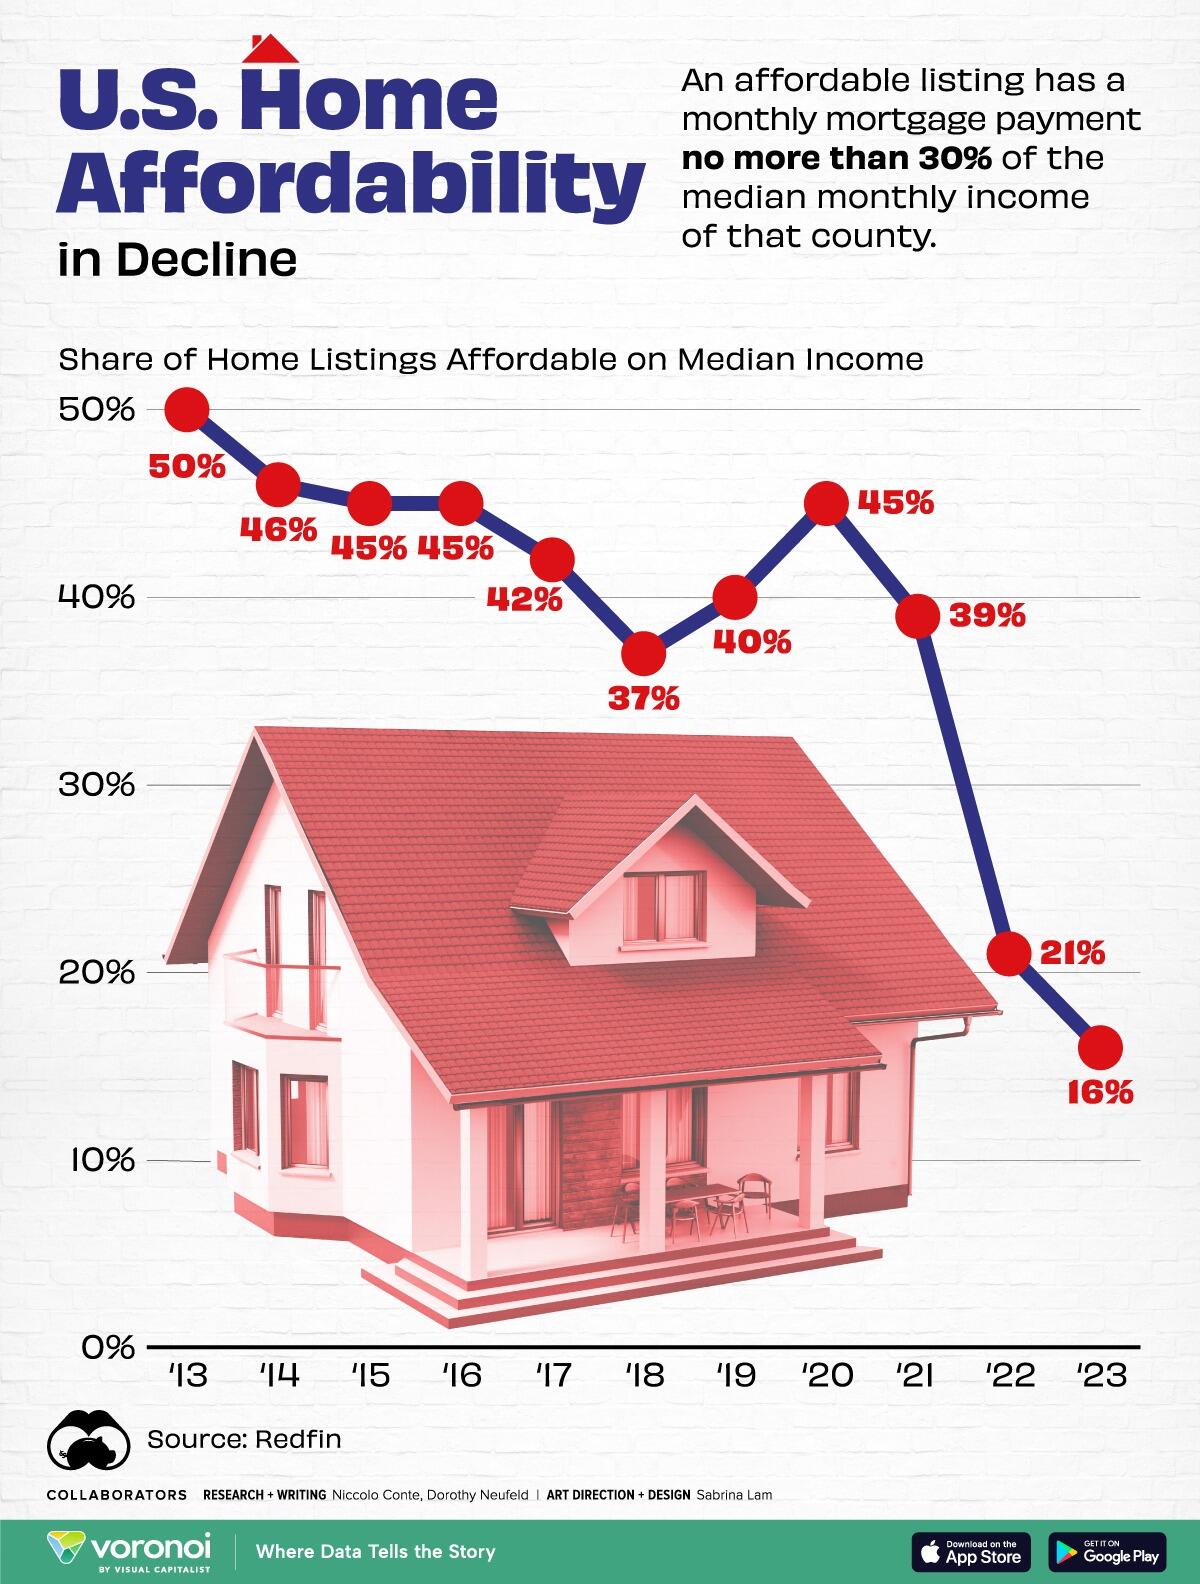
A large share of affordable homes vanished over the pandemic, leading the supply to hit its lowest level on record in 2023.
Many buyers have become priced out of the market due to soaring home prices and high interest rates. Last year alone, the number of affordable homes shrank by almost 41%, equal to over 243,000 properties.
This graphic, via Visual Capitalist's Dorothy Neufeld, shows the dwindling supply of affordable U.S. homes, based on data from Redfin.
The Sharp Decline in Housing Affordability
In 2023, only 16% of homes were affordable in America, falling from 21% in the year before.
An affordable listing was defined as one with a monthly mortgage payment no more than 30% of the median monthly income of that county. Below, we show the share of affordable listings in the 97 biggest U.S. metropolitan areas by population:
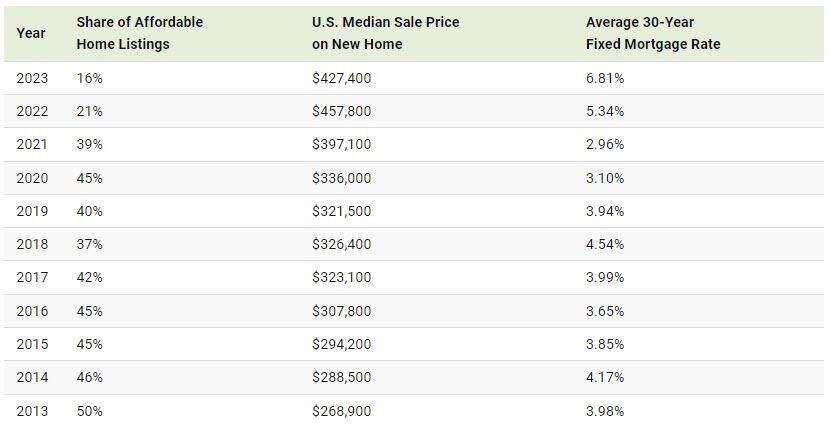
As the above table shows, housing affordability has grown increasingly out of reach as mortgage rates have more than doubled in just two years.
While affordable homes made up 39% of the market in 2021, the share dropped precipitously as interest rates climbed higher. In 2023, the average annual 30-year fixed mortgage rates reached 6.81%—hitting its highest level in 20 years.
Although mortgage rates may decline over the year if the Federal Reserve cuts interest rates, it may not be enough to boost the supply of affordable housing.
That’s because rates may not fall sharply enough to undo the “golden hand-cuff” effect, where homeowners are reluctant to sell in order to hold on to their low mortgage rates. Adding to this, home construction has fallen significantly since the global financial crisis. During this time, home builders and lenders became increasingly cautious, leading home construction to drop 55% between 2006 and 2021.
What Comes Next?
The good news is that new-home construction is forecast to increase in 2024, with single-family housing starts projected to grow 4.7%.
While new home sales have historically comprised 10-12% of the single-family home market, they have recently surged to 30% due to the collapsing supply of existing homes. But even as new supply enters the market, it will likely take a number of years for housing affordability return to historical levels.
In fact, JP Morgan suggests that it could take two years if mortgage rates drop by 1 percentage point, assuming that home prices remained at all-time highs and wages continued rising at their current pace.
Uncategorized
Visualizing America’s Shortage Of Affordable Homes
Visualizing America’s Shortage Of Affordable Homes
A large share of affordable homes vanished over the pandemic, leading the supply to hit…
Share this:

A large share of affordable homes vanished over the pandemic, leading the supply to hit its lowest level on record in 2023.
Many buyers have become priced out of the market due to soaring home prices and high interest rates. Last year alone, the number of affordable homes shrank by almost 41%, equal to over 243,000 properties.
This graphic, via Visual Capitalist's Dorothy Neufeld, shows the dwindling supply of affordable U.S. homes, based on data from Redfin.
The Sharp Decline in Housing Affordability
In 2023, only 16% of homes were affordable in America, falling from 21% in the year before.
An affordable listing was defined as one with a monthly mortgage payment no more than 30% of the median monthly income of that county. Below, we show the share of affordable listings in the 97 biggest U.S. metropolitan areas by population:
As the above table shows, housing affordability has grown increasingly out of reach as mortgage rates have more than doubled in just two years.
While affordable homes made up 39% of the market in 2021, the share dropped precipitously as interest rates climbed higher. In 2023, the average annual 30-year fixed mortgage rates reached 6.81%—hitting its highest level in 20 years.
Although mortgage rates may decline over the year if the Federal Reserve cuts interest rates, it may not be enough to boost the supply of affordable housing.
That’s because rates may not fall sharply enough to undo the “golden hand-cuff” effect, where homeowners are reluctant to sell in order to hold on to their low mortgage rates. Adding to this, home construction has fallen significantly since the global financial crisis. During this time, home builders and lenders became increasingly cautious, leading home construction to drop 55% between 2006 and 2021.
What Comes Next?
The good news is that new-home construction is forecast to increase in 2024, with single-family housing starts projected to grow 4.7%.
While new home sales have historically comprised 10-12% of the single-family home market, they have recently surged to 30% due to the collapsing supply of existing homes. But even as new supply enters the market, it will likely take a number of years for housing affordability return to historical levels.
In fact, JP Morgan suggests that it could take two years if mortgage rates drop by 1 percentage point, assuming that home prices remained at all-time highs and wages continued rising at their current pace.


United Airlines passenger incident triggers blunt reaction


NetZero And Human Rights Are Mutually Exclusive


The Media Hates It, But It’s Time to Go All In on This Kind of Stock


CMS121 mitigates aging-related obesity and metabolic dysfunction


US Consumer Price Index CPI – USD/JPY Technical Analysis


Guest Contribution: “The Federal Funds Rate: FOMC Projections, Policy Rule Prescriptions, and Futures Market Probabilities from the March 2024 Meeting”


Meet Grab: Southeast Asia’s post-Uber “everything app”


History of Crypto: DeFi revolution during a global crisis


Penny-pinching buyers are driving down sales of the Big Three’s most profitable segment


Big comeback? The Q1 report on biotech is in, and there’s been some sputtering
-

 International3 weeks ago
Parexel CEO to retire; CAR-T maker AffyImmune promotes business leader to chief executive
-

 Spread & Containment4 weeks ago
IFM’s Hat Trick and Reflections On Option-To-Buy M&A
-

 International1 month ago
EyePoint poaches medical chief from Apellis; Sandoz CFO, longtime BioNTech exec to retire
-

 International1 month ago
Walmart launches clever answer to Target’s new membership program
-

 Spread & Containment3 days ago
Climate-Con & The Media-Censorship Complex – Part 1
-

 Spread & Containment1 day ago
FDA Finally Takes Down Ivermectin Posts After Settlement
-

 Uncategorized1 week ago
Vaccinated People Show Long COVID-Like Symptoms With Detectable Spike Proteins: Preprint Study
-

 Uncategorized5 days ago
Can language models read the genome? This one decoded mRNA to make better vaccines.