Uncategorized
Neuroscience Antibodies and Assays Market 2023-2027 Along with 5-Year Historic (2017-2021) Industry Size & Comparison of 20 Vendors and 12 Countries
Neuroscience Antibodies and Assays Market 2023-2027 Along with 5-Year Historic (2017-2021) Industry Size & Comparison of 20 Vendors and 12 Countries
PR Newswire
NEW YORK, Nov. 9, 2022
NEW YORK, Nov. 9, 2022 /PRNewswire/ — The Neuroscience Anti…
Share this:

Neuroscience Antibodies and Assays Market 2023-2027 Along with 5-Year Historic (2017-2021) Industry Size & Comparison of 20 Vendors and 12 Countries
PR Newswire
NEW YORK, Nov. 9, 2022
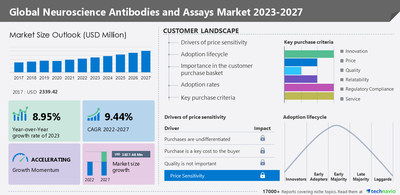
NEW YORK, Nov. 9, 2022 /PRNewswire/ -- The Neuroscience Antibodies and Assays Market share is expected to increase by USD 1837.68 million from 2022 to 2027, with an accelerated CAGR of 9.44% - according to the recent market study by Technavio. This report also offers a 5-year historic (2017-2021) data projection of market size, segment, and region. The Y-O-Y growth rate of the Neuroscience Antibodies and Assays Market is estimated at 8.95% as of 2023. Moreover, the market is fragmented. Our analysts have conducted an internal and external analysis of vendors to help companies understand the wider business environment as well as the strength and weaknesses of key market players. Our report also forecasts the Bargaining Power of Buyers & Suppliers and the Threat of New Entrants & Rivalry ranging between LOW-MODERATE during the forecast period.
- One of the core components of customer landscape is Price Sensitivity – an analysis of which will help companies refine marketing strategies to gain a competitive advantage.
- Moreover, this report also provides impact of price sensitivity drivers (purchases are undifferentiated, purchase is a key cost to the buyer, and quality is not important), which are expected to range between LOW-NEUTRAL from 2023-2027.
- Our report provides extensive information on the customer landscape of the Neuroscience Antibodies and Assays market, involving qualitative and quantitative intelligence.
FOR A DETAILED OVERVIEW OF CUSTOMER LANDSCAPE, REQUEST SAMPLE PAGES
The Neuroscience Antibodies and Assays Market Report Also Offers Information on the Criticality of Inputs, R&D, Capex, Technology, Labor, and Brand of 20 Vendors Listed Below –
- Abnova Corp.
- ADx NeuroSciences NV
- Bio-Rad Laboratories Inc.
- Biosensis Pty Ltd.
- BMG LABTECH GmbH
- Cell Signaling Technology Inc.
- Chemie Brunschwig AG
- Elabscience Biotechnology Inc.
- Enzo Biochem Inc.
- F. Hoffmann La Roche Ltd.
- GenScript Biotech Corp.
- Merck & Co. Inc.
- NSJ Bioreagents
- PerkinElmer Inc.
- Proteintech Group Inc.
- Rockland Immunochemicals Inc.
- Santa Cruz Biotechnology Inc.
- Siemens AG
- Thermo Fisher Scientific Inc.
DOWNLOAD SAMPLE REPORT FOR MORE ACCESS
Chart & Data Table on 5-Year Historic (2017-2021) Market Size, Comparison and Y-O-Y Growth of Neuroscience Antibodies and Assays Industry Segment
- The market is segmented by Product (Consumables and Instruments) and End-user (Pharmaceutical and Biopharmaceutical Companies, Academic and Research Institutes, and Hospital and Diagnostic Centers).
- By Product - The consumables segment shows a gradual increase in demand during 2023-2027.
- A wide range of assay kits, antibodies, and reagents are used in neuroscience assays to provide high-throughput screening of clinical compounds, discover new disease targets, understand the mechanism of action, and develop clinically relevant biomarkers. There are two types of consumables, namely antibodies and assay kits and reagents.
- The demand for neuroscience antibodies, assay kits, antigens, and reagents has increased significantly owing to the discovery of new potential drug targets, signaling molecules, and structural proteins in the brain. Moreover, the rising importance of neuroscience processes and neurodegenerative diseases research and the wide availability of antibodies, assay kits, and reagents will drive the growth of the consumables segment during the forecast period.
INTERESTED TO PROCURE THE DATA?
Patients with neurological disorders, such as stroke, epilepsy, Parkinson's disease, and brain tumors, have a high risk of developing a disability. These disorders develop due to various factors such as genetic factors, bacterial and viral infections, and the lack of immune response. Parkinson's Disease (PD) is one of the most common neurological diseases affecting the population. According to the Centers for Disease Control and Prevention (CDC), the prevalence of Parkinson's disease rises from 1% to 4% among people aged 60-80 years. Therefore, factors such as the rising prevalence of neurological disorders and the increasing demand for treating such disorders will fuel the growth of the global neuroscience antibodies and assays market during the forecast period.
TO ACCESS THE LATEST DRIVERS, TRENDS, AND CHALLENGES INFLUENCING THE GROWTH OF THIS MARKET, REQUEST SAMPLE REPORT
Chart & Data Table on Historic Market Size (2017-2021), Comparison and Y-O-Y Growth of 11 Countries of Neuroscience Antibodies and Assays Industry
- The market is segmented by Geography into North America (The US and Canada), Europe (The UK, Germany, France, and Rest of Europe), Asia (China and India), and ROW (Argentina, Australia, Brazil, and Rest of the World).
- North America is projected to contribute 46% to market growth by 2027. North America was the most significant contributing region in the global neuroscience antibodies and assays market, primarily owing to the increasing demand for the diagnosis of neurological disorders. For instance, approximately 6.2 million Americans aged 65 years and above had Alzheimer's disease and dementia, as of March 2021. This figure could grow to 13.8 million by 2060. Thus, the growing aging population, the high prevalence of neurological disorders, high healthcare expenditure on treating neurological diseases, and favorable reimbursement policies for neuro-diagnostic procedures are expected to drive regional market growth during the forecast period.
- The outbreak of COVID-19 increased the demand for neuroscience antibodies and assays in North America. Patients diagnosed with COVID-19 are prone to neurologic complications. Thus, the rise in neurological disorders due to COVID-19 will lead to R&D related to neurological symptoms, which will positively impact the market during the forecast period. Moreover, lockdown restrictions were lifted owing to large-scale vaccination drives by governments in Q4 2020. This, in turn, is expected to drive the growth of the regional market during the forecast period.
FOR MORE INSIGHTS ON THE MARKET SHARE OF VARIOUS REGIONS, VIEW PDF SAMPLE NOW!
Bispecific Antibodies for Cancer Market by Type and Geography - Forecast and Analysis 2022-2026 – The market share is expected to increase by USD 396.56 million from 2021 to 2026, and the market's growth momentum will accelerate at a CAGR of 9.06%. Furthermore, this report extensively covers market segmentation by type (CD19 or CD3 and CD30 or CD16A) and geography (North America, Europe, Asia, and Rest of World (ROW)). To get more exclusive research insights: VIEW SUMMARY OF THE REPORT FOR MORE
Anti-CD20 Monoclonal Antibodies (mABs) Market by Product and Geography - Forecast and Analysis 2022-2026 – The market share is expected to increase by USD 9.05 billion from 2021 to 2026, and the market's growth momentum will accelerate at a CAGR of 9.81%. The increased use of combination therapies is one of the key factors driving the market growth. To get more exclusive research insights: VIEW SUMMARY OF THE REPORT FOR MORE
Neuroscience Antibodies And Assays Market Scope | |
Report Coverage | Details |
Page number | 120 |
Base year | 2022 |
Historical year | 2017-2021 |
Forecast period | 2023-2027 |
Growth momentum & CAGR | Accelerate at a CAGR of 9.44% |
Market growth 2023-2027 | USD 1837.68 million |
Market structure | Fragmented |
YoY growth (%) | 8.95 |
Regional analysis | North America, Europe, Asia, and the Rest of the World (ROW) |
Performing market contribution | North America at 46% |
Key consumer countries | US, Germany, UK, France, and China |
Competitive landscape | Leading companies, Competitive Strategies, Consumer engagement scope |
Key companies profiled | Abcam plc, Abnova Corp., ADx NeuroSciences NV, Bio-Rad Laboratories Inc., Biosensis Pty Ltd., BMG LABTECH GmbH, Cell Signaling Technology Inc., Chemie Brunschwig AG, Elabscience Biotechnology Inc., Enzo Biochem Inc., F. Hoffmann La Roche Ltd., GenScript Biotech Corp., Merck & Co. Inc., NSJ Bioreagents, PerkinElmer Inc., Proteintech Group Inc., Rockland Immunochemicals Inc., Santa Cruz Biotechnology Inc., Siemens AG, and Thermo Fisher Scientific Inc. |
Market dynamics | Parent market analysis, Market growth inducers and obstacles, Fast-growing and slow-growing segment analysis, COVID-19 impact and recovery analysis and future consumer dynamics, and Market condition analysis for the forecast period. |
Customization purview | If our report has not included the data that you are looking for, you can reach out to our analysts and get segments customized. |
Browse Health Care Market Reports
1 Executive Summary
- 1.1 Market overview
- Exhibit 01: Executive Summary – Chart on Market Overview
- Exhibit 02: Executive Summary – Data Table on Market Overview
- Exhibit 03: Executive Summary – Chart on Global Market Characteristics
- Exhibit 04: Executive Summary – Chart on Market by Geography
- Exhibit 05: Executive Summary – Chart on Market Segmentation by Product
- Exhibit 06: Executive Summary – Chart on Market Segmentation by End-user
- Exhibit 07: Executive Summary – Chart on Incremental Growth
- Exhibit 08: Executive Summary – Data Table on Incremental Growth
- Exhibit 09: Executive Summary – Chart on Vendor Market Positioning
2 Market Landscape
- 2.1 Market ecosystem
- Exhibit 10: Parent market
- Exhibit 11: Market Characteristics
3 Market Sizing
- 3.1 Market definition
- Exhibit 12: Offerings of vendors included in the market definition
- 3.2 Market segment analysis
- Exhibit 13: Market segments
- 3.3 Market size 2022
- 3.4 Market outlook: Forecast for 2022-2027
- Exhibit 14: Chart on Global - Market size and forecast 2022-2027 ($ million)
- Exhibit 15: Data Table on Global - Market size and forecast 2022-2027 ($ million)
- Exhibit 16: Chart on Global Market: Year-over-year growth 2022-2027 (%)
- Exhibit 17: Data Table on Global Market: Year-over-year growth 2022-2027 (%)
4 Historic Market Size
- 4.1 Global neuroscience antibodies and assays market 2017 - 2021
- Exhibit 18: Historic Market Size – Data Table on Global neuroscience antibodies and assays market 2017 - 2021 ($ million)
- 4.2 Product Segment Analysis 2017 - 2021
- Exhibit 19: Historic Market Size – Product Segment 2017 - 2021 ($ million)
- 4.3 End-user Segment Analysis 2017 - 2021
- Exhibit 20: Historic Market Size – End-user Segment 2017 - 2021 ($ million)
- 4.4 Geography Segment Analysis 2017 - 2021
- Exhibit 21: Historic Market Size – Geography Segment 2017 - 2021 ($ million)
- 4.5 Country Segment Analysis 2017 - 2021
- Exhibit 22: Historic Market Size – Country Segment 2017 - 2021 ($ million)
5 Five Forces Analysis
- 5.1 Five forces summary
- Exhibit 23: Five forces analysis - Comparison between2022 and 2027
- 5.2 Bargaining power of buyers
- Exhibit 24: Chart on Bargaining power of buyers – Impact of key factors 2022 and 2027
- 5.3 Bargaining power of suppliers
- Exhibit 25: Bargaining power of suppliers – Impact of key factors in 2022 and 2027
- 5.4 Threat of new entrants
- Exhibit 26: Threat of new entrants – Impact of key factors in 2022 and 2027
- 5.5 Threat of substitutes
- Exhibit 27: Threat of substitutes – Impact of key factors in 2022 and 2027
- 5.6 Threat of rivalry
- Exhibit 28: Threat of rivalry – Impact of key factors in 2022 and 2027
- 5.7 Market condition
- Exhibit 29: Chart on Market condition - Five forces 2022 and 2027
6 Market Segmentation by Product
- 6.1 Market segments
- Exhibit 30: Chart on Product - Market share 2022-2027 (%)
- Exhibit 31: Data Table on Product - Market share 2022-2027 (%)
- 6.2 Comparison by Product
- Exhibit 32: Chart on Comparison by Product
- Exhibit 33: Data Table on Comparison by Product
- 6.3 Consumables - Market size and forecast 2022-2027
- Exhibit 34: Chart on Consumables - Market size and forecast 2022-2027 ($ million)
- Exhibit 35: Data Table on Consumables - Market size and forecast 2022-2027 ($ million)
- Exhibit 36: Chart on Consumables - Year-over-year growth 2022-2027 (%)
- Exhibit 37: Data Table on Consumables - Year-over-year growth 2022-2027 (%)
- 6.4 Instruments - Market size and forecast 2022-2027
- Exhibit 38: Chart on Instruments - Market size and forecast 2022-2027 ($ million)
- Exhibit 39: Data Table on Instruments - Market size and forecast 2022-2027 ($ million)
- Exhibit 40: Chart on Instruments - Year-over-year growth 2022-2027 (%)
- Exhibit 41: Data Table on Instruments - Year-over-year growth 2022-2027 (%)
- 6.5 Market opportunity by Product
- Exhibit 42: Market opportunity by Product ($ million)
7 Market Segmentation by End-user
- 7.1 Market segments
- Exhibit 43: Chart on End-user - Market share 2022-2027 (%)
- Exhibit 44: Data Table on End-user - Market share 2022-2027 (%)
- 7.2 Comparison by End-user
- Exhibit 45: Chart on Comparison by End-user
- Exhibit 46: Data Table on Comparison by End-user
- 7.3 Pharmaceutical and biopharmaceutical companies - Market size and forecast 2022-2027
- Exhibit 47: Chart on Pharmaceutical and biopharmaceutical companies - Market size and forecast 2022-2027 ($ million)
- Exhibit 48: Data Table on Pharmaceutical and biopharmaceutical companies - Market size and forecast 2022-2027 ($ million)
- Exhibit 49: Chart on Pharmaceutical and biopharmaceutical companies - Year-over-year growth 2022-2027 (%)
- Exhibit 50: Data Table on Pharmaceutical and biopharmaceutical companies - Year-over-year growth 2022-2027 (%)
- 7.4 Academic and research institutes - Market size and forecast 2022-2027
- Exhibit 51: Chart on Academic and research institutes - Market size and forecast 2022-2027 ($ million)
- Exhibit 52: Data Table on Academic and research institutes - Market size and forecast 2022-2027 ($ million)
- Exhibit 53: Chart on Academic and research institutes - Year-over-year growth 2022-2027 (%)
- Exhibit 54: Data Table on Academic and research institutes - Year-over-year growth 2022-2027 (%)
- 7.5 Hospital and diagnostic centers - Market size and forecast 2022-2027
- Exhibit 55: Chart on Hospital and diagnostic centers - Market size and forecast 2022-2027 ($ million)
- Exhibit 56: Data Table on Hospital and diagnostic centers - Market size and forecast 2022-2027 ($ million)
- Exhibit 57: Chart on Hospital and diagnostic centers - Year-over-year growth 2022-2027 (%)
- Exhibit 58: Data Table on Hospital and diagnostic centers - Year-over-year growth 2022-2027 (%)
- 7.6 Market opportunity by End-user
- Exhibit 59: Market opportunity by End-user ($ million)
8 Customer Landscape
- 8.1 Customer landscape overview
- Exhibit 60: Analysis of price sensitivity, lifecycle, customer purchase basket, adoption rates, and purchase criteria
9 Geographic Landscape
- 9.1 Geographic segmentation
- Exhibit 61: Chart on Market share by geography 2022-2027 (%)
- Exhibit 62: Data Table on Market share by geography 2022-2027 (%)
- 9.2 Geographic comparison
- Exhibit 63: Chart on Geographic comparison
- Exhibit 64: Data Table on Geographic comparison
- 9.3 North America - Market size and forecast 2022-2027
- Exhibit 65: Chart on North America - Market size and forecast 2022-2027 ($ million)
- Exhibit 66: Data Table on North America - Market size and forecast 2022-2027 ($ million)
- Exhibit 67: Chart on North America - Year-over-year growth 2022-2027 (%)
- Exhibit 68: Data Table on North America - Year-over-year growth 2022-2027 (%)
- 9.4 Europe - Market size and forecast 2022-2027
- Exhibit 69: Chart on Europe - Market size and forecast 2022-2027 ($ million)
- Exhibit 70: Data Table on Europe - Market size and forecast 2022-2027 ($ million)
- Exhibit 71: Chart on Europe - Year-over-year growth 2022-2027 (%)
- Exhibit 72: Data Table on Europe - Year-over-year growth 2022-2027 (%)
- 9.5 Asia - Market size and forecast 2022-2027
- Exhibit 73: Chart on Asia - Market size and forecast 2022-2027 ($ million)
- Exhibit 74: Data Table on Asia - Market size and forecast 2022-2027 ($ million)
- Exhibit 75: Chart on Asia - Year-over-year growth 2022-2027 (%)
- Exhibit 76: Data Table on Asia - Year-over-year growth 2022-2027 (%)
- 9.6 Rest of World (ROW) - Market size and forecast 2022-2027
- Exhibit 77: Chart on Rest of World (ROW) - Market size and forecast 2022-2027 ($ million)
- Exhibit 78: Data Table on Rest of World (ROW) - Market size and forecast 2022-2027 ($ million)
- Exhibit 79: Chart on Rest of World (ROW) - Year-over-year growth 2022-2027 (%)
- Exhibit 80: Data Table on Rest of World (ROW) - Year-over-year growth 2022-2027 (%)
- 9.7 US - Market size and forecast 2022-2027
- Exhibit 81: Chart on US - Market size and forecast 2022-2027 ($ million)
- Exhibit 82: Data Table on US - Market size and forecast 2022-2027 ($ million)
- Exhibit 83: Chart on US - Year-over-year growth 2022-2027 (%)
- Exhibit 84: Data Table on US - Year-over-year growth 2022-2027 (%)
- 9.8 Germany - Market size and forecast 2022-2027
- Exhibit 85: Chart on Germany - Market size and forecast 2022-2027 ($ million)
- Exhibit 86: Data Table on Germany - Market size and forecast 2022-2027 ($ million)
- Exhibit 87: Chart on Germany - Year-over-year growth 2022-2027 (%)
- Exhibit 88: Data Table on Germany - Year-over-year growth 2022-2027 (%)
- 9.9 China - Market size and forecast 2022-2027
- Exhibit 89: Chart on China - Market size and forecast 2022-2027 ($ million)
- Exhibit 90: Data Table on China - Market size and forecast 2022-2027 ($ million)
- Exhibit 91: Chart on China - Year-over-year growth 2022-2027 (%)
- Exhibit 92: Data Table on China - Year-over-year growth 2022-2027 (%)
- 9.10 UK - Market size and forecast 2022-2027
- Exhibit 93: Chart on UK - Market size and forecast 2022-2027 ($ million)
- Exhibit 94: Data Table on UK - Market size and forecast 2022-2027 ($ million)
- Exhibit 95: Chart on UK - Year-over-year growth 2022-2027 (%)
- Exhibit 96: Data Table on UK - Year-over-year growth 2022-2027 (%)
- 9.11 France - Market size and forecast 2022-2027
- Exhibit 97: Chart on France - Market size and forecast 2022-2027 ($ million)
- Exhibit 98: Data Table on France - Market size and forecast 2022-2027 ($ million)
- Exhibit 99: Chart on France - Year-over-year growth 2022-2027 (%)
- Exhibit 100: Data Table on France - Year-over-year growth 2022-2027 (%)
- 9.12 Market opportunity by geography
- Exhibit 101: Market opportunity by geography ($ million)
10 Drivers, Challenges, and Trends
- 10.1 Market drivers
- 10.2 Market challenges
- 10.3 Impact of drivers and challenges
- Exhibit 102: Impact of drivers and challenges in 2022 and 2027
- 10.4 Market trends
11 Vendor Landscape
- 11.1 Overview
- 11.2 Vendor landscape
- Exhibit 103: Overview on Criticality of inputs and Factors of differentiation
- 11.3 Landscape disruption
- Exhibit 104: Overview on factors of disruption
- 11.4 Industry risks
- Exhibit 105: Impact of key risks on business
12 Vendor Analysis
- 12.1 Vendors covered
- Exhibit 106: Vendors covered
- 12.2 Market positioning of vendors
- Exhibit 107: Matrix on vendor position and classification
- 12.3 Abcam plc
- Exhibit 108: Abcam plc - Overview
- Exhibit 109: Abcam plc - Product / Service
- Exhibit 110: Abcam plc - Key news
- Exhibit 111: Abcam plc - Key offerings
- 12.4 Abnova Corp.
- Exhibit 112: Abnova Corp. - Overview
- Exhibit 113: Abnova Corp. - Product / Service
- Exhibit 114: Abnova Corp. - Key offerings
- 12.5 ADx NeuroSciences NV
- Exhibit 115: ADx NeuroSciences NV - Overview
- Exhibit 116: ADx NeuroSciences NV - Product / Service
- Exhibit 117: ADx NeuroSciences NV - Key offerings
- 12.6 Bio Rad Laboratories Inc.
- Exhibit 118: Bio Rad Laboratories Inc. - Overview
- Exhibit 119: Bio Rad Laboratories Inc. - Business segments
- Exhibit 120: Bio Rad Laboratories Inc. - Key news
- Exhibit 121: Bio Rad Laboratories Inc. - Key offerings
- Exhibit 122: Bio Rad Laboratories Inc. - Segment focus
- 12.7 BMG LABTECH GmbH
- Exhibit 123: BMG LABTECH GmbH - Overview
- Exhibit 124: BMG LABTECH GmbH - Product / Service
- Exhibit 125: BMG LABTECH GmbH - Key offerings
- 12.8 Cell Signaling Technology Inc.
- Exhibit 126: Cell Signaling Technology Inc. - Overview
- Exhibit 127: Cell Signaling Technology Inc. - Product / Service
- Exhibit 128: Cell Signaling Technology Inc. - Key offerings
- 12.9 Chemie Brunschwig AG
- Exhibit 129: Chemie Brunschwig AG - Overview
- Exhibit 130: Chemie Brunschwig AG - Product / Service
- Exhibit 131: Chemie Brunschwig AG - Key offerings
- 12.10 Elabscience Biotechnology Inc.
- Exhibit 132: Elabscience Biotechnology Inc. - Overview
- Exhibit 133: Elabscience Biotechnology Inc. - Product / Service
- Exhibit 134: Elabscience Biotechnology Inc. - Key offerings
- 12.11 F. Hoffmann La Roche Ltd.
- Exhibit 135: F. Hoffmann La Roche Ltd. - Overview
- Exhibit 136: F. Hoffmann La Roche Ltd. - Business segments
- Exhibit 137: F. Hoffmann La Roche Ltd. - Key news
- Exhibit 138: F. Hoffmann La Roche Ltd. - Key offerings
- Exhibit 139: F. Hoffmann La Roche Ltd. - Segment focus
- 12.12 GenScript Biotech Corp.
- Exhibit 140: GenScript Biotech Corp. - Overview
- Exhibit 141: GenScript Biotech Corp. - Business segments
- Exhibit 142: GenScript Biotech Corp. - Key news
- Exhibit 143: GenScript Biotech Corp. - Key offerings
- Exhibit 144: GenScript Biotech Corp. - Segment focus
- 12.13 Merck and Co. Inc.
- Exhibit 145: Merck and Co. Inc. - Overview
- Exhibit 146: Merck and Co. Inc. - Business segments
- Exhibit 147: Merck and Co. Inc. - Key news
- Exhibit 148: Merck and Co. Inc. - Key offerings
- Exhibit 149: Merck and Co. Inc. - Segment focus
- 12.14 PerkinElmer Inc.
- Exhibit 150: PerkinElmer Inc. - Overview
- Exhibit 151: PerkinElmer Inc. - Business segments
- Exhibit 152: PerkinElmer Inc. - Key news
- Exhibit 153: PerkinElmer Inc. - Key offerings
- Exhibit 154: PerkinElmer Inc. - Segment focus
- 12.15 Rockland Immunochemicals Inc.
- Exhibit 155: Rockland Immunochemicals Inc. - Overview
- Exhibit 156: Rockland Immunochemicals Inc. - Product / Service
- Exhibit 157: Rockland Immunochemicals Inc. - Key offerings
- 12.16 Santa Cruz Biotechnology Inc.
- Exhibit 158: Santa Cruz Biotechnology Inc. - Overview
- Exhibit 159: Santa Cruz Biotechnology Inc. - Product / Service
- Exhibit 160: Santa Cruz Biotechnology Inc. - Key offerings
- 12.17 Thermo Fisher Scientific Inc.
- Exhibit 161: Thermo Fisher Scientific Inc. - Overview
- Exhibit 162: Thermo Fisher Scientific Inc. - Business segments
- Exhibit 163: Thermo Fisher Scientific Inc. - Key news
- Exhibit 164: Thermo Fisher Scientific Inc. - Key offerings
- Exhibit 165: Thermo Fisher Scientific Inc. - Segment focus
13 Appendix
- 13.1 Scope of the report
- 13.2 Inclusions and exclusions checklist
- Exhibit 166: Inclusions checklist
- Exhibit 167: Exclusions checklist
- 13.3 Currency conversion rates for US$
- Exhibit 168: Currency conversion rates for US$
- 13.4 Research methodology
- Exhibit 169: Research methodology
- Exhibit 170: Validation techniques employed for market sizing
- Exhibit 171: Information sources
- 13.5 List of abbreviations
- Exhibit 172: List of abbreviations
Technavio is a leading global technology research and advisory company. Their research and analysis focus on emerging market trends and provide actionable insights to help businesses identify market opportunities and develop effective strategies to optimize their market positions. With over 500 specialized analysts, Technavio's report library Their client base consists of enterprises of all sizes, including more than 100 Fortune 500 companies. This growing client base relies on Technavio's comprehensive coverage, extensive research, and actionable market insights to identify opportunities in existing and potential markets and assess their competitive positions within changing market scenarios.
Contact
Technavio Research
Jesse Maida
Media & Marketing Executive
US: +1 844 364 1100
UK: +44 203 893 3200
Email: media@technavio.com
Website: www.technavio.com/

View original content to download multimedia:https://www.prnewswire.com/news-releases/neuroscience-antibodies-and-assays-market-2023-2027-along-with-5-year-historic-2017-2021-industry-size--comparison-of-20-vendors-and-12-countries-301671647.html
SOURCE Technavio
Uncategorized
Mortgage rates fall as labor market normalizes
Jobless claims show an expanding economy. We will only be in a recession once jobless claims exceed 323,000 on a four-week moving average.
Share this:


Everyone was waiting to see if this week’s jobs report would send mortgage rates higher, which is what happened last month. Instead, the 10-year yield had a muted response after the headline number beat estimates, but we have negative job revisions from previous months. The Federal Reserve’s fear of wage growth spiraling out of control hasn’t materialized for over two years now and the unemployment rate ticked up to 3.9%. For now, we can say the labor market isn’t tight anymore, but it’s also not breaking.
The key labor data line in this expansion is the weekly jobless claims report. Jobless claims show an expanding economy that has not lost jobs yet. We will only be in a recession once jobless claims exceed 323,000 on a four-week moving average.
From the Fed: In the week ended March 2, initial claims for unemployment insurance benefits were flat, at 217,000. The four-week moving average declined slightly by 750, to 212,250
Below is an explanation of how we got here with the labor market, which all started during COVID-19.
1. I wrote the COVID-19 recovery model on April 7, 2020, and retired it on Dec. 9, 2020. By that time, the upfront recovery phase was done, and I needed to model out when we would get the jobs lost back.
2. Early in the labor market recovery, when we saw weaker job reports, I doubled and tripled down on my assertion that job openings would get to 10 million in this recovery. Job openings rose as high as to 12 million and are currently over 9 million. Even with the massive miss on a job report in May 2021, I didn’t waver.
Currently, the jobs openings, quit percentage and hires data are below pre-COVID-19 levels, which means the labor market isn’t as tight as it once was, and this is why the employment cost index has been slowing data to move along the quits percentage.

3. I wrote that we should get back all the jobs lost to COVID-19 by September of 2022. At the time this would be a speedy labor market recovery, and it happened on schedule, too
Total employment data
4. This is the key one for right now: If COVID-19 hadn’t happened, we would have between 157 million and 159 million jobs today, which would have been in line with the job growth rate in February 2020. Today, we are at 157,808,000. This is important because job growth should be cooling down now. We are more in line with where the labor market should be when averaging 140K-165K monthly. So for now, the fact that we aren’t trending between 140K-165K means we still have a bit more recovery kick left before we get down to those levels.

From BLS: Total nonfarm payroll employment rose by 275,000 in February, and the unemployment rate increased to 3.9 percent, the U.S. Bureau of Labor Statistics reported today. Job gains occurred in health care, in government, in food services and drinking places, in social assistance, and in transportation and warehousing.
Here are the jobs that were created and lost in the previous month:

In this jobs report, the unemployment rate for education levels looks like this:
- Less than a high school diploma: 6.1%
- High school graduate and no college: 4.2%
- Some college or associate degree: 3.1%
- Bachelor’s degree or higher: 2.2%

Today’s report has continued the trend of the labor data beating my expectations, only because I am looking for the jobs data to slow down to a level of 140K-165K, which hasn’t happened yet. I wouldn’t categorize the labor market as being tight anymore because of the quits ratio and the hires data in the job openings report. This also shows itself in the employment cost index as well. These are key data lines for the Fed and the reason we are going to see three rate cuts this year.
recession unemployment covid-19 fed federal reserve mortgage rates recession recovery unemploymentUncategorized
Inside The Most Ridiculous Jobs Report In History: Record 1.2 Million Immigrant Jobs Added In One Month
Inside The Most Ridiculous Jobs Report In History: Record 1.2 Million Immigrant Jobs Added In One Month
Last month we though that the January…
Share this:


Last month we though that the January jobs report was the "most ridiculous in recent history" but, boy, were we wrong because this morning the Biden department of goalseeked propaganda (aka BLS) published the February jobs report, and holy crap was that something else. Even Goebbels would blush.
What happened? Let's take a closer look.
On the surface, it was (almost) another blockbuster jobs report, certainly one which nobody expected, or rather just one bank out of 76 expected. Starting at the top, the BLS reported that in February the US unexpectedly added 275K jobs, with just one research analyst (from Dai-Ichi Research) expecting a higher number.
Some context: after last month's record 4-sigma beat, today's print was "only" 3 sigma higher than estimates. Needless to say, two multiple sigma beats in a row used to only happen in the USSR... and now in the US, apparently.

Before we go any further, a quick note on what last month we said was "the most ridiculous jobs report in recent history": it appears the BLS read our comments and decided to stop beclowing itself. It did that by slashing last month's ridiculous print by over a third, and revising what was originally reported as a massive 353K beat to just 229K, a 124K revision, which was the biggest one-month negative revision in two years!

Of course, that does not mean that this month's jobs print won't be revised lower: it will be, and not just that month but every other month until the November election because that's the only tool left in the Biden admin's box: pretend the economic and jobs are strong, then revise them sharply lower the next month, something we pointed out first last summer and which has not failed to disappoint once.
In the past month the Biden department of goalseeking stuff higher before revising it lower, has revised the following data sharply lower:
— zerohedge (@zerohedge) August 30, 2023
- Jobs
- JOLTS
- New Home sales
- Housing Starts and Permits
- Industrial Production
- PCE and core PCE
To be fair, not every aspect of the jobs report was stellar (after all, the BLS had to give it some vague credibility). Take the unemployment rate, after flatlining between 3.4% and 3.8% for two years - and thus denying expectations from Sahm's Rule that a recession may have already started - in February the unemployment rate unexpectedly jumped to 3.9%, the highest since February 2022 (with Black unemployment spiking by 0.3% to 5.6%, an indicator which the Biden admin will quickly slam as widespread economic racism or something).

And then there were average hourly earnings, which after surging 0.6% MoM in January (since revised to 0.5%) and spooking markets that wage growth is so hot, the Fed will have no choice but to delay cuts, in February the number tumbled to just 0.1%, the lowest in two years...

... for one simple reason: last month's average wage surge had nothing to do with actual wages, and everything to do with the BLS estimate of hours worked (which is the denominator in the average wage calculation) which last month tumbled to just 34.1 (we were led to believe) the lowest since the covid pandemic...

... but has since been revised higher while the February print rose even more, to 34.3, hence why the latest average wage data was once again a product not of wages going up, but of how long Americans worked in any weekly period, in this case higher from 34.1 to 34.3, an increase which has a major impact on the average calculation.

While the above data points were examples of some latent weakness in the latest report, perhaps meant to give it a sheen of veracity, it was everything else in the report that was a problem starting with the BLS's latest choice of seasonal adjustments (after last month's wholesale revision), which have gone from merely laughable to full clownshow, as the following comparison between the monthly change in BLS and ADP payrolls shows. The trend is clear: the Biden admin numbers are now clearly rising even as the impartial ADP (which directly logs employment numbers at the company level and is far more accurate), shows an accelerating slowdown.

But it's more than just the Biden admin hanging its "success" on seasonal adjustments: when one digs deeper inside the jobs report, all sorts of ugly things emerge... such as the growing unprecedented divergence between the Establishment (payrolls) survey and much more accurate Household (actual employment) survey. To wit, while in January the BLS claims 275K payrolls were added, the Household survey found that the number of actually employed workers dropped for the third straight month (and 4 in the past 5), this time by 184K (from 161.152K to 160.968K).

This means that while the Payrolls series hits new all time highs every month since December 2020 (when according to the BLS the US had its last month of payrolls losses), the level of Employment has not budged in the past year. Worse, as shown in the chart below, such a gaping divergence has opened between the two series in the past 4 years, that the number of Employed workers would need to soar by 9 million (!) to catch up to what Payrolls claims is the employment situation.

There's more: shifting from a quantitative to a qualitative assessment, reveals just how ugly the composition of "new jobs" has been. Consider this: the BLS reports that in February 2024, the US had 132.9 million full-time jobs and 27.9 million part-time jobs. Well, that's great... until you look back one year and find that in February 2023 the US had 133.2 million full-time jobs, or more than it does one year later! And yes, all the job growth since then has been in part-time jobs, which have increased by 921K since February 2023 (from 27.020 million to 27.941 million).

Here is a summary of the labor composition in the past year: all the new jobs have been part-time jobs!

But wait there's even more, because now that the primary season is over and we enter the heart of election season and political talking points will be thrown around left and right, especially in the context of the immigration crisis created intentionally by the Biden administration which is hoping to import millions of new Democratic voters (maybe the US can hold the presidential election in Honduras or Guatemala, after all it is their citizens that will be illegally casting the key votes in November), what we find is that in February, the number of native-born workers tumbled again, sliding by a massive 560K to just 129.807 million. Add to this the December data, and we get a near-record 2.4 million plunge in native-born workers in just the past 3 months (only the covid crash was worse)!

The offset? A record 1.2 million foreign-born (read immigrants, both legal and illegal but mostly illegal) workers added in February!

Said otherwise, not only has all job creation in the past 6 years has been exclusively for foreign-born workers...

... but there has been zero job-creation for native born workers since June 2018!

This is a huge issue - especially at a time of an illegal alien flood at the southwest border...

... and is about to become a huge political scandal, because once the inevitable recession finally hits, there will be millions of furious unemployed Americans demanding a more accurate explanation for what happened - i.e., the illegal immigration floodgates that were opened by the Biden admin.
Which is also why Biden's handlers will do everything in their power to insure there is no official recession before November... and why after the election is over, all economic hell will finally break loose. Until then, however, expect the jobs numbers to get even more ridiculous.
Uncategorized
Economic Earthquake Ahead? The Cracks Are Spreading Fast
Economic Earthquake Ahead? The Cracks Are Spreading Fast
Authored by Brandon Smith via Alt-Market.us,
One of my favorite false narratives…
Share this:


Authored by Brandon Smith via Alt-Market.us,
One of my favorite false narratives floating around corporate media platforms has been the argument that the American people “just don’t seem to understand how good the economy really is right now.” If only they would look at the stats, they would realize that we are in the middle of a financial renaissance, right? It must be that people have been brainwashed by negative press from conservative sources…
I have to laugh at this notion because it’s a very common one throughout history – it’s an assertion made by almost every single political regime right before a major collapse. These people always say the same things, and when you study economics as long as I have you can’t help but throw up your hands and marvel at their dedication to the propaganda.
One example that comes to mind immediately is the delusional optimism of the “roaring” 1920s and the lead up to the Great Depression. At the time around 60% of the U.S. population was living in poverty conditions (according to the metrics of the decade) earning less than $2000 a year. However, in the years after WWI ravaged Europe, America’s economic power was considered unrivaled.
The 1920s was an era of mass production and rampant consumerism but it was all fueled by easy access to debt, a condition which had not really existed before in America. It was this illusion of prosperity created by the unchecked application of credit that eventually led to the massive stock market bubble and the crash of 1929. This implosion, along with the Federal Reserve’s policy of raising interest rates into economic weakness, created a black hole in the U.S. financial system for over a decade.
There are two primary tools that various failing regimes will often use to distort the true conditions of the economy: Debt and inflation. In the case of America today, we are experiencing BOTH problems simultaneously and this has made certain economic indicators appear healthy when they are, in fact, highly unstable. The average American knows this is the case because they see the effects everyday. They see the damage to their wallets, to their buying power, in the jobs market and in their quality of life. This is why public faith in the economy has been stuck in the dregs since 2021.
The establishment can flash out-of-context stats in people’s faces, but they can’t force the populace to see a recovery that simply does not exist. Let’s go through a short list of the most faulty indicators and the real reasons why the fiscal picture is not a rosy as the media would like us to believe…
The “miracle” labor market recovery
In the case of the U.S. labor market, we have a clear example of distortion through inflation. The $8 trillion+ dropped on the economy in the first 18 months of the pandemic response sent the system over the edge into stagflation land. Helicopter money has a habit of doing two things very well: Blowing up a bubble in stock markets and blowing up a bubble in retail. Hence, the massive rush by Americans to go out and buy, followed by the sudden labor shortage and the race to hire (mostly for low wage part-time jobs).
The problem with this “miracle” is that inflation leads to price explosions, which we have already experienced. The average American is spending around 30% more for goods, services and housing compared to what they were spending in 2020. This is what happens when you have too much money chasing too few goods and limited production.
The jobs market looks great on paper, but the majority of jobs generated in the past few years are jobs that returned after the covid lockdowns ended. The rest are jobs created through monetary stimulus and the artificial retail rush. Part time low wage service sector jobs are not going to keep the country rolling for very long in a stagflation environment. The question is, what happens now that the stimulus punch bowl has been removed?
Just as we witnessed in the 1920s, Americans have turned to debt to make up for higher prices and stagnant wages by maxing out their credit cards. With the central bank keeping interest rates high, the credit safety net will soon falter. This condition also goes for businesses; the same businesses that will jump headlong into mass layoffs when they realize the party is over. It happened during the Great Depression and it will happen again today.
Cracks in the foundation
We saw cracks in the narrative of the financial structure in 2023 with the banking crisis, and without the Federal Reserve backstop policy many more small and medium banks would have dropped dead. The weakness of U.S. banks is offset by the relative strength of the U.S. dollar, which lures in foreign investors hoping to protect their wealth using dollar denominated assets.
But something is amiss. Gold and bitcoin have rocketed higher along with economically sensitive assets and the dollar. This is the opposite of what’s supposed to happen. Gold and BTC are supposed to be hedges against a weak dollar and a weak economy, right? If global faith in the dollar and in the U.S. economy is so high, why are investors diving into protective assets like gold?
Again, as noted above, inflation distorts everything.
Tens of trillions of extra dollars printed by the Fed are floating around and it’s no surprise that much of that cash is flooding into the economy which simply pushes higher right along with prices on the shelf. But, gold and bitcoin are telling us a more honest story about what’s really happening.
Right now, the U.S. government is adding around $600 billion per month to the national debt as the Fed holds rates higher to fight inflation. This debt is going to crush America’s financial standing for global investors who will eventually ask HOW the U.S. is going to handle that growing millstone? As I predicted years ago, the Fed has created a perfect Catch-22 scenario in which the U.S. must either return to rampant inflation, or, face a debt crisis. In either case, U.S. dollar-denominated assets will lose their appeal and their prices will plummet.
“Healthy” GDP is a complete farce
GDP is the most common out-of-context stat used by governments to convince the citizenry that all is well. It is yet another stat that is entirely manipulated by inflation. It is also manipulated by the way in which modern governments define “economic activity.”
GDP is primarily driven by spending. Meaning, the higher inflation goes, the higher prices go, and the higher GDP climbs (to a point). Eventually prices go too high, credit cards tap out and spending ceases. But, for a short time inflation makes GDP (as well as retail sales) look good.
Another factor that creates a bubble is the fact that government spending is actually included in the calculation of GDP. That’s right, every dollar of your tax money that the government wastes helps the establishment by propping up GDP numbers. This is why government spending increases will never stop – It’s too valuable for them to spend as a way to make the economy appear healthier than it is.
The REAL economy is eclipsing the fake economy
The bottom line is that Americans used to be able to ignore the warning signs because their bank accounts were not being directly affected. This is over. Now, every person in the country is dealing with a massive decline in buying power and higher prices across the board on everything – from food and fuel to housing and financial assets alike. Even the wealthy are seeing a compression to their profit and many are struggling to keep their businesses in the black.
The unfortunate truth is that the elections of 2024 will probably be the turning point at which the whole edifice comes tumbling down. Even if the public votes for change, the system is already broken and cannot be repaired without a complete overhaul.
We have consistently avoided taking our medicine and our disease has gotten worse and worse.
People have lost faith in the economy because they have not faced this kind of uncertainty since the 1930s. Even the stagflation crisis of the 1970s will likely pale in comparison to what is about to happen. On the bright side, at least a large number of Americans are aware of the threat, as opposed to the 1920s when the vast majority of people were utterly conned by the government, the banks and the media into thinking all was well. Knowing is the first step to preparing.
The second step is securing your own financial future – that’s where physical precious metals can play a role. Diversifying your savings with inflation-resistant, uninflatable assets whose intrinsic value doesn’t rely on a counterparty’s promise to pay adds resilience to your savings. That’s the main reason physical gold and silver have been the safe haven store-of-value assets of choice for centuries (among both the elite and the everyday citizen).
* * *
As the world moves away from dollars and toward Central Bank Digital Currencies (CBDCs), is your 401(k) or IRA really safe? A smart and conservative move is to diversify into a physical gold IRA. That way your savings will be in something solid and enduring. Get your FREE info kit on Gold IRAs from Birch Gold Group. No strings attached, just peace of mind. Click here to secure your future today.


Wendy’s has a new deal for daylight savings time haters


Watch Live: President Biden Reminds Americans Just How Good They’ve Got It Thanks To Him


Watch: President Biden Delivers The “Darkest, Most Un-American Speech Given By A President”


These Are The 5 Charts The FDIC Does Not Want You Paying Attention To


Interest rates, the best it gets. It’s time to deploy cash


Is the biotech market rally real? Data suggest comeback in private, public markets


People Who Received Ivermectin Were Better Off, Study Finds


Stock Market’s Top Will Outlast Your Disbelief


COVID-19 May Lead To Persistent Cognitive Impairment, Brain Fog, And Lower IQ Scores


Europe Is Alarmed Enough To Begin Wargaming A Food Crisis
-

 Uncategorized2 weeks ago
All Of The Elements Are In Place For An Economic Crisis Of Staggering Proportions
-

 Uncategorized1 month ago
Cathie Wood sells a major tech stock (again)
-

 Uncategorized3 weeks ago
California Counties Could Be Forced To Pay $300 Million To Cover COVID-Era Program
-

 Uncategorized2 weeks ago
Apparel Retailer Express Moving Toward Bankruptcy
-

 Uncategorized3 weeks ago
Industrial Production Decreased 0.1% in January
-

 International10 hours ago
Walmart launches clever answer to Target’s new membership program
-

 Uncategorized3 weeks ago
RFK Jr: The Wuhan Cover-Up & The Rise Of The Biowarfare-Industrial Complex
-

 Uncategorized3 weeks ago
GOP Efforts To Shore Up Election Security In Swing States Face Challenges