The frequency of calls that the market is in a euphoric bubble is increasing.It’s worth exploring some of the evidence used to reach that conclusion before deciding whether now is the time to adopt a more cautious stance and to ready oneself for the benefits lower prices deliver.
Notwithstanding the need for more data and analysis to support these claims, we’ll begin by dealing a swift blow to the weakest argument that the market is due for a correction – that it’s risen a lot.
Yes, it is true that stocks in even higher-quality companies like Goodman Group (ASX:GMG), for example, have risen over 60 per cent in the last twelve months. Another high-quality company’s shares, Megaport (ASX:MP1) – a stock owned by the Montgomery Small Companies Fund – have risen by more than 250 per cent in the last year. Even the S&P/ASX200 is up 977 points or 14.4 per cent from its October lows.
Does that mean stocks are now going to fall? Perish the thought! A rising market is insufficiently compelling evidence the market is now due for a correction.
I find this argument difficult to accept as a reason to expect a pullback because it only recognises a rise in price and fails to acknowledge the level from whence that rise came. Were the shares undervalued before they took off, or were they already overpriced to begin with? The same argument also fails to answer whether the shares have now become overpriced on either a relative or absolute basis. Some insights into past or current valuations need to be provided. And remember, even then, prices can remain reflective of exuberance for a long time.
Let’s look at some of the more nuanced arguments.
The first is arguably related to increasing popularity.
The bullish sentiment in the financial markets is undeniably robust. According to the latest data from U.S.-based research firm ETFGI, total assets under management (AUM) for exchange-traded funds (ETFs) globally soared last month to the unprecedented level of U.S.$12.25 trillion. Notably, February marked the 57th consecutive month of net inflows into global ETFs, totalling U.S.$116.3 billion.
Focusing on the asset classes, equity ETFs are the predominant beneficiaries. In February alone, equity ETFs captured net inflows of U.S.$80.4 billion, pushing the year-to-date figure to U.S.$141.4 billion – a nearly sevenfold increase from the corresponding period in the previous year.
Zooming in on the subsectors reaping the benefits of these inflows, the U.S. market, particularly the technology sector, stands out. A prime example is the Vanguard Information Technology ETF (NYSE:VGT), which witnessed a nearly 10 per cent increase in its funds under management to U.S.$70 billion.
Yes, stocks are popular again, or is it ETFs themselves?
According to Grant’s Interest Rate Observer, more than 12,000 ETF products exist worldwide, up 140 per cent from just five years ago. Over the past 15 months alone, as many as 3,000 ETF products have launched, nearly matching the 3,700 companies listed on U.S. exchanges. Is the tail now wagging the dog? That’s a question for another time.
Once again, it’s safe to say stocks are popular.
This is reflected in the expansion of the price-to-earnings (P/E) ratio, which is a proxy for popularity. The higher the P/E, the more popular investing in a stock or the index must be. According to Bloomberg, back in September 2022, at the depths of the last market selloff, the P/E ratio of the S&P/ASX200 was 12.44 times. Today, the P/E ratio is 17.04 times. That shift reflects an improvement in sentiment towards investing in equities that can be at least partly attributed to a more sanguine outlook for interest rates and inflation.
Lest you worry that interest rates aren’t falling fast enough, however, keep in mind the improvement in sentiment has occurred as bond rates have actually risen.
More importantly, while P/Es have risen, they are a far cry from the levels of popularity they reflected during historical periods of euphoria.
Figure 1. U.S. S&P600 Small Cap Index P/E ratio
As you can see from Figure 1., which reveals the one-year forward P/E ratio for the U.S. S&P600 small cap index since the turn of the century, the multiple of earnings investors are willing to pay for smaller companies has only been lower after the GFC, during the GFC, and after the tech wreck in the early 2000s. While PE ratios have recently risen, they are nowhere near the levels of euphoria that preceded crashes in the past.
As an aside, the small cap investment universe is one of the most exciting parts of the market in which to invest. You can gain exposure to sectors, industries and themes that simply aren’t available in large caps. Also worth keeping in mind is the small cap universe is always expanding and being refreshed. New companies emerge, there are initial public offerings (IPOs), and all the merger and spinoff activity ensures there’s always an opportunity around the corner for those willing to devote their time to the analysis.
The second and third arguments are like the first: Related to popularity.
According to EPFR Global, investors poured U.S.$56 billion into U.S. equities in the middle week of March. This was a new record, and 39 per cent, or U.S.$22 billion, went into technology stocks. The previous record was in March 2021.
A Bank of America survey of global fund managers reveals the most bullish sentiment since November 2021, proving that those flows reflect popularity.
For me, these arguments are little more than clumsy measures of popularity. They do little to help predict the answer to the more important question of when the market will turn down. To do that, we’d need to measure when sentiment is changing, and we can’t forecast that. All measures of sentiment are coincident at best. The market will already be falling by the time you read measures of popularity are falling.
For what it’s worth, the preponderance of IPOs is one sign that boom conditions are becoming bubble-like. Typically, bubbles are defined by euphoria, which manifests in various ways. One is the proliferation of initial public offerings, and another is the magnitude of first-day price increases for those IPOs.
Investment banks know they must “feed the ducks while they’re quacking”, so they provide a steady stream of selldowns and sellouts when markets are hot and potentially irrational. And when markets are hot and irrational, those that missed out fear further opportunity costs, pushing IPO share prices higher on their first day.
In 1999, when I was working at Merrill Lynch, there was a stunning 470 IPOs in the U.S. and a reported 70 per cent first-day capital gain across all IPOs. I recall there was something like a 90 per cent first-day gain for Nasdaq-listed IPOs.
More recently, there were more than 300 IPOs in 2021 as the market heated up post-pandemic. There was also a lot of liquidity as you will see in a moment. First-day gains averaged more than 30 per cent. We are nowhere near those numbers today. In 2023, there weren’t many more than 50 IPOs, and the first-day average gain was about 10 per cent. The ducks aren’t quacking. Yet.
But the IPO market is waking up to the rise in popularity of equities.
In the U.S. chat platform Reddit (NYSE:RDDT) IPO’d on March 21. Its IPO price of U.S.$34 valued the social media company at U.S.$6.5 billion, but after it listed, the stock climbed to close its first day at $50.44 – a gain of over 48 per cent. And keep in mind Reddit has never made a profit in its 20 years of existence.
A few more of these, and we may indeed be adding to the chorus of those screaming ‘bubble’! I don’t think we’re there yet. Yes, stocks are more popular than they were in the recent past, but they are far from being at the levels of popularity seen in previous bubbles. And even the insider selling by Bezos and Zuckerberg shouldn’t raise eyebrows unless you believe they are prophetic market timers.
Jeff Bezos did sell shares worth U.S.$8.5 billion in February, Meta CEO Mark Zuckerberg sold U.S.$135 million worth of shares in early February, and famed investor Peter Thiel offloaded U.S.$175 million of stock this month. Three big sales do not a winter make.
I think it’s prudent to watch liquidity. Liquidity is the main driver of asset prices. Liquidity precedes popularity. Stocks can only become more popular when people have more money (liquidity). And liquidity has been rising since the middle of last year.
Figure 2. CrossBorder Capital liquidity heatmap
Figure 2., and figure 3., shows how more liquidity in 2021 (green in figure 2.) coincided and preceded a rally in markets, while a tightening of liquidity (red) coincided or even preceded the sell-off in equities of 2022. Today’s neutral shade suggests an improvement from 2023, which was positive for equities.
Figure 3. CrossBorder’s global liquidity cycle chart
And keep in mind even though rate cuts might be delayed, there is general acceptance that rates have peaked.
There will be bumps along the way, and nothing in the above discussion suggests the market won’t decline, but most of the so-called ‘signs’ the market is euphoric and therefore primed for something catastrophic appear premature.
What If The Fed's Hikes Are Actually Sparking US Economic Boom?
Authored by Ye Xie via Bloomberg,
As the US economy hums along month after month, minting hundreds of thousands of new jobs and confounding experts who had warned of an imminent downturn, some on Wall Street are starting to entertain a fringe economic theory.
What if, they ask, all those interest-rate hikes the past two years are actually boosting the economy? In other words, maybe the economy isn’t booming despite higher rates but rather because of them.
It’s an idea so radical that in mainstream academic and financial circles, it borders on heresy — the sort of thing that in the past only Turkey’s populist president, Recep Tayyip Erdogan, or the most zealous disciples of Modern Monetary Theory would dare utter publicly.
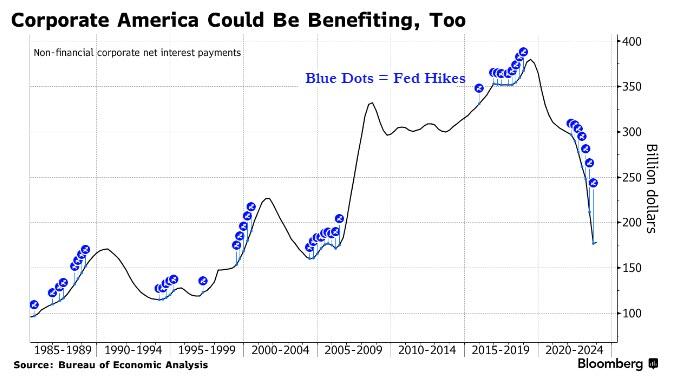
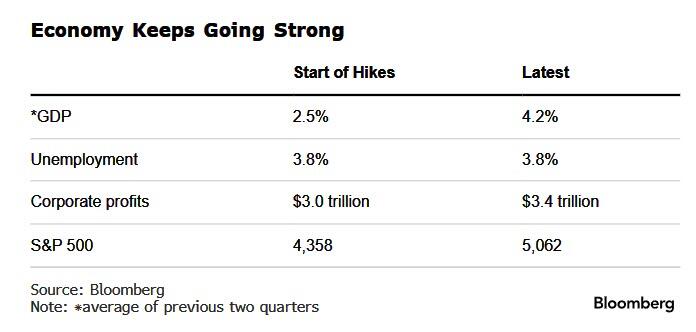
But the new converts — along with a handful who confess to being at least curious about the idea — say the economic evidence is becoming impossible to ignore. By some key gauges — GDP, unemployment, corporate profits — the expansion now is as strong or even stronger than it was when the Federal Reserve first began lifting rates.
This is, the contrarians argue, because the jump in benchmark rates from 0% to over 5% is providing Americans with a significant stream of income from their bond investments and savings accounts for the first time in two decades. “The reality is people have more money,” says Kevin Muir, a former derivatives trader at RBC Capital Markets who now writes an investing newsletter called The MacroTourist.
These people — and companies — are in turn spending a big enough chunk of that new-found cash, the theory goes, to drive up demand and goose growth.
In a typical rate-hiking cycle, the additional spending from this group isn’t nearly enough to match the drop in demand from those who stop borrowing money. That’s what causes the classic Fed-induced downturn (and corresponding decline in inflation). Everyone was expecting the economy to follow that pattern and “slow precipitously,” Muir says. “I’m like no, it’s probably more balanced and might even be slightly stimulative.”
Muir and the rest of the contrarians — Greenlight Capital’s David Einhorn is the most high profile of them — say it’s different this time for a few reasons. Principal among them is the impact of exploding US budget deficits. The government’s debt has ballooned to $35 trillion, double what it was just a decade ago. That means those higher interest rates it’s now paying on the debt translate into an additional $50 billion or so flowing into the pockets of American (and foreign) bond investors each month.
That this phenomenon made rising rates stimulative, not restrictive, became obvious to the economist Warren Mosler many years ago. But as one of the most vocal advocates of Modern Monetary Theory, or MMT, his interpretation was long dismissed as the preachings of an eccentric crusader. So there’s a little sense of vindication for Mosler as he watches some of the mainstream crowd come around now. “I’ve been certainly talking about this for a very long time,” he says.
Muir readily admits to being one of those who had snickered at Mosler years ago. “I was like, you’re insane. That makes no sense.” But when the economy took off after the pandemic, he decided to take a closer look at the numbers and, to his surprise, concluded Mosler was right.
‘Really Weird’
Einhorn, one of Wall Street’s best-known value investors, came to the theory earlier than Muir, when he observed how slowly the economy was expanding even though the Fed had pinned rates at 0% after the global financial crisis. While hiking rates to extremes clearly wouldn’t help the economy — the blow to borrowers from a, say, 8% benchmark rate is just too powerful — lifting them to more moderate levels would, he figured.
Einhorn notes that US households receive income on more than $13 trillion of short-term interest-bearing assets, almost triple the $5 trillion in consumer debt, excluding mortgages, that they have to pay interest on. At today’s rates, that translates to a net gain for households of some $400 billion a year, he estimates.
“When rates get below a certain amount, they actually slow down the economy,” Einhorn said on Bloomberg’s Masters in Business podcast in February. He calls the chatter that the Fed needs to start cutting rates to avoid a slowdown “really weird.”
“Things are pretty good,” he said. “I don’t think that they’re really going to help anybody” by cutting rates.
(Rate cuts do figure prominently, it should be noted, in a corollary to the rate-hikes-lift-growth theory that another camp on Wall Street is backing. It posits that rate cuts will actually push inflation further down, not up.)
To be clear, the vast bulk of economists and investors still firmly believe in the age-old principle that higher rates choke off growth.
As evidence of this, they point to rising delinquencies on credit cards and auto loans and to the fact that job growth, while still robust, has slowed.
Mark Zandi, chief economist at Moody’s Analytics, spoke for the traditionalists when he called the new theory simply “off base.” But even Zandi acknowledges that “higher rates are doing less economic damage than in times past.”
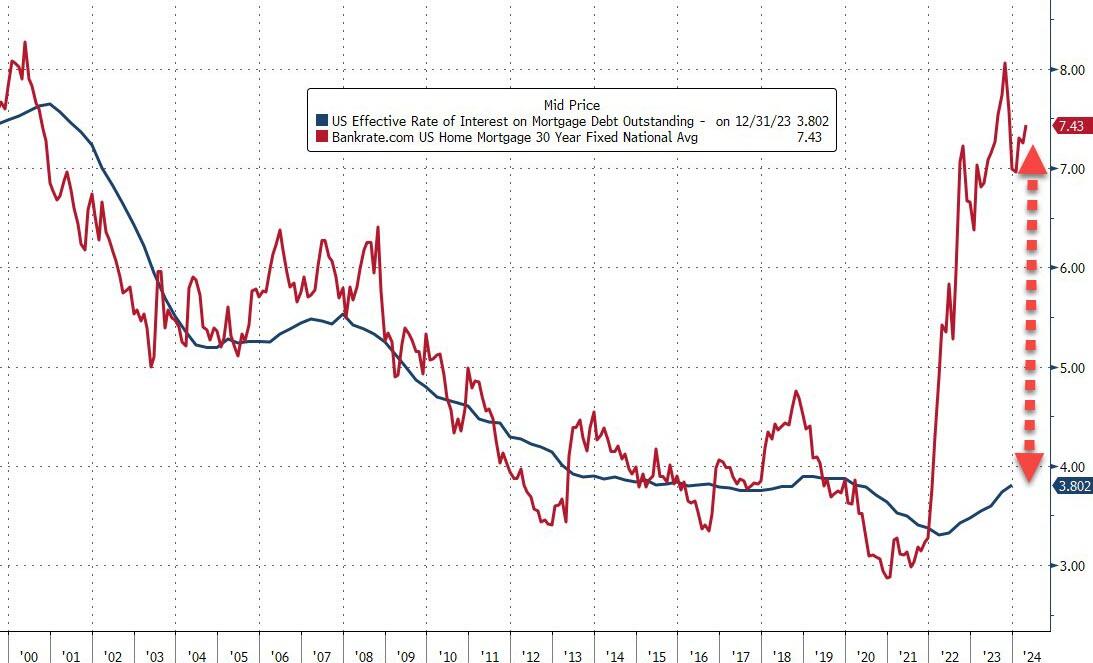
Like the converts, he cites another key factor for this resilience: Many Americans managed to lock in uber-low rates on their mortgages for 30 years during the pandemic, shielding them from much of the pain caused by rising rates.
(This is a crucial difference with the rest of the world; mortgage rates rapidly adjust higher as benchmark rates rise in many developed nations.)
Bill Eigen chuckles when he recalls how so many on Wall Street were predicting catastrophe as the Fed began to ratchet up rates. “They’ll never go past 1.5% or 2%,” he intones, sarcastically, “because that will collapse the economy.”
Eigen, a bond fund manager at JPMorgan Chase, isn’t an outright proponent of the new theory. He’s more in the camp of those who sympathize with the broad contours of the idea. That stance helped him see the need to refashion his portfolio, loading it up with cash — a move that’s put him in the top 10% of active bond fund managers over the past three years.
Eigen has two side hustles outside of JPMorgan. He runs a fitness center and car repair shop. At both places, people keep spending more money, he says. Retirees, in particular. They are, he notes, perhaps the biggest beneficiaries of the higher rates.
“All of a sudden, all of this disposable income accrues to these people,” he says. “And they’re spending it.”
When they say housing leads the U.S. economy into and out of a recession, they’re correct, as housing starts fall into a recession and rise when we are recovering. Economic cycles follow a familiar pattern, however, each one is unique in its way.
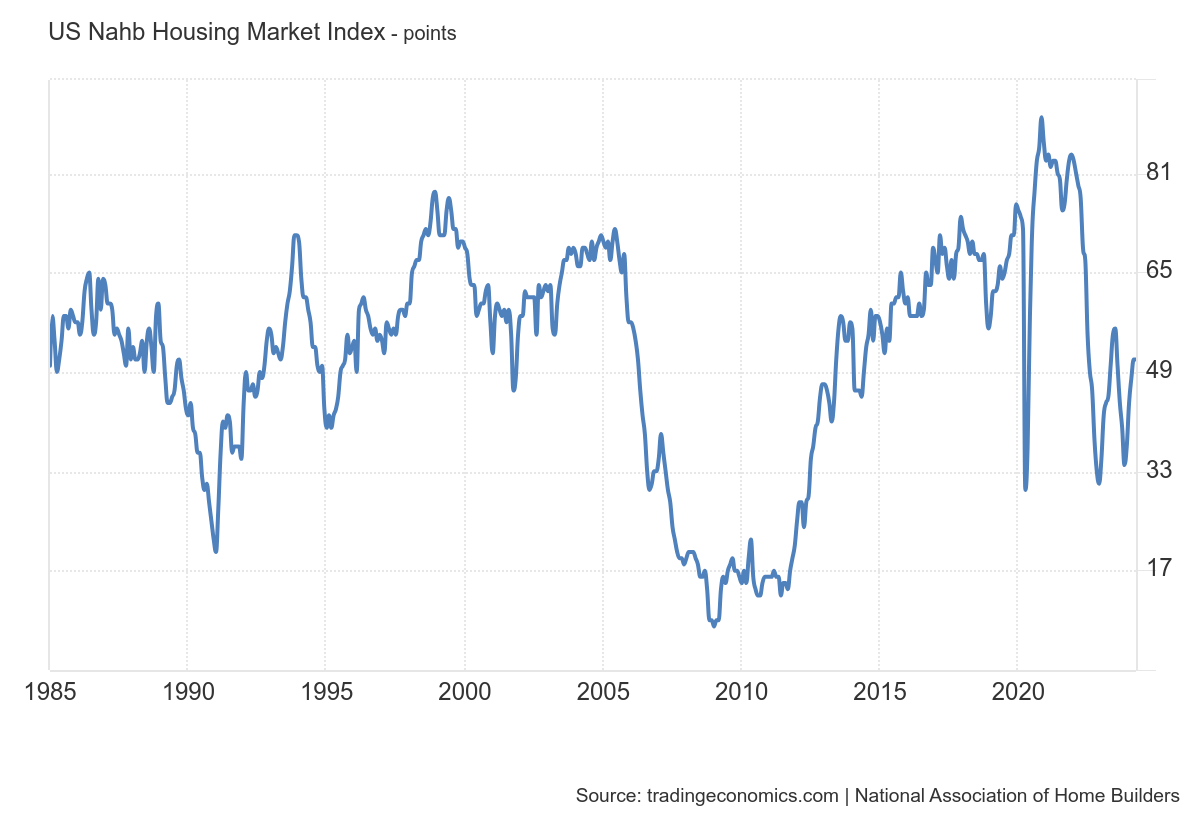
In 2022, many recessionary red flags popped up. However, after Nov. 9, 2022, a critical recessionary data line changed as mortgage rates fell, new home sales grew, builders bought down rates and the cycle moved on. You could see this in the builders’ confidence data.
Last year, as rates rose toward 8%, the builders’ confidence fell, and then, as rates fell, their confidence rose again. The most recent NAHB survey shows builders’ confidence has stalled, and it will most likely head lower soon! Why has this happened?
The 10-year yield broke a key support line last week, just like last year, and it wants to test 5% again. It’s currently at 4.65%. This means mortgage rates are higher than they’ve been all year, and, as I talked about last year on CNBC, higher mortgage rates are never good thing for housing.
I haven’t been a Fed pivot person since 2022 — I don’t think the Fed will pivot until the labor market breaks. I recently discussed how high mortgage rates can go in the HousingWire Daily podcast.
So, how should we approach the housing starts data to understand when a job loss recession will happen? Follow this journey with me.
As we can see below, recessions traditionally don’t start until residential construction jobs are lost. This isn’t just people who work in apartments and single-family homes, as remodeling employment is also high here. As we can see below, we haven’t shed residential construction jobs yet, and we haven’t gone into a job loss recession either. Also, remember we are an aging society, and baby boomers leave the workforce each month. Many companies are mindful of keeping the right amount of labor in their workforce.
Residential workers fall before the recession as higher rates bite.
Now, let’s look at housing permit data. As we can see in the chart below, 5-unit permit data is already at the low levels of the COVID-19 recession. As crazy as this sounds, we also have a shot at having this data line reach Great Financial Recession lows.
Since January 2023, as 5-unit permits have fallen, single-family permits have risen. But that’s not what we see in this report: single-family permits fell in this report. As we can see below, when both data lines fall together over time, it eventually leads to construction workers losing their jobs and jobless claims rising, which is how each recession has worked.
We are not in the danger zone yet, as we have a hefty backlog of construction work that needs to be finished. However, I am creating a pathway for you to walk to in the future.
*Notice how permits for single-family and five units tend to fall together before the recession.
Housing starts are growing yearly, and 5-unit starts are collapsing. In 2021, I wrote a critical piece stating that once mortgage rates rise and builders start to make less money building, they will fold like they always do. This is an excellent example of why I say builders aren’t the March of Dimes.
A huge gap between housing starts and 5-unit starts has been forming.
I wanted to keep this housing starts report straightforward today to get people to look ahead in the future and connect the dots, because the Fed will only pivot once the labor market breaks, when they see jobless claims rising. That, in turn, will lead to lower mortgage rates as the bond market sniffs out accurate recessionary data and takes yields and mortgage rates lower. Until then, mortgage rates and bond yields will be elevated.
“[…] as far as we know, we are the first to provide evidence of [stem cell depletion in aging] in a pan-tissue manner.”
Credit: 2024 Santos et al.
“[…] as far as we know, we are the first to provide evidence of [stem cell depletion in aging] in a pan-tissue manner.”
BUFFALO, NY- April 16, 2024 – A new research paper was published on the cover of Aging (listed by MEDLINE/PubMed as “Aging (Albany NY)” and “Aging-US” by Web of Science) Volume 16, Issue 7, entitled, “Evidence of a pan-tissue decline in stemness during human aging.”
Despite their biological importance, the role of stem cells in human aging remains to be elucidated. In a new study, researchers Gabriel Arantes dos Santos, Gustavo Daniel Vega Magdaleno and João Pedro de Magalhães from the Universidade de Sao Paulo, University of Birmingham and the University of Liverpool applied a machine learning method to detect stemness signatures from transcriptome data of healthy human tissues.
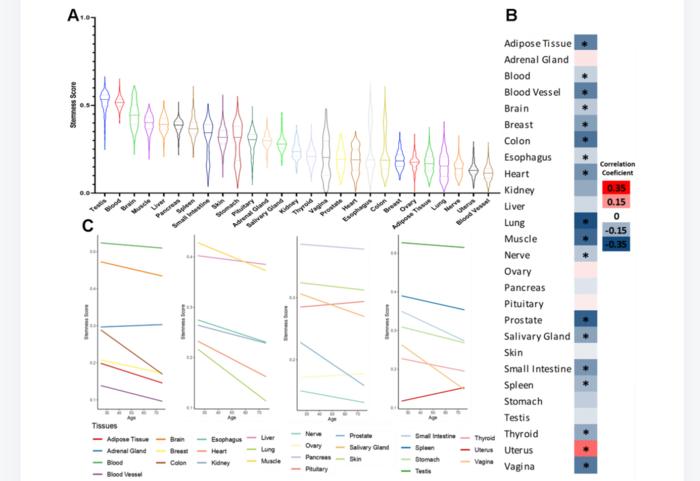
“In this work, we applied a machine learning methodology to GTEx transcriptome data and assigned stemness scores to 17,382 healthy samples from 30 human tissues aged between 20 and 79 years.”
The team found that ~60% of the studied tissues exhibit a significant negative correlation between the subject’s age and stemness score. The only significant exception was the uterus, where they observed an increased stemness with age. Moreover, the researchers observed that stemness is positively correlated with cell proliferation and negatively correlated with cellular senescence. Finally, they also observed a trend that hematopoietic stem cells derived from older individuals might have higher stemness scores.
“In conclusion, we assigned stemness scores to human samples and show evidence of a pan-tissue loss of stemness during human aging, which adds weight to the idea that stem cell deterioration may contribute to human aging.”
Read the full study: DOI:https://doi.org/10.18632/aging.205717
Corresponding Author: João Pedro de Magalhães – jp@senescence.info
Click hereto sign up for free Altmetric alerts about this article.
About Aging:
Agingpublishes research papers in all fields of aging research including but not limited, aging from yeast to mammals, cellular senescence, age-related diseases such as cancer and Alzheimer’s diseases and their prevention and treatment, anti-aging strategies and drug development and especially the role of signal transduction pathways such as mTOR in aging and potential approaches to modulate these signaling pathways to extend lifespan. The journal aims to promote treatment of age-related diseases by slowing down aging, validation of anti-aging drugs by treating age-related diseases, prevention of cancer by inhibiting aging. Cancer and COVID-19 are age-related diseases.
Agingis indexed byPubMed/Medline (abbreviated as “Aging (Albany NY)”), PubMed Central, Web of Science: Science Citation Index Expanded (abbreviated as “Aging‐US” and listed in the Cell Biology and Geriatrics & Gerontology categories), Scopus (abbreviated as “Aging” and listed in the Cell Biology and Aging categories), Biological Abstracts, BIOSIS Previews, EMBASE, META (Chan Zuckerberg Initiative) (2018-2022), and Dimensions (Digital Science).
Please visit our website at www.Aging-US.com and connect with us:
We use cookies on our website to give you the most relevant experience by remembering your preferences and repeat visits. By clicking “Accept”, you consent to the use of ALL the cookies.
This website uses cookies to improve your experience while you navigate through the website. Out of these, the cookies that are categorized as necessary are stored on your browser as they are essential for the working of basic functionalities of the website. We also use third-party cookies that help us analyze and understand how you use this website. These cookies will be stored in your browser only with your consent. You also have the option to opt-out of these cookies. But opting out of some of these cookies may affect your browsing experience.
Necessary cookies are absolutely essential for the website to function properly. These cookies ensure basic functionalities and security features of the website, anonymously.
Cookie
Duration
Description
cookielawinfo-checbox-analytics
11 months
This cookie is set by GDPR Cookie Consent plugin. The cookie is used to store the user consent for the cookies in the category "Analytics".
cookielawinfo-checbox-functional
11 months
The cookie is set by GDPR cookie consent to record the user consent for the cookies in the category "Functional".
cookielawinfo-checbox-others
11 months
This cookie is set by GDPR Cookie Consent plugin. The cookie is used to store the user consent for the cookies in the category "Other.
cookielawinfo-checkbox-necessary
11 months
This cookie is set by GDPR Cookie Consent plugin. The cookies is used to store the user consent for the cookies in the category "Necessary".
cookielawinfo-checkbox-performance
11 months
This cookie is set by GDPR Cookie Consent plugin. The cookie is used to store the user consent for the cookies in the category "Performance".
viewed_cookie_policy
11 months
The cookie is set by the GDPR Cookie Consent plugin and is used to store whether or not user has consented to the use of cookies. It does not store any personal data.
Functional cookies help to perform certain functionalities like sharing the content of the website on social media platforms, collect feedbacks, and other third-party features.
Performance cookies are used to understand and analyze the key performance indexes of the website which helps in delivering a better user experience for the visitors.
Analytical cookies are used to understand how visitors interact with the website. These cookies help provide information on metrics the number of visitors, bounce rate, traffic source, etc.
Advertisement cookies are used to provide visitors with relevant ads and marketing campaigns. These cookies track visitors across websites and collect information to provide customized ads.


