Spread & Containment
Here’s My Latest View of Current Market Action
Hello to all my StockCharts supporters! First of all, thank you for your readership of my Trading Places blog, which is now in its 8th year. Also, thanks…
Share this:

Hello to all my StockCharts supporters! First of all, thank you for your readership of my Trading Places blog, which is now in its 8th year. Also, thanks to all of you that watch my Trading Places LIVE shows that air on Tuesdays, Wednesdays, and Thursdays at 9:00am ET. I really appreciate your loyalty and support!
Today, we launched a new "EB Weekly Market Report" product that will be published every week on Sundays (occasionally Mondays) and will be made available as part of our regular service. There is no increased membership cost as a result of this new product. I am providing our first edition of this new weekly report below, so that you can get a sense of the in-depth analysis and research that we do at EarningsBeats.com. If you like the report, please take advantage of our 30-day FREE trial and try out all of our services for the next month, including the next four editions of this EB Weekly Market Report. September can be a cruel month, so get our latest thoughts as we navigate what historically has been a very difficult month.
************************************************************************************************************
Below is our first EB Weekly Market Report, which will be published on either Sunday or Monday of every week. It will replace our Monday EB Daily Market Report and provide all of our members with a broader "Big Picture" outlook on the U.S. stock market. Our market outlook will focus more on longer-term weekly charts, as opposed to the daily charts more often used in our EB Daily Market Report. We believe it enhances our current product lineup and appeals to everyone - those with a longer-term mindset and those focused primarily on the near-term.
Because of our "top-down" approach to trading, it makes a lot of sense to begin each week with a Big Picture focus, citing the current long-term technical outlook and how that might impact the market given our short-term signals that we discuss daily. This EB Weekly Market Report will also provide a consistent, once-per-week review at key sentiment and intermarket relationships that we value so highly at EarningsBeats.com and has helped us to guide our members through a very tumultuous 3-4 year period, beginning with the 2020 pandemic, right through the most recent 2022 cyclical bear market and subsequent secular bull market advance.
We'll also review the prior week's action and provide trade setups, but mostly with a longer-term mindset - think of longer-term swing trading, which should appeal to those of you that like the idea of longer-term momentum trading, providing wider stops and targets.
Let's get started with our very first edition of our EB Weekly Market Report, beginning with the action from last week.
Weekly Market Recap
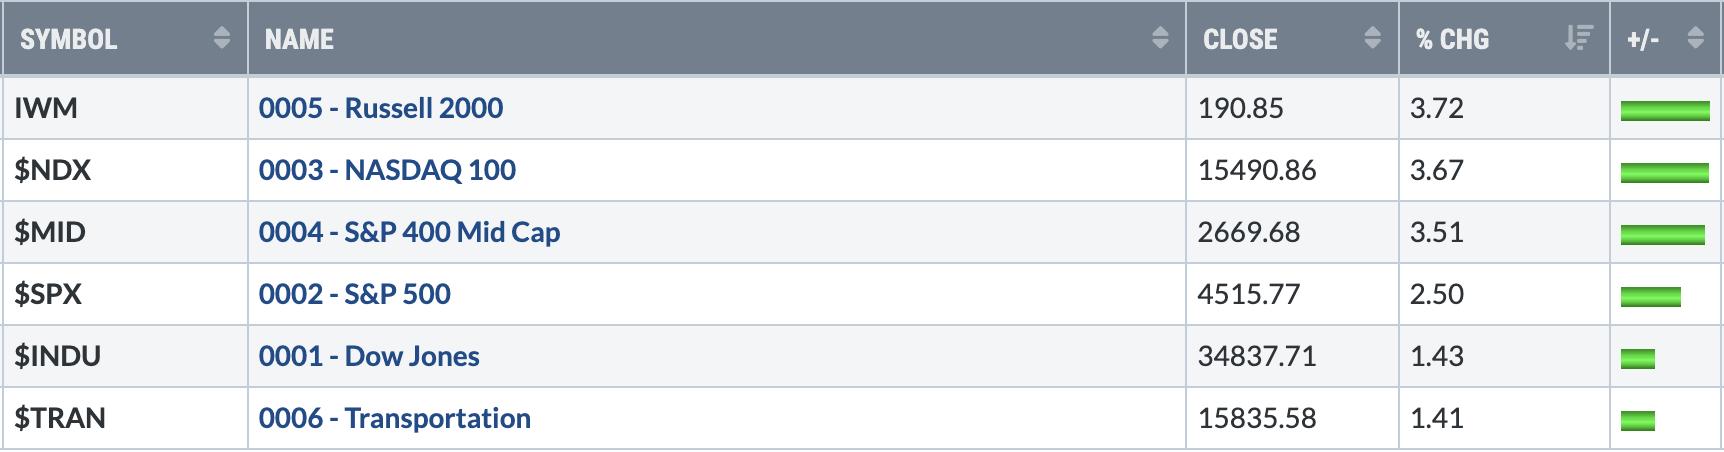
Major Indices
While we saw strength across most areas of the U.S. stock market last week, small and mid caps did show leadership. For this leadership to continue, it'll be important to see consistent strength from industrials, financials, health care, and energy as these are important sectors weighted heavier in the IWM than what we see in the benchmark S&P 500. For mid caps (MDY), industrials comprise 22.4% of the entire ETF, followed by consumer discretionary and financials.
Sectors

Clearly, there was some rotation last week away from growth and into value, though growth still performed fairly well, as evidenced by the leadership in technology. The best period of the year for growth vs. value is May through August, though the first 4 months of the year are relatively strong as well. However, we've seen historical bullishness from value stocks vs. growth stocks during the final 4 months of the year, starting with September. We've had a big run in technology and other growth areas, so repositioning now into more value and less growth makes sense for many.
Top 10 Industries Last Week

Both home construction and semiconductors have had HUGE runs in 2023 and have helped to lead U.S. stocks higher, but both will sport MAJOR negative divergences on their weekly charts should they reach new highs any time soon. Check these out:

You can see what's happened in the past when home construction stocks reach a weekly PPO of 7.5 (red-shaded area). It doesn't necessarily result in a massive selloff, but we should certainly lower our expectations bar, given how much this group has run. And if the DJUSHB breaks out again, it'll likely be accompanied by a massive negative divergence. Remember, it's not always about being right or wrong, it's about managing risk. I see a TON of risk in this chart and one of the weakest calendar months for this group since this secular bull market began in 2013 is September. Maybe we see a September swoon with a later rally in October and November. November is the group's best month, rising EVERY year in November since 2013 and averaging a 6.2% gain in that month alone.

I believe we're in a secular bull market and we're going higher. So it PAINS me to think any bearish thoughts about one of my favorite industry groups. But history doesn't lie. The charts don't lie. Semiconductors have been a clear leader - not only during this advance in 2023, but also throughout the entire secular bull market run. I could argue, however, that this group has not been this overbought since the secular bull market began. I've highlighted 5 times (including right now) the DJUSSC has seen its weekly RSI move to the mid-70s or higher with black-dotted vertical lines. I've also highlighted that the current weekly PPO had never reached 10 - until the 2023 surge. I LOVE this group, but it needs a period of consolidation BADLY. While I won't say it can't go higher in the short-term from here, I absolutely would not be surprised at all to see it fall into a period of consolidation, similar to what we've seen in the past when it becomes so overbought.
Bottom 10 Industries Last Week

One signal that can scare me is when I see defensive areas of the stock market lead during an advance. Needless to say, I feel very comfortable with last week's rally as the Bottom 10 industries is LITTERED with defensive groups. When I look at these groups on a longer-term weekly chart, I believe health care providers ($DJUSHP) is one group that could be poised to reverse. Recreational services ($DJUSRQ) is another. Take a look:

Health care providers have been in a solid channel throughout this secular bull market, interrupted only by the 2020 pandemic scare. Otherwise, the channel is almost perfect. Notice where we are right now, testing the lower channel line. These tend to be the absolute best long-term entry points. Also, the green-dotted vertical lines mark the PPO trips and bottoms deep into negative territory. I typically like momentum trades, including areas that are rising. But I'd have to say, from a longer-term perspective, buying stocks in areas testing critical support would likely be a better trading opportunity for many of you, especially those of you that don't like to chase, but would rather buy at or near bottoms. One final thought. Seasonally, the best two-consecutive-month period for health care providers is easily October-November, which is right around the corner.

Ordinarily, I'd be concerned about a group where its weekly PPO just touched 10. However, we have seen a pullback to the rising 20-week EMA that's helped to relieve those overbought conditions. Also, let's keep in mind this group was tortured during the 2020 pandemic. Even after the huge recent advance, the group is still down more than 40% from its pre-pandemic high. I'm looking for a rebound off this rising 20-week EMA test. If I break down this group's historical performance by quarter since 2013, here's what it looks like:
- Jan-Mar: -1.2%
- Apr-Jun: +1.0%
- Jul-Sep: +2.3%
- Oct-Dec: +7.7%
We're moving into the sweet spot of the year for recreational services.
Top 10 Stocks - S&P 500/NASDAQ 100

Bottom 10 Stocks - S&P 500/NASDAQ 100

Big Picture - September 2023
It all starts here. When I talk about "perspective" with respect to the U.S. stock market, this chart is the poster child. The first thing we must all understand when we approach stock trading is whether we're in a SECULAR bull market or SECULAR bear market. During each, we often see countertrend CYCLICAL bear markets and CYCLICAL bull markets, respectively. But, if you want to achieve a higher success rate trading stocks, it's imperative that you get this first step right. With long-term perspective, you can see short-term volatility and countertrend moves much more clearly and BEFORE they happen. Without that long-term perspective, your short-term view can get very cloudy and, unfortunately, very emotional. Emotional trading leads to BIG losses. We need to trade and invest with CLARITY and CONFIDENCE to understand the next LIKELY move in U.S. stocks.
Here's what I'm seeing when I pull up my 100-year chart on the S&P 500:

September Update:
We can talk about different signals on this chart, but for today, let's focus on those two bottom panels - the long-term 120-month rate of change (ROC) and the 240-month ROC. These represent 10-year and 20-year "look back" periods to see how far the S&P 500 has run over those two time frames. In the 120-month ROC, the 1950s-1960s SECULAR bull market saw an ROC high of just over 300%. The 1980s-1990s SECULAR bull market reached above 350%. The current 2010s-2020s SECULAR bull market nearly touched 300%, but remains slightly beneath the prior two SECULAR bull markets in terms of a 10-year ROC. So for those that have screamed this bull market has run too much, I'd direct you to this chart, which clearly reflects this has been a more subdued secular bull market (at least during the first 10 years) than the previous two.
You need to remember one thing about historical SECULAR bull markets. They tend to last 20 years, not 10. And the bottom panel shows us the 20-year ROC. In the 50s and 60s, we topped close to 750%. In the 80s and 90s, that top was closer to 1400%. The current SECULAR bull market has another 10 years to run. Where might this 20-year ROC reach? That's the exciting part and one reason why I believe we'll see the S&P 500 perhaps 3x the level we're at right now. Yes, that's right. I'm calling for an S&P 500 that likely reaches 12000-15000 by the end of this decade or into the early part of the 2030s. We are in one of those secular bull market periods that you CANNOT rebound from if you don't take advantage of it when it occurs. I fully suspect history will repeat itself and that much of the 2030s and 2040s will be VERY difficult for U.S. equities - much like the 2000s, 1970s, and 1930s/1940s were.
One other piece of this chart to note is the monthly PPO. I've highlighted the secular bull market years in blue shading. Any time we see a correction or a cyclical bear market, we see the monthly PPO dip down close to or perhaps touch the zero line. When we begin to turn higher off of that centerline test, we historically have seen very significant stock market advances that have lasted YEARS, not weeks or months. IGNORE the media and all their BS headlines and stick to the technical signals on the charts.
Currently, it's ALL ABOARD the Northbound Train (with pitstops along the way, of course).
Major Indices
This week, let's look at the 10-year weekly chart on the S&P 500:

We are in a beautiful channel that began off the financial crisis low of 2009. That low, along with the 2020 pandemic low, were "fire sale" lows, triggered by extreme pessimism. They serve as very important lows in our current uptrend. I believe the ONLY way this line is tested is if we hit another period of EXTREME pessimism and panic. I really don't see anything on the horizon that would trigger such a selloff. A possible event might be a surge in inflation, with the Fed hitting the accelerator on rate hikes, maybe announcing 50-basis-point or 75-basis-point rate hikes, taking the fed funds rate well over 5-6%. While anything is possible, I certainly wouldn't invest my money based on this long shot. Inflation has been trending lower for months and there is absolutely no sign of this possibility on the charts. Wall Street has not and is not turning defensive right now. Therefore, I say stick with the long side as the weekly chart corroborates that Big Picture 100-year monthly chart.
When we become stretched in this current channel (red circles), testing the upper channel line, that's the time to be thinking caution again. Each of those prior red circles has triggered an ensuing period of consolidation/selling to take price back down to or near the middle, blue-dotted trendline. We have plenty of upside available before we'll need to worry about that.
Sentiment
Equity-only put-call ratio ($CPCE):
I use two primary CPCE signals, one short-term (speed boat) and the other long-term (ocean-liner). The stock market repeatedly moves higher and lower in both uptrending and downtrending markets. But once you've established the primary trend, which, in my opinion, is clearly higher, you can apply the 5-day equity only put call ratio ($CPCE) to help spot key short-term market tops and bottoms. Recently, the pendulum swung to extreme pessimism, which helped me call a bottom. Check it out:

Listen, I don't fight the signals. This is one of my PRIMARY charts to help me spot short-term market reversals. When I get warning signs of a short-term top and the increasing probability of a short-term period of selling/consolidation, the 5-day SMA of the CPCE is a key in helping to spot when the bleeding stops. It did so perfectly on August 18th, when I wrote my article at StockCharts, "Are You Ready For A Huge Rally?" I use proven methods, strategies, and charts to help me manage my downside risk and to spot key market reversals. This article was simply one example of that. Currently, this 5-day CPCE is neutral, returning from its recent extreme pessimism reading.
Now for the long-term, ocean-liner signal:

Think of this as the Big Picture of sentiment. History tells us that when the trend in sentiment changes, so too does the stock market direction. EVERY SINGLE TIME. When the stock market struggles for a long period of time, like it did during the 2022 CYCLICAL bear market, traders grow more and more pessimistic. The period starts off with retail traders not believing that we're going lower, so they continue to trade more on the long side, buying calls. It's not until after they lose a boatload of money that they begin to swing to the pessimistic side. By the time they do, most of the market damage has already been inflicted. At some point, the extreme pessimism marks a significant market bottom, but by then, retail traders have grown excessively bearish and can't fathom a move higher again until....you guessed it.....the market has already rebounded substantially.
Look at the chart above. Once the 253-day (1 year) moving average of the equity only put call ratio has risen to an extremely high reading, the sellers are DONE and the stock market rallies. And when retail traders grow too bullish after market advances, stocks tend to perform poorly, or at least flat. Again, I don't make this stuff up. Look at the chart and see it for yourself. The key on this ocean-liner chart is THE TURN - either the turn lower after a significant rise or the turn higher after a significant decline (or long-lasting consolidation period). In my opinion, this ocean-liner signal has reached a peak and is turning lower. I believe that will ultimately result in U.S. equity prices rising significantly over the foreseeable future.
Volatility Index ($VIX):
The VIX is interesting, because it has a very strong inverse relationship vs. the S&P 500. When stocks gain ground, the VIX drops. When stocks lose ground, the VIX rises. Here's a long-term chart to illustrate:

I think the inverse relationship is quite clear, especially when you see how many times we're in the -0.50 to -1.00 range vs. the +0.50 to +1.00 range. But we do see daily readings positive occasionally and when that positive correlation does appear, the signals are quite interesting. Here's what I mean:

Over the past two years, we've only received 3 signals (correlation moving into positive territory), but they've been excellent signals and I've written about them. The first one in November 2021 appeared after a significant short-term advance. Note how we saw a key reversal into the second half of November. The second signal appeared in the first week of January 2023. I wrote about it and spoke about it:

I'm posting these to provide examples of how we use our signals to PREDICT the market's next move, rather than simply tell you how it already moved. Market Guidance is about the future and no one calls it better than EarningsBeats.com. I believe we've proven that over a very tumultuous period that included a pandemic-related cyclical bear market, one of the strongest 2-year bull market advances in our history, a cyclical bear market prompted by rising inflation and a hawkish Fed, and yet another very strong bull market rally in 2023. Intermediate-term calls, both bullish and bearish, have helped guide traders and many times it's these sentiment signals that do the majority of the work.
Intermarket Relationships
Many times I refer to these intermarket relationships as sustainability ratios. They provide us clues as to the likelihood that a current market trend will continue. If the S&P 500 is rising, I feel much more confident about it continuing if our sustainability ratios are rising as well. I believe some of these ratios are more important than others, so I'll provide the two that are most important to me:
Consumer discretionary vs. Consumer staples (XLY:XLP):
Our GDP is comprised of two-thirds consumer spending. If we truly want to see into the future, we need to be aware of how the consumer is doing, specifically by evaluating the relationship of discretionary stocks (these companies provide us the things we WANT) vs. staples stocks (these companies provide us the things we NEED). The S&P 500 thrives in a "risk-on" market environment that includes consumers spending money on the things they WANT. The XLY:XLP ratio provides us the current market "temperature" on how the big Wall Street firms view this relationship. As long as we keep seeing higher highs and higher lows on this XLY:XLP ratio, I'm going to be bullish. You must keep in mind that, during consolidation/selling periods, money will rotate from the XLY to the XLP. That's normal market behavior. So I don't grow bearish every time this ratio declines. It's more of a Big Picture review of the ratio vs. the S&P 500. Check this out:

The above XLY:XLP chart includes a proprietary User-Defined Index that tracks this ratio on an INTRADAY basis that excludes opening gaps. I do this to see how this relationship is performing during the trading day to rid myself of all the market maker noise that surrounds opening gaps. You can see from the above chart that the XLY:XLP intraday ratio was performing much better in Q4 2022 and Q1 2023, providing us a much more bullish signal, while the market-maker-manipulated gaps showed us a more bearish picture (steady declines, falling red directional lines). The blue directional lines in the top panel of the chart SCREAMED at us that money was rotating very aggressively during the trading day. In other words, the big Wall Street crowd was buying and that's always a bullish signal.
NASDAQ 100 vs. S&P 500 (QQQ:SPY)
History tells us that the NASDAQ 100 outperforms the S&P 500 during secular bull market advances. The reason is simple. Growth stocks outperform value stocks when our economy is strong, strengthening, or expected to strengthen. The NASDAQ has more representation of growth stocks, so we should view a rising QQQ:SPY quite bullishly. Here's how this chart looks now, also providing the INTRADAY QQQ:SPY relationship to exclude those manipulative gaps:

Before I analyze this chart, let me address one question that ALWAYS seems to surface. The NAME of this User-Defined Index chart is "@SPYQQQ". That does not dictate the order in which this ratio is calculated. I can PROMISE you that it's based on the intraday QQQ:SPY ratio. I just want to be clear about that, because many have suggested I did the calculation backwards. Remember, it's just a name. In hindsight, I wish I had picked the name "@QQQSPY", but I didn't.
The red directional line in the top panel suggests that Wall Street has begun to rotate away from growth and that should not be ignored. Historically, we begin to see much better action in value-oriented stocks vs. growth-oriented, so it's important to note this subtle signal. The QQQ:SPY ratio seems to be holding up in that 2nd panel, but it's primarily because of the opening gaps. The QQQ has been gapping higher, but it's been followed by intraday selling and rotation towards the SPY. That isn't necessarily bearish. It's simply a signal that we could see leadership rotate to areas like industrials, financials, health care, and energy. And that's how the market generally trades in the final months of the year.
Trade Setups
As I mentioned above, we're beginning to see the historical leaves change as September arrives. I am focused on uncovering value-oriented industrials and financials to lead us into year end as the torch is passed from technology. That's why the stocks below are not AAPL, MSFT, NVDA, META, AMZN, GOOGL, etc. I expect those stocks to pause in Q4 as they normally do. In the meantime, here are 2 that I believe could be solid trades into year end:
JP MorganChase (JPM):

I could see JPM dipping into the low 140s, possibly into the upper 130s, but I really like the recent selling (5 weeks running) that's left JPM at its rising 20-week EMA just prior to a very bullish seasonal pattern. Over the past 11 years, JPM has average returns as follows by quarter:
- Jan-Mar: -1.9%
- Apr-Jun: +4.1%
- Jul-Sep: +2.7%
- Oct-Dec: +12.9%
JPM loves Q4. If history repeats itself, don't be surprised to see JPM hitting all-time highs by the end of the year.
Boeing (BA):

Not many stocks were rocked as hard as BA during the pandemic and in the years following. It now seems to be on a much better trajectory, however. I like the fact that BA spent much of 2023 in a tight range between 195 and 220, not really participating in the market's advance. On extremely heavy volume in July, accompanying its quarterly results, BA broke out of this range and is now trading almost squarely on that prior resistance near 220. Like JPM, it has a historically-strong period that's about to begin. Here's how BA's average quarterly returns unfold:
- Jan-Mar: +2.4%
- Apr-Jun: +1.6%
- Jul-Sep: +6.5%
- Oct-Dec: +11.4%
I'd say BA is in its sweet spot historically and the technical conditions support an advance from here as well.
JPM and BA are both in that value camp and represent financials and industrials, respectively. I believe both will outperform the S&P 500 from now through year end.
Looking Ahead
Upcoming Earnings
There isn't likely to be a lot of market movement based upon key earnings reports. Most large companies that could influence the benchmark S&P 500 and/or the NASDAQ 100 have long since reported results. Here are a few interesting companies reporting this week, however, by day and market cap:
Tuesday: ZS ($22 billion)
Wednesday: None
Thursday: DOCU ($10 billion)
Friday: KR ($33 billion)
Key Economic Reports
The beige book is likely to grab attention and headlines on Wednesday afternoon at 2pm ET, but otherwise it'll be a fairly slow week for economic reports. Key economic news will be out next week, including both the monthly CPI and PPI reports. Those will come one week before the Fed decides whether or not to raise interest rates.
This week's reports:
Tuesday: Factory orders
Wednesday: PMI composite, ISM services, beige book
Thursday: Initial jobless claims, productivity and costs
Friday: Wholesale inventories
Historical Data
Each week, I'll provide you the average annualized returns for each calendar day and by index. Here's the balance of this week:

The S&P 500 data dates back to 1950, while the NASDAQ and Russell 2000 information date back to 1971 and 1987, respectively.
Historically, I'd say next week favors small caps, but let me say that seasonal information ALWAYS takes a back seat to technical analysis and current market conditions.
Final Thoughts
Whew! This is obviously a very lengthy report. There are many charts that I won't address on a weekly basis as they simply don't change that often. I'll likely discuss the Big Picture 100-year chart at the beginning of every month. Otherwise, there'll be plenty of week-to-week redundancy. The "ocean-liner" CPCE is another chart that can be reviewed monthly. And I may add a section here or there in various weekly market reports. But what you see above is the majority of what you can expect in the future on Sundays/Mondays. Remember, this in-depth analysis will REPLACE the Monday Daily Market Report. Those DMRs will be published Tuesdays through Fridays.
As I look at the stock market right now, I have several thoughts:
- We're in a SECULAR bull market, so you won't hear or see me talking bearishly about the stock market long-term unless conditions change immensely
- It's September! The second half of September is the truly bearish part of the month. Until then, we typically see average annualized market returns comparable to the S&P 500 throughout the entire year
- While not addressed in this long-term weekly report, there are 60-minute negative divergences that could impact this week's trading - to the downside. From a long-term perspective, however, this VERY short-term momentum warning is much like a gnat on an elephant's butt. It really doesn't matter.
- One very important key that I'll be watching throughout September is the possible rotation into more value-oriented stocks. Just like in 2022, don't view this as bearish rotation. The growth stocks deserve a pause and areas like semiconductors will produce long-term negative divergences on the weekly chart if we see further strength.
- Earnings and economic news will be very light, so we'll likely see market action follow the technicals, with little in the way of fundamental news to digest.
- Please always try to keep perspective in mind when you evaluate the U.S. stock market. Honestly, I believe most every analyst needs a big dose of perspective from time to time. And retail traders? Puh-lease, most cannot look past what's happened in the past week or month, let alone stepping back and viewing the Big Picture chart from space. There are so many emotional traders, responding to the latest CNBC headline. Don't be in that group or market makers will get the best of you.
Feedback
I hope you enjoyed this very first edition of our EB Weekly Market Report! We'd absolutely love your feedback, whether positive or negative. Let us know what you think by sending us your comments to "support@earningsbeats.com".
30-Day FREE Trial
Let me reiterate that we have a 30-day FREE trial to our ENTIRE service that now includes this EB Weekly Market Report. I believe I can help you steer clear of big trouble in the stock market - like I did for EB.com members at the beginning of the 2022 cyclical bear market - while enjoying the benefits of these scintillating secular bull market advances. Simply CLICK HERE to get your trial subscription started!
Thanks and happy trading!
Tom
sp 500 nasdaq equities stocks fed etf russell 2000 pandemic testing gdp interest rates consumer spending small capsSpread & Containment
Revving up tourism: Formula One and other big events look set to drive growth in the hospitality industry
With big events drawing a growing share of of tourism dollars, F1 offers a potential glimpse of the travel industry’s future.
Share this:


In late 2023, I embarked on my first Formula One race experience, attending the first-ever Las Vegas Grand Prix. I had never been to an F1 race; my interest was sparked during the pandemic, largely through the Netflix series “Formula 1: Drive to Survive.”
But I wasn’t just attending as a fan. As the inaugural chair of the University of Florida’s department of tourism, hospitality and event management, I saw this as an opportunity. Big events and festivals represent a growing share of the tourism market – as an educator, I want to prepare future leaders to manage them.
And what better place to learn how to do that than in the stands of the Las Vegas Grand Prix?

The future of tourism is in events and experiences
Tourism is fun, but it’s also big business: In the U.S. alone, it’s a US$2.6 trillion industry employing 15 million people. And with travelers increasingly planning their trips around events rather than places, both industry leaders and academics are paying attention.
Event tourism is also key to many cities’ economic development strategies – think Chicago and its annual Lollapalooza music festival, which has been hosted in Grant Park since 2005. In 2023, Lollapalooza generated an estimated $422 million for the local economy and drew record-breaking crowds to the city’s hotels.
That’s why when Formula One announced it would be making a 10-year commitment to host races in Las Vegas, the region’s tourism agency was eager to spread the news. The 2023 grand prix eventually generated $100 million in tax revenue, the head of that agency later announced.
Why Formula One?
Formula One offers a prime example of the economic importance of event tourism. In 2022, Formula One generated about $2.6 billion in total revenues, according to the latest full-year data from its parent company. That’s up 20% from 2021 and 27% from 2019, the last pre-COVID year. A record 5.7 million fans attended Formula One races in 2022, up 36% from 2019.
This surge in interest can be attributed to expanded broadcasting rights, sponsorship deals and a growing global fan base. And, of course, the in-person events make a lot of money – the cheapest tickets to the Las Vegas Grand Prix were $500.

That’s why I think of Formula One as more than just a pastime: It’s emblematic of a major shift in the tourism industry that offers substantial job opportunities. And it takes more than drivers and pit crews to make Formula One run – it takes a diverse range of professionals in fields such as event management, marketing, engineering and beyond.
This rapid industry growth indicates an opportune moment for universities to adapt their hospitality and business curricula and prepare students for careers in this profitable field.
How hospitality and business programs should prepare students
To align with the evolving landscape of mega-events like Formula One races, hospitality schools should, I believe, integrate specialized training in event management, luxury hospitality and international business. Courses focusing on large-scale event planning, VIP client management and cross-cultural communication are essential.
Another area for curriculum enhancement is sustainability and innovation in hospitality. Formula One, like many other companies, has increased its emphasis on environmental responsibility in recent years. While some critics have been skeptical of this push, I think it makes sense. After all, the event tourism industry both contributes to climate change and is threatened by it. So, programs may consider incorporating courses in sustainable event management, eco-friendly hospitality practices and innovations in sustainable event and tourism.
Additionally, business programs may consider emphasizing strategic marketing, brand management and digital media strategies for F1 and for the larger event-tourism space. As both continue to evolve, understanding how to leverage digital platforms, engage global audiences and create compelling brand narratives becomes increasingly important.
Beyond hospitality and business, other disciplines such as material sciences, engineering and data analytics can also integrate F1 into their curricula. Given the younger generation’s growing interest in motor sports, embedding F1 case studies and projects in these programs can enhance student engagement and provide practical applications of theoretical concepts.
Racing into the future: Formula One today and tomorrow
F1 has boosted its outreach to younger audiences in recent years and has also acted to strengthen its presence in the U.S., a market with major potential for the sport. The 2023 Las Vegas race was a strategic move in this direction. These decisions, along with the continued growth of the sport’s fan base and sponsorship deals, underscore F1’s economic significance and future potential.
Looking ahead in 2024, Formula One seems ripe for further expansion. New races, continued advancements in broadcasting technology and evolving sponsorship models are expected to drive revenue growth. And Season 6 of “Drive to Survive” will be released on Feb. 23, 2024. We already know that was effective marketing – after all, it inspired me to check out the Las Vegas Grand Prix.
I’m more sure than ever that big events like this will play a major role in the future of tourism – a message I’ll be imparting to my students. And in my free time, I’m planning to enhance my quality of life in 2024 by synchronizing my vacations with the F1 calendar. After all, nothing says “relaxing getaway” quite like the roar of engines and excitement of the racetrack.
Rachel J.C. Fu does not work for, consult, own shares in or receive funding from any company or organization that would benefit from this article, and has disclosed no relevant affiliations beyond their academic appointment.
spread pandemicSpread & Containment
Students lose out as cities and states give billions in property tax breaks to businesses − draining school budgets and especially hurting the poorest students
An estimated 95% of US cities provide economic development tax incentives to woo corporate investors, taking billions away from schools.
Share this:


Built in 1910, James Elementary is a three-story brick school in Kansas City, Missouri’s historic Northeast neighborhood, with a bright blue front door framed by a sand-colored stone arch adorned with a gargoyle. As bustling students and teachers negotiate a maze of gray stairs with worn wooden handrails, Marjorie Mayes, the school’s principal, escorts a visitor across uneven blue tile floors on the ground floor to a classroom with exposed brick walls and pipes. Bubbling paint mars some walls, evidence of the water leaks spreading inside the aging building.
“It’s living history,” said Mayes during a mid-September tour of the building. “Not the kind of living history we want.”
The district would like to tackle the US$400 million in deferred maintenance needed to create a 21st century learning environment at its 35 schools – including James Elementary – but it can’t. It doesn’t have the money.
Property tax redirect
The lack of funds is a direct result of the property tax breaks that Kansas City lavishes on companies and developers that do business there. The program is supposed to bring in new jobs and business but instead has ended up draining civic coffers and starving schools. Between 2017 and 2023, the Kansas City school district lost $237.3 million through tax abatements.
Kansas City is hardly an anomaly. An estimated 95% of U.S. cities provide economic development tax incentives to woo corporate investors. The upshot is that billions have been diverted from large urban school districts and from a growing number of small suburban and rural districts. The impact is seen in districts as diverse as Chicago and Cleveland, Hillsboro, Oregon, and Storey County, Nevada.
The result? A 2021 review of 2,498 financial statements from school districts across 27 states revealed that, in 2019 alone, at least $2.4 billion was diverted to fund tax incentives. Yet that substantial figure still downplays the magnitude of the problem, because three-quarters of the 10,370 districts analyzed did not provide any information on tax abatement agreements.
Tax abatement programs have long been controversial, pitting states and communities against one another in beggar-thy-neighbor contests. Their economic value is also, at best, unclear: Studies show most companies would have made the same location decision without taxpayer subsidies. Meanwhile, schools make up the largest cost item in these communities, meaning they suffer most when companies are granted breaks in property taxes.
A three-month investigation by The Conversation and three scholars with expertise in economic development, tax laws and education policy shows that the cash drain from these programs is not equally shared by schools in the same communities. At the local level, tax abatements and exemptions often come at the cost of critical funding for school districts that disproportionately serve students from low-income households and who are racial minorities.
In Missouri, for example, in 2022 nearly $1,700 per student was redirected from Kansas City public and charter schools, while between $500 and $900 was redirected from wealthier, whiter Northland schools on the north side of the river in Kansas City and in the suburbs beyond. Other studies have found similar demographic trends elsewhere, including New York state, South Carolina and Columbus, Ohio.
The funding gaps produced by abated money often force schools to delay needed maintenance, increase class sizes, lay off teachers and support staff and even close outright. Schools also struggle to update or replace outdated technology, books and other educational resources. And, amid a nationwide teacher shortage, schools under financial pressures sometimes turn to inexperienced teachers who are not fully certified or rely too heavily on recruits from overseas who have been given special visa status.
Lost funding also prevents teachers and staff, who often feed, clothe and otherwise go above and beyond to help students in need, from earning a living wage. All told, tax abatements can end up harming a community’s value, with constant funding shortfalls creating a cycle of decline.
Incentives, payoffs and guarantees
Perversely, some of the largest beneficiaries of tax abatements are the politicians who publicly boast of handing out the breaks despite the harm to poorer communities. Incumbent governors have used the incentives as a means of taking credit for job creation, even when the jobs were coming anyway.
“We know that subsidies don’t work,” said Elizabeth Marcello, a doctoral lecturer at Hunter College who studies governmental planning and policy and the interactions between state and local governments. “But they are good political stories, and I think that’s why politicians love them so much.”
While some voters may celebrate abatements, parents can recognize the disparities between school districts that are created by the tax breaks. Fairleigh Jackson pointed out that her daughter’s East Baton Rouge third grade class lacks access to playground equipment.
The class is attending school in a temporary building while their elementary school undergoes a two-year renovation.
The temporary site has some grass and a cement slab where kids can play, but no playground equipment, Jackson said. And parents needed to set up an Amazon wish list to purchase basic equipment such as balls, jump ropes and chalk for students to use. The district told parents there would be no playground equipment due to a lack of funds, then promised to install equipment, Jackson said, but months later, there is none.

Jackson said it’s hard to complain when other schools in the district don’t even have needed security measures in place. “When I think about playground equipment, I think that’s a necessary piece of child development,” Jackson said. “Do we even advocate for something that should be a daily part of our kids’ experience when kids’ safety isn’t being funded?”
Meanwhile, the challenges facing administrators 500-odd miles away at Atlanta Public Schools are nothing if not formidable: The district is dealing with chronic absenteeism among half of its Black students, many students are experiencing homelessness, and it’s facing a teacher shortage.
At the same time, Atlanta is showering corporations with tax breaks. The city has two bodies that dole them out: the Development Authority of Fulton County, or DAFC, and Invest Atlanta, the city’s economic development agency. The deals handed out by the two agencies have drained $103.8 million from schools from fiscal 2017 to 2022, according to Atlanta school system financial statements.
What exactly Atlanta and other cities and states are accomplishing with tax abatement programs is hard to discern. Fewer than a quarter of companies that receive breaks in the U.S. needed an incentive to invest, according to a 2018 study by the Upjohn Institute for Employment Research, a nonprofit research organization.
This means that at least 75% of companies received tax abatements when they’re not needed – with communities paying a heavy price for economic development that sometimes provides little benefit.
In Kansas City, for example, there’s no guarantee that the businesses that do set up shop after receiving a tax abatement will remain there long term. That’s significant considering the historic border war between the Missouri and Kansas sides of Kansas City – a competition to be the most generous to the businesses, said Jason Roberts, president of the Kansas City Federation of Teachers and School-Related Personnel. Kansas City, Missouri, has a 1% income tax on people who work in the city, so it competes for as many workers as possible to secure that earnings tax, Roberts said.
Under city and state tax abatement programs, companies that used to be in Kansas City have since relocated. The AMC Theaters headquarters, for example, moved from the city’s downtown to Leawood, Kansas, about a decade ago, garnering some $40 million in Promoting Employment Across Kansas tax incentives.
Roberts said that when one side’s financial largesse runs out, companies often move across the state line – until both states decided in 2019 that enough was enough and declared a cease-fire.
But tax breaks for other businesses continue. “Our mission is to grow the economy of Kansas City, and application of tools such as tax exemptions are vital to achieving that mission, said Jon Stephens, president and CEO of Port KC, the Kansas City Port Authority. The incentives speed development, and providing them "has resulted in growth choosing KC versus other markets,” he added.
In Atlanta, those tax breaks are not going to projects in neighborhoods that need help attracting development. They have largely been handed out to projects that are in high demand areas of the city, said Julian Bene, who served on Invest Atlanta’s board from 2010 to 2018. In 2019, for instance, the Fulton County development authority approved a 10-year, $16 million tax abatement for a 410-foot-tall, 27,000-square-foot tower in Atlanta’s vibrant Midtown business district. The project included hotel space, retail space and office space that is now occupied by Google and Invesco.
In 2021, a developer in Atlanta pulled its request for an $8 million tax break to expand its new massive, mixed-use Ponce City Market development in the trendy Beltline neighborhood with an office tower and apartment building. Because of community pushback, the developer knew it likely did not have enough votes from the commission for approval, Bene said. After a second try for $5 million in lower taxes was also rejected, the developer went ahead and built the project anyway.
Invest Atlanta has also turned down projects in the past, Bene said. Oftentimes, after getting rejected, the developer goes back to the landowner and asks for a better price to buy the property to make their numbers work, because it was overvalued at the start.
Trouble in Philadelphia
On Thursday, Oct. 26, 2023, an environmental team was preparing Southwark School in Philadelphia for the winter cold. While checking an attic fan, members of the team saw loose dust on top of flooring that contained asbestos. The dust that certainly was blowing into the floors below could contain the cancer-causing agent. Within a day, Southwark was closed – the seventh Philadelphia school temporarily shuttered since the previous academic year because of possible asbestos contamination.
A 2019 inspection of the John L Kinsey school in Philadelphia found asbestos in plaster walls, floor tiles, radiator insulation and electrical panels. Asbestos is a major problem for Philadelphia’s public schools. The district needs $430 million to clean up the asbestos, lead, and other environmental hazards that place the health of students, teachers and staff at risk. And that is on top of an additional $2.4 billion to fix failing and damaged buildings.
Yet the money is not available. Matthew Stem, a former district official, testified in a 2023 lawsuit about financing of Pennsylvania schools that the environmental health risks cannot be addressed until an emergency like at Southwark because “existing funding sources are not sufficient to remediate those types of issues.”
Meanwhile, the city keeps doling out abatements, draining money that could have gone toward making Philadelphia schools safer. In the fiscal year ending June 2022, such tax breaks cost the school district $118 million – more than 25% of the total amount needed to remove the asbestos and other health dangers. These abatements take 31 years to break even, according to the city’s own scenario impact analyses.
Huge subsets of the community – primarily Black, Brown, poor or a combination – are being “drastically impacted” by the exemptions and funding shortfalls for the school district, said Kendra Brooks, a Philadelphia City Council member. Schools and students are affected by mold, asbestos and lead, and crumbling infrastructure, as well as teacher and staffing shortages – including support staff, social workers and psychologists.
More than half the district’s schools that lacked adequate air conditioning – 87 schools – had to go to half days during the first week of the 2023 school year because of extreme heat. Poor heating systems also leave the schools cold in the winter. And some schools are overcrowded, resulting in large class sizes, she said.

Teachers and researchers agree that a lack of adequate funding undermines educational opportunities and outcomes. That’s especially true for children living in poverty. A 2016 study found that a 10% increase in per-pupil spending each year for all 12 years of public schooling results in nearly one-third of a year of more education, 7.7% higher wages and a 3.2% reduction in annual incidence of adult poverty. The study estimated that a 21.7% increase could eliminate the high school graduation gap faced by children from low-income families.
More money for schools leads to more education resources for students and their teachers. The same researchers found that spending increases were associated with reductions in student-to-teacher ratios, increases in teacher salaries and longer school years. Other studies yielded similar results: School funding matters, especially for children already suffering the harms of poverty.
While tax abatements themselves are generally linked to rising property values, the benefits are not evenly distributed. In fact, any expansion of the tax base due to new property construction tends to be outside of the county granting the tax abatement. For families in school districts with the lost tax revenues, their neighbors’ good fortune likely comes as little solace. Meanwhile, a poorly funded education system is less likely to yield a skilled and competitive workforce, creating longer-term economic costs that make the region less attractive for businesses and residents.
“There’s a head-on collision here between private gain and the future quality of America’s workforce,” said Greg LeRoy, executive director at Good Jobs First, a Washington, D.C., advocacy group that’s critical of tax abatement and tracks the use of economic development subsidies.

As funding dwindles and educational quality declines, additional families with means often opt for alternative educational avenues such as private schooling, home-schooling or moving to a different school district, further weakening the public school system.
Throughout the U.S., parents with the power to do so demand special arrangements, such as selective schools or high-track enclaves that hire experienced, fully prepared teachers. If demands aren’t met, they leave the district’s public schools for private schools or for the suburbs. Some parents even organize to splinter their more advantaged, and generally whiter, neighborhoods away from the larger urban school districts.
Those parental demands – known among scholars as “opportunity hoarding” – may seem unreasonable from the outside, but scarcity breeds very real fears about educational harms inflicted on one’s own children. Regardless of who’s to blame, the children who bear the heaviest burden of the nation’s concentrated poverty and racialized poverty again lose out.
Rethinking in Philadelphia and Riverhead
Americans also ask public schools to accomplish Herculean tasks that go far beyond the education basics, as many parents discovered at the onset of the pandemic when schools closed and their support for families largely disappeared.
A school serving students who endure housing and food insecurity must dedicate resources toward children’s basic needs and trauma. But districts serving more low-income students spend less per student on average, and almost half the states have regressive funding structures.
Facing dwindling resources for schools, several cities have begun to rethink their tax exemption programs.
The Philadelphia City Council recently passed a scale-back on a 10-year property tax abatement by decreasing the percentage of the subsidy over that time. But even with that change, millions will be lost to tax exemptions that could instead be invested in cash-depleted schools. “We could make major changes in our schools’ infrastructure, curriculum, staffing, staffing ratios, support staff, social workers, school psychologists – take your pick,” Brooks said.
Other cities looking to reform tax abatement programs are taking a different approach. In Riverhead, New York, on Long Island, developers or project owners can be granted exemptions on their property tax and allowed instead to shell out a far smaller “payment in lieu of taxes,” or PILOT. When the abatement ends, most commonly after 10 years, the businesses then will pay full property taxes.
At least, that’s the idea, but the system is far from perfect. Beneficiaries of the PILOT program have failed to pay on time, leaving the school board struggling to fill a budget hole. Also, the payments are not equal to the amount they would receive for property taxes, with millions of dollars in potential revenue over a decade being cut to as little as a few hundred thousand. On the back end, if a business that’s subsidized with tax breaks fails after 10 years, the projected benefits never emerge.
And when the time came to start paying taxes, developers have returned to the city’s Industrial Development Agency with hat in hand, asking for more tax breaks. A local for-profit aquarium, for example, was granted a 10-year PILOT program break by Riverhead in 1999; it has received so many extensions that it is not scheduled to start paying full taxes until 2031 – 22 years after originally planned.
Kansas City border politics
Like many cities, Kansas City has a long history of segregation, white flight and racial redlining, said Kathleen Pointer, senior policy strategist for Kansas City Public Schools.

Troost Avenue, where the Kansas City Public Schools administrative office is located, serves as the city’s historic racial dividing line, with wealthier white families living in the west and more economically disadvantaged people of color in the east. Most of the district’s schools are located east of Troost, not west.
Students on the west side “pretty much automatically funnel into the college preparatory middle school and high schools,” said The Federation of Teachers’ Roberts. Those schools are considered signature schools that are selective and are better taken care of than the typical neighborhood schools, he added.
The school district’s tax levy was set by voters in 1969 at 3.75%. But successive attempts over the next few decades to increase the levy at the ballot box failed. During a decadeslong desegregation lawsuit that was eventually resolved through a settlement agreement in the 1990s, a court raised the district’s levy rate to 4.96% without voter approval. The levy has remained at the same 4.96% rate since.
Meanwhile, Kansas City is still distributing 20-year tax abatements to companies and developers for projects. The district calculated that about 92% of the money that was abated within the school district’s boundaries was for projects within the whiter west side of the city, Pointer said.
“Unfortunately, we can’t pick or choose where developers build,” said Meredith Hoenes, director of communications for Port KC. “We aren’t planning and zoning. Developers typically have plans in place when they knock on our door.”
In Kansas City, several agencies administer tax incentives, allowing developers to shop around to different bodies to receive one. Pointer said he believes the Port Authority is popular because they don’t do a third-party financial analysis to prove that the developers need the amount that they say they do.
With 20-year abatements, a child will start pre-K and graduate high school before seeing the benefits of a property being fully on the tax rolls, Pointer said. Developers, meanwhile, routinely threaten to build somewhere else if they don’t get the incentive, she said.
In 2020, BlueScope Construction, a company that had received tax incentives for nearly 20 years and was about to roll off its abatement, asked for another 13 years and threatened to move to another state if it didn’t get it. At the time, the U.S. was grappling with a racial reckoning following the murder of George Floyd, who was killed by a Minneapolis police officer.
“That was a moment for Kansas City Public Schools where we really drew a line in the sand and talked about incentives as an equity issue,” Pointer said.
After the district raised the issue – tying the incentives to systemic racism – the City Council rejected BlueScope’s bid and, three years later, it’s still in Kansas City, fully on the tax rolls, she said. BlueScope did not return multiple requests for comment.
Recently, a multifamily housing project was approved for a 20-year tax abatement by the Port Authority of Kansas City at Country Club Plaza, an outdoor shopping center in an affluent part of the city. The housing project included no affordable units. “This project was approved without any independent financial analysis proving that it needed that subsidy,” Pointer said.
All told, the Kansas City Public Schools district faces several shortfalls beyond the $400 million in deferred maintenance, Superintendent Jennifer Collier said. There are staffing shortages at all positions: teachers, paraprofessionals and support staff. As in much of the U.S., the cost of housing is surging. New developments that are being built do not include affordable housing, or when they do, the units are still out of reach for teachers.
That’s making it harder for a district that already loses about 1 in 5 of its teachers each year to keep or recruit new ones, who earn an average of only $46,150 their first year on the job, Collier said.
East Baton Rouge and the industrial corridor
It’s impossible to miss the tanks, towers, pipes and industrial structures that incongruously line Baton Rouge’s Scenic Highway landscape. They’re part of Exxon Mobil Corp.’s campus, home of the oil giant’s refinery in addition to chemical and plastics plants.

Sitting along the Mississippi River, the campus has been a staple of Louisiana’s capital for over 100 years. It’s where 6,000 employees and contractors who collectively earn over $400 million annually produce 522,000 barrels of crude oil per day when at full capacity, as well as the annual production and manufacture of 3 billion pounds of high-density polyethylene and polypropylene and 6.6 billion pounds of petrochemical products. The company posted a record-breaking $55.7 billion in profits in 2022 and $36 billion in 2023.
Across the street are empty fields and roads leading into neighborhoods that have been designated by the U.S. Department of Agriculture as a low-income food desert. A mile drive down the street to Route 67 is a Dollar General, fast-food restaurants, and tiny, rundown food stores. A Hi Nabor Supermarket is 4 miles away.
East Baton Rouge Parish’s McKinley High School, a 12-minute drive from the refinery, serves a student body that is about 80% Black and 85% poor. The school, which boasts famous alums such as rapper Kevin Gates, former NBA player Tyrus Thomas and Presidential Medal of Freedom recipient Gardner C. Taylor, holds a special place in the community, but it has been beset by violence and tragedy lately. Its football team quarterback, who was killed days before graduation in 2017, was among at least four of McKinley’s students who have been shot or murdered over the past six years.
The experience is starkly different at some of the district’s more advantaged schools, including its magnet programs open to high-performing students.

Baton Rouge is a tale of two cities, with some of the worst outcomes in the state for education, income and mortality, and some of the best outcomes. “It was only separated by sometimes a few blocks,” said Edgar Cage, the lead organizer for the advocacy group Together Baton Rouge. Cage, who grew up in the city when it was segregated by Jim Crow laws, said the root cause of that disparity was racism.
“Underserved kids don’t have a path forward” in East Baton Rouge public schools, Cage said.
A 2019 report from the Urban League of Louisiana found that economically disadvantaged African American and Hispanic students are not provided equitable access to high-quality education opportunities. That has contributed to those students underperforming on standardized state assessments, such as the LEAP exam, being unprepared to advance to higher grades and being excluded from high-quality curricula and instruction, as well as the highest-performing schools and magnet schools.
“Baton Rouge is home to some of the highest performing schools in the state,” according to the report. “Yet the highest performing schools and schools that have selective admissions policies often exclude disadvantaged students and African American and Hispanic students.”
Dawn Collins, who served on the district’s school board from 2016 to 2022, said that with more funding, the district could provide more targeted interventions for students who were struggling academically or additional support to staff so they can better assist students with greater needs.
But for decades, Louisiana’s Industrial Ad Valorem Tax Exemption Program, or ITEP, allowed for 100% property tax exemptions for industrial manufacturing facilities, said Erin Hansen, the statewide policy analyst at Together Louisiana, a network of 250 religious and civic organizations across the state that advocates for grassroots issues, including tax fairness.
The ITEP program was created in the 1930s through a state constitutional amendment, allowing companies to bypass a public vote and get approval for the exemption through the governor-appointed Board of Commerce and Industry, Hansen said. For over 80 years, that board approved nearly all applications that it received, she said.
Since 2000, Louisiana has granted a total of $35 billion in corporate property tax breaks for 12,590 projects.
Louisiana’s executive order
A few efforts to reform the program over the years have largely failed. But in 2016, Gov. John Bel Edwards signed an executive order that slightly but importantly tweaked the system. On top of the state board vote, the order gave local taxing bodies – such as school boards, sheriffs and parish or city councils – the ability to vote on their own individual portions of the tax exemptions. And in 2019 the East Baton Rouge Parish School Board exercised its power to vote down an abatement.
Throughout the U.S., school boards’ power over the tax abatements that affect their budgets vary, and in some states, including Georgia, Kansas, Nevada, New Jersey and South Carolina, school boards lack any formal ability to vote or comment on tax abatement deals that affect them.
Edwards’ executive order also capped the maximum exemption at 80% and tightened the rules so routine capital investments and maintenance were no longer eligible, Hansen said. A requirement concerning job creation was also put in place.
Concerned residents and activists, led by Together Louisiana and sister group Together Baton Rouge, rallied around the new rules and pushed back against the billion-dollar corporation taking more tax money from the schools. In 2019, the campaign worked: the school board rejected a $2.9 million property tax break bid by Exxon Mobil.
After the decision, Exxon Mobil reportedly described the city as “unpredictable.”
However, members of the business community have continued to lobby for the tax breaks, and they have pushed back against further rejections. In fact, according to Hansen, loopholes were created during the rulemaking process around the governor’s executive order that allowed companies to weaken its effectiveness.
In total, 223 Exxon Mobil projects worth nearly $580 million in tax abatements have been granted in the state of Louisiana under the ITEP program since 2000.
“ITEP is needed to compete with other states – and, in ExxonMobil’s case, other countries,” according to Exxon Mobil spokesperson Lauren Kight.
She pointed out that Exxon Mobil is the largest property taxpayer for the EBR school system, paying more than $46 million in property taxes in EBR parish in 2022 and another $34 million in sales taxes.
A new ITEP contract won’t decrease this existing tax revenue, Kight added. “Losing out on future projects absolutely will.”
The East Baton Rouge Parish School Board has continued to approve Exxon Mobil abatements, passing $46.9 million between 2020 and 2022. Between 2017 and 2023, the school district has lost $96.3 million.
Taxes are highest when industrial buildings are first built. Industrial property comes onto the tax rolls at 40% to 50% of its original value in Louisiana after the initial 10-year exemption, according to the Ascension Economic Development Corp.
Exxon Mobil received its latest tax exemption, $8.6 million over 10 years – an 80% break – in October 2023 for $250 million to install facilities at the Baton Rouge complex that purify isopropyl alcohol for microchip production and that create a new advanced recycling facility, allowing the company to address plastic waste. The project created zero new jobs.
The school board approved it by a 7-2 vote after a long and occasionally contentious board meeting.
“Does it make sense for Louisiana and other economically disadvantaged states to kind of compete with each other by providing tax incentives to mega corporations like Exxon Mobil?” said EBR School Board Vice President Patrick Martin, who voted for the abatement. “Probably, in a macro sense, it does not make a lot of sense. But it is the program that we have.”
Obviously, Exxon Mobil benefits, he said. “The company gets a benefit in reducing the property taxes that they would otherwise pay on their industrial activity that adds value to that property.” But the community benefits from the 20% of the property taxes that are not exempted, he said.
“I believe if we don’t pass it, over time the investments will not come and our district as a whole will have less money,” he added.
Meanwhile, the district’s budgetary woes are coming to a head. Bus drivers staged a sickout at the start of the school year, refusing to pick up students – in protest of low pay and not having buses equipped with air conditioning amid a heat wave. The district was forced to release students early, leaving kids stranded without a ride to school, before it acquiesced and provided the drivers and other staff one-time stipends and purchased new buses with air conditioning.
The district also agreed to reestablish transfer points as a temporary response to the shortages. But that transfer-point plan has historically resulted in students riding on the bus for hours and occasionally missing breakfast when the bus arrives late, according to Angela Reams-Brown, president of the East Baton Rouge Federation of Teachers. The district plans to purchase or lease over 160 buses and solve its bus driver shortage next year, but the plan could lead to a budget crisis.
A teacher shortage looms as well, because the district is paying teachers below the regional average. At the school board meeting, Laverne Simoneaux, an ELL specialist at East Baton Rouge’s Woodlawn Elementary, said she was informed that her job was not guaranteed next year since she’s being paid through federal COVID-19 relief funds. By receiving tax exemptions, Exxon Mobil was taking money from her salary to deepen their pockets, she said.
A young student in the district told the school board that the money could provide better internet access or be used to hire someone to pick up the glass and barbed wire in the playground. But at least they have a playground – Hayden Crockett, a seventh grader at Sherwood Middle Academic Magnet School, noted that his sister’s elementary school lacked one.
“If it wasn’t in the budget to fund playground equipment, how can it also be in the budget to give one of the most powerful corporations in the world a tax break?” Crockett said. “The math just ain’t mathing.”
Christine Wen worked for the nonprofit organization Good Jobs First from June 2019 to May 2022 where she helped collect tax abatement data.
Nathan Jensen has received funding from the John and Laura Arnold Foundation, the Smith Richardson Foundation, the Ewing Marion Kauffman Foundation and the Washington Center for Equitable Growth. He is a Senior Fellow at the Niskanen Center.
Danielle McLean and Kevin Welner do not work for, consult, own shares in or receive funding from any company or organization that would benefit from this article, and have disclosed no relevant affiliations beyond their academic appointment.
subsidies pandemic covid-19 governor mortality oilSpread & Containment
Dropping Like a Stone: ON RRP Take‑up in the Second Half of 2023
Take-up at the Overnight Reverse Repo Facility (ON RRP) has halved over the past six months, declining by more than $1 trillion since June 2023. This steady…
Share this:


Take-up at the Overnight Reverse Repo Facility (ON RRP) has halved over the past six months, declining by more than $1 trillion since June 2023. This steady decrease follows a rapid increase from close to zero in early 2021 to $2.2 trillion in December 2022, and a period of relatively stable balances during the first half of 2023. In this post, we interpret the recent drop in ON RRP take-up through the lens of the channels that we identify in our recent Staff Report as driving its initial increase.
ON RRP Take-up Has Been Decreasing since June 2023…

Banks’ Balance-Sheet Costs
As the Federal Reserve expanded its balance sheet in response to the COVID-19 pandemic, it increased the supply of reserves to the banking system and, as a result, banks’ balance sheets also grew. Reserves increased from $1.6 trillion—or 9 percent of banks assets—in January 2020 to $3.2 trillion—or 16 percent of bank assets—over the following three months, reaching a historical maximum of 19 percent of banks’ assets in September 2021. As the chart below shows, bank assets also grew from $18 trillion in January of 2020 to $20 trillion in April 2020, and continued to increase to $23 trillion in May 2023.
As banks’ balance sheets expand, regulatory ratios—such as the supplementary leverage ratio (SLR)—are likely to become tighter for some institutions. Banks react to increased balance-sheet costs by pushing some of their deposits toward the money market fund (MMF) industry—for instance, by lowering the rate paid on bank deposits—and reducing their demand for short-term debt. As we explain in our paper, both effects are likely to have boosted ON RRP take-up during March 2021 – May 2023, as most MMFs are eligible to invest in the ON RRP and do so especially when alternative investment options, such as banks’ wholesale short-term debt—including repos by dealers affiliated with a bank holding company—dwindle.
Likely, these effects have subsided relative to 2022. Indeed, since June 2023, bank assets have hovered around $23 trillion, slightly below their March 2023 peak. Moreover, reserves have been around 14 percent of bank assets since June 2023, below the average of 16 percent observed between March 2020 and May 2023. Since the SLR treats all assets in the same way regardless of their riskiness, large banks’ balance-sheet expansions are particularly costly if they are used to finance safe assets with low returns. Therefore, though bank assets have remained relatively stable, the recent decline in the ratio of reserves to bank assets has likely reduced banks’ overall balance-sheet costs.
…while Bank Assets and Reserves Relative to Bank Assets Have Remained Roughly Constant.

Consistent with a decrease in banks’ balance-sheet costs (and an increase in the supply of bank debt), the interest rates at which banks and broker dealers borrow via overnight Treasury-backed repos have increased since the fourth quarter of 2022 and are now a few basis points above the ON RRP rate (see chart below). This positive rate differential pushes MMFs away from investing at the ON RRP facility and into private repos.
The SOFR-ON RRP Spread Has Been Positive…

Monetary Policy
Monetary policy can affect ON RRP take-up by MMFs in two ways. First, the interest-rate pass-through of MMF shares is higher than that of bank deposits; as a result, the size of the MMF industry comoves with the monetary policy cycle as investors switch from bank deposits to MMF shares when the policy rate increases. Though the assets of the MMF industry are at an all-time high, the pace of the increase has somewhat decreased recently, consistent with a slower pace of monetary policy tightening; moreover, the share of MMF assets managed by government funds—the ones most likely to invest in the ON RRP—has decreased since June 2022 by 7 percentage points.
Second, monetary policy can affect MMFs’ take-up at the ON RRP also through its effect on interest-rate uncertainty. Higher uncertainty leads MMFs to rebalance their portfolios toward investments with shorter duration; the ON RRP is one such investment as it is overnight. Indeed, interest rate uncertainty—as measured by the MOVE index—had increased substantially during the latest tightening cycle, raising from 57.3 in May 2021 to 136 in May 2023. Recently, however, the increase has been partially reversed. Indeed, the average level of the MOVE was 125.6 in the first half of 2023 but declined to 117.3 in the second half of the year.
…while Interest-Rate Uncertainty Has Been Decreasing.

The Supply of T-bills
A third driver of ON RRP take-up is the supply of T-bills. The Federal Government has expanded the supply of T-bills dramatically in 2023: T-bills outstanding increased from $3.7 trillion at the end of 2022 to $5.3 trillion at the end of September 2023, with a $1.3 trillion increase since June. As the supply of T-bills grows, the investment options of MMFs—and especially of government funds, which represent 83 percent of the industry and can only invest in short-term government debt and repos backed by government debt—expand and, as a result, their investment in the ON RRP dwindles. In our staff report, we estimate that a $100 billion increase in the amount of T-bill issuance reduces the proportion of ON RRP investment in a government-MMF portfolio by 2.3 percentage points, relative to that in a prime-MMF portfolio; since average monthly T-bill issuance went from $1.12 trillion in the period from 2022:Q1-2023:Q1 to $1.53 trillion in 2023:Q2-2023:Q3, this effect on portfolio rebalancing amounts to an additional decrease in ON RRP investment of roughly $350 billion.
Summing It Up
The increase in ON RRP take-up between 2021 and May 2023 was driven by a series of factors: a rise in banks’ balance-sheet costs due to the expansion of the supply of reserves in response to the COVID-19 pandemic, the rapid hikes in policy rates aimed at fighting inflation and the resulting increase in interest-rate uncertainty, and the decrease in the T-bill supply of 2021-22 resulting from the normalization of public debt after the COVID-19 crisis.
These factors have reversed: the Federal Reserve restarted running off its balance sheet after the temporary expansion during the banking turmoil of March 2023; the growth of the banking system waned while the ratio of reserves to asset decreased; the pace of interest-rate hikes slowed down; and the T-bill supply increased again. If these dynamics persist in the months ahead, ON RRP take-up may continue to decrease. Such a steady decline would be consistent with that observed in early 2018, when investment at the ON RRP gradually disappeared as the Federal Reserve continued to normalize the size of its balance sheet and reserves in the banking system became less abundant.
Gara Afonso is the head of Banking Studies in the Federal Reserve Bank of New York’s Research and Statistics Group.
Marco Cipriani is the head of Money and Payments Studies in the Federal Reserve Bank of New York’s Research and Statistics Group.

Gabriele La Spada is a financial research economist in Money and Payments Studies in the Federal Reserve Bank of New York’s Research and Statistics Group.
How to cite this post:
Gara Afonso, Marco Cipriani, and Gabriele La Spada, “Dropping Like a Stone: ON RRP Take‑up in the Second Half of 2023,” Federal Reserve Bank of New York Liberty Street Economics, December 19, 2023, https://libertystreeteconomics.newyorkfed.org/2023/12/dropping-like-a-stone-on-rrp-take-up-in-the-second-half-of-2023/.


Disclaimer
The views expressed in this post are those of the author(s) and do not necessarily reflect the position of the Federal Reserve Bank of New York or the Federal Reserve System. Any errors or omissions are the responsibility of the author(s).


Catastrophic Risk: Investing and Business Implications


Redefining Poverty: Towards a Transpartisan Approach


Dropping Like a Stone: ON RRP Take‑up in the Second Half of 2023


Where Is R‑Star and the End of the Refi Boom: The Top 5 Posts of 2023


Students lose out as cities and states give billions in property tax breaks to businesses − draining school budgets and especially hurting the poorest students


Revving up tourism: Formula One and other big events look set to drive growth in the hospitality industry
-

 Uncategorized2 weeks ago
All Of The Elements Are In Place For An Economic Crisis Of Staggering Proportions
-

 Uncategorized1 month ago
Cathie Wood sells a major tech stock (again)
-

 Uncategorized3 weeks ago
California Counties Could Be Forced To Pay $300 Million To Cover COVID-Era Program
-

 Uncategorized2 weeks ago
Apparel Retailer Express Moving Toward Bankruptcy
-

 Uncategorized3 weeks ago
Industrial Production Decreased 0.1% in January
-

 International17 hours ago
Walmart launches clever answer to Target’s new membership program
-

 Uncategorized3 weeks ago
RFK Jr: The Wuhan Cover-Up & The Rise Of The Biowarfare-Industrial Complex
-

 Uncategorized3 weeks ago
GOP Efforts To Shore Up Election Security In Swing States Face Challenges