Uncategorized
Have Central Banks Lost Control Of The Gold Price?
Have Central Banks Lost Control Of The Gold Price?
Via GoldMoney.com,
Over the past few months, gold prices have completely detached from…
Share this:


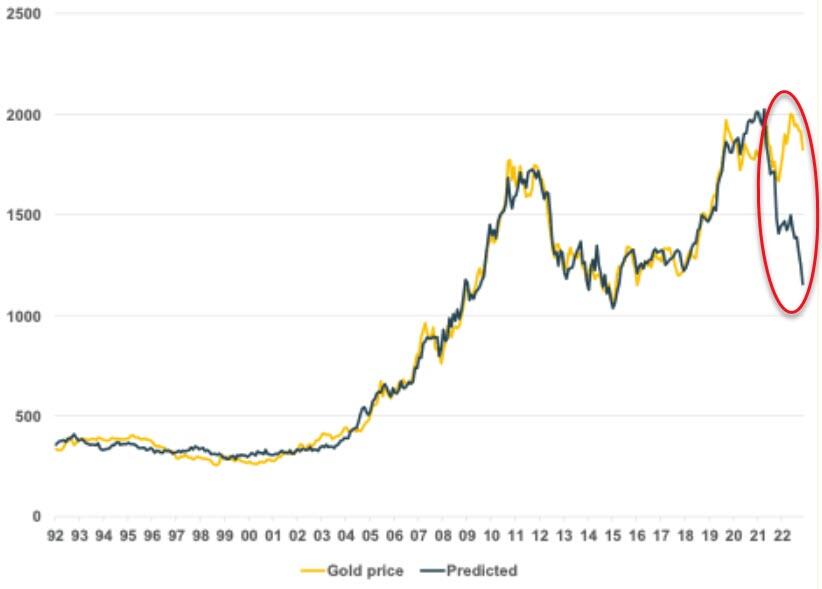
Over the past few months, gold prices have completely detached from our model-predicted prices.
While we have seen deviations between actual and predicted prices in the past, those deviations were always temporary.
What we are witnessing now is the paradigm shift we alluded to in our report from March 2023.
Some explanations for this deviation we presented in that report are still valid. However, it appears increasingly likely that the main reason for this development is the central banks’ having lost control over the gold price.
Exhibit 1: Gold prices have completely detached from model-predicted values
$/ozt
Source: Goldmoney Research
Earlier this year, we published a two-part report Gold prices reflect a shift in paradigm – Part I and Part II, (March 15 & 16, 2023) in which we explored the thesis that the gold market exhibits a permanent paradigm shift. Historically, gold prices followed three drivers: Real-interest rate expectations, longer-dated energy prices, and central bank policy (net gold sales and QE). In 2016 we presented a gold price model to our readers, which showed that most of the price changes in gold can be explained with these three drivers. Deviations of the observed price from the model were usually short lived and prices eventually converged with the underlying drivers. Readers unfamiliar with our model can catch up here (Gold Price Framework Vol. 2: The energy side of the equation, May 28, 2018, here (Part II, 10 July 2018) and here (Part III, 24 August 2018), as well as some follow up reports that built on the model (Gold Price Framework Update – the New Cycle Accelerates, 28 January 2021) and (Gold prices continue to weather the rate storm, 13 April, 2022.
When the Fed began to hike rates in late 2021 as a reaction to burgeoning inflation, gold prices did first what the model would predict: They began to decline. Rising interest rates usually lead to higher real interest rate expectations if long-term rates rise faster than long-term inflation expectations. Real-interest rate expectations (as measured by 10-year TIPS yields) are strongly inversely correlated with gold prices as shown in our model. In the past, gold prices often followed real interest rates almost tick-by-tick intraday without any other news.
The decline in gold prices in early 2022 on the back of rising real-interest rate expectations was somewhat cushioned by rising energy prices. Long-dated oil prices rallied from $63.90/bbl in December 2021 to $75.91/bbl by July 2022. In our model, the rise in 10-year tips lowered predicted gold prices by $400/ozt while the rise in deferred oil prices increased it by $100/ozt (see Exhibit 2). On net, by August 2022, gold stood at $1737/ozt, just $25/ozt over our model predicted price of $1712.
Exhibit 2: The effect on gold by the rise in 10-year TIPS yields was initially offset by rising longer-dated oil prices
$/bbl (LHS), % (RHS)

Source: FRED, Goldmoney Research
However, while model-predicted prices continued to decline on the back of relentlessly rising real-interest rate expectations – and later the retracement of long-dated oil prices – gold prices turned and started to go up again. By fall 2022, we began noticing that, once again, gold prices had meaningfully deviated from predicted values. By the time we wrote our March 2023 note, gold traded already $450/ozt over the model predicted price, an absolute record at the time. Now the delta is a staggering $668/ozt. At the time of writing, gold is trading at $1870/ozt. But based on our model, it should be closer to $1202/ozt (see Exhibit 1). The chart illustrates clearly how detached gold prices have become from our model, and thus, the underlying drivers.
In our March 2023 note, we explored several theories that attempted to explain this large discrepancy between actual and predicted prices and we discussed whether we thought this was just a temporary phenomenon or whether this was something more permanent.
The first observation was that central banks of non-OECD countries have been on a massive buying spree from late summer 2022. In our March 2023 report, we highlighted that the IMFs estimate of net central bank purchases was way too low in our view. We highlighted that even the much more optimistic estimates by the World Gold Council might be too low. For our model, we are using the high end of estimates from the WGC, but if actual gold purchases were even higher, then our model-predicted price would be too low. In addition, we also explained why we think our model may underestimate the extent to which central bank purchases drive the price. Historically, changes in CB holding were relatively small, and often the reporting time did not match the actual purchase. Particularly non- OECD central banks have been very opaque when it comes to gold purchases. That means our econometric models cannot properly attribute changes in the gold price to changes in central bank gold holdings. We concluded that the true impact on the price of gold is likely larger than what our model predicts. Thus, in our March 2023 note we came to the conclusion that strong central bank gold purchases might partially explain why our model was underpredicting prices.
However, since then central banks became net sellers again. Data from the World Gold Council shows that central banks were large net gold sellers in March, April and May of this year, and only became net gold buyers again in June, July and August.
Exhibit 3: After a few months of large increases, central banks turned to net sellers in summer 2023 again
Tonnes month-over-month

Source: WGC, Goldmoney Research
On net, central banks didn’t add more gold than normal so far in 2023. In fact, despite the strong rebound over the past few months, central banks added less gold in 2023 than on average since 2009. Hence, we can conclude that the large deviation of actual and model predicted gold prices was and is not due to abnormally high central bank gold purchases.
Exhibit 4: Central banks added less gold in 2023 than on average since 2009
Tonnes

Source: WGC, Goldmoney Research
The second observation we made is that something seemed to have changed in the relationship between real-interest rate expectations and gold prices. The US has a very useful financial instrument to observe real-interest rate expectations: Treasury Inflation Protected Securities (TIPS). TIPS are government issued bonds that pay a fixed interest, similar to Treasuries. However, TIPS also compensate the holders for inflation as measured by the CPI. Thus, TIPS tend to carry a lower yield than treasuries of equivalent maturity. The difference between the nominal yield of a treasury note and the equivalent TIPS is therefore the market’s expectations for future inflation. We call this the breakeven inflation. TIPS yields themselves reflect real-interest rate expectations, meaning what the market thinks holders will earn in (real) interest until maturity, after inflation has been taken into account. Until very recently, gold and 10-year TIPS yields showed a remarkable inverse correlation over decades. However, since fall 2022, that relationship has broken down (see Exhibit 5).
Exhibit 5: The strong inverse correlation between TIPS yields and gold has broken down
% change gold price y-o-y (Log) (LHS), change in 10y TIPS yield % (RHS), inversed
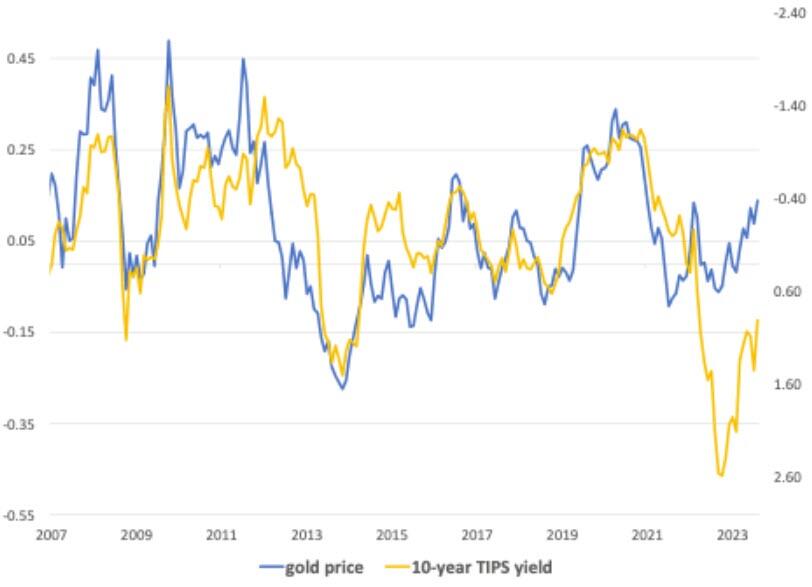
Source: Goldmoney Research
10-year TIPS yields rallied sharply since the Fed started raising rates, from -1.08% to currently 2.43%. That shift alone should have pushed gold price $600/ozt lower (see Exhibit 6).
Exhibit 6: 10-year TIPS yields moved over 3.5% higher in just 18 months
%
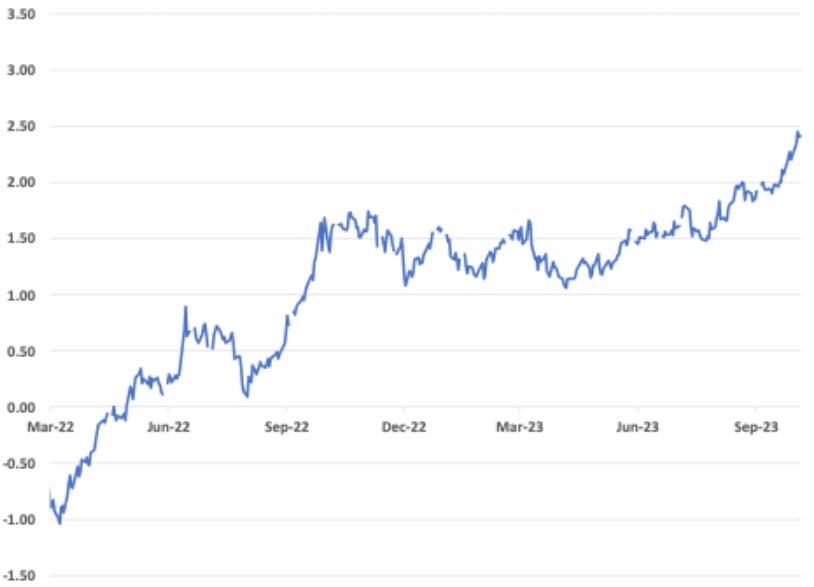
Source: FRED, Goldmoney Research
Arguably, there still are periods during which gold and real-interest rate move in lockstep, but for the past months, we observed long periods during which the inverse correlation between the two has completely broken down. Why is this? One can argue that the gold market is simply pricing in different inflation expectations than the TIPS market. One possible interpretation of the resilience of gold amidst rising real-interest rate expectations is that it is actually the TIPS market that is broken and not our model. While realized inflation jumped to 9% last year, implied breakeven inflation in TIPS yields barely moved above 3% and are already back to just shy of 2%, a level similar to years prior to the jump in inflation (see Exhibit 7).
Exhibit 7: 10-year TIPS breakeven inflation expectations remained low throughout the recent inflation spike
%
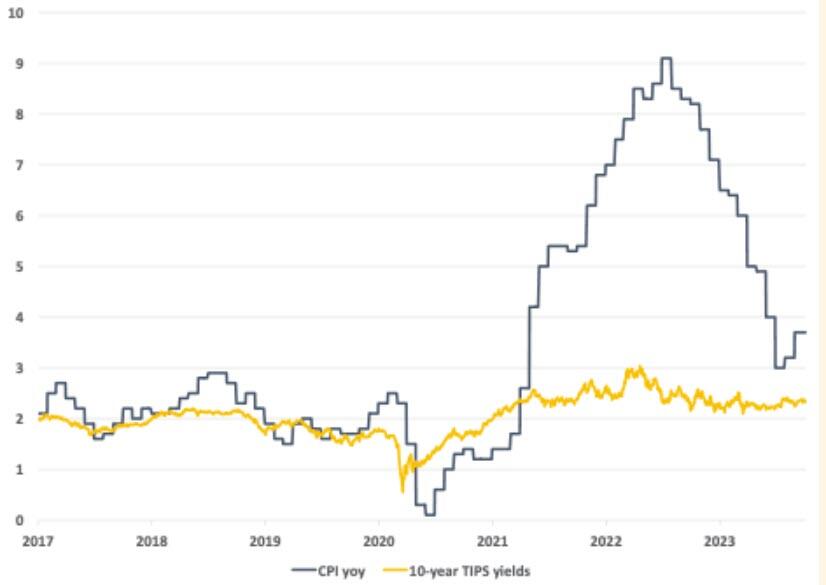
Source: FRED, Goldmoney Research
The absence of rising long-term breakeven inflation in the TIPS amidst relentlessly rising long-term interest rates have pushed 10-year TIPS yields to the highest level since 2008 (see Exhibit 8).
Exhibit 8: 10-year TIPS have reached levels not seen since 2008 on the back of rising nominal yields
%
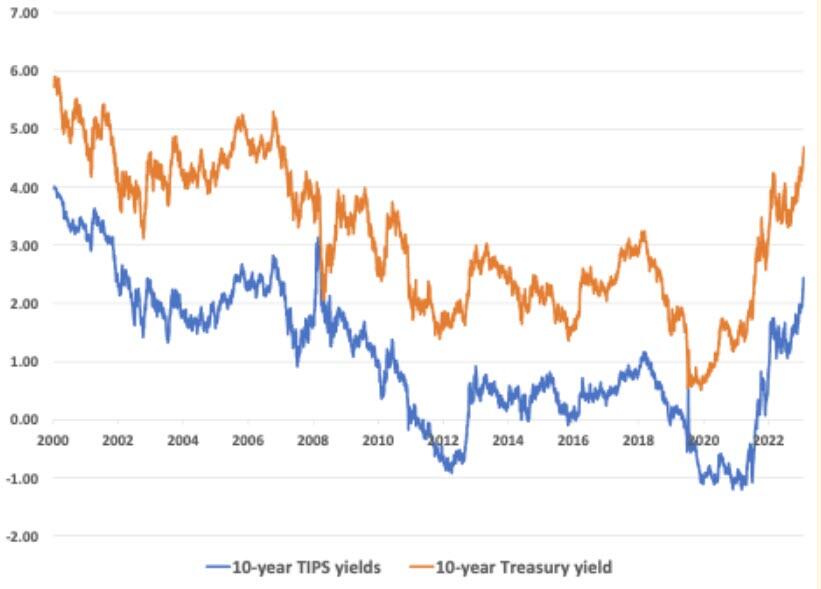
Source: FRED, Goldmoney research
Inflation expectations would not have to be much higher than what is currently priced into TIPS yields to close the gap between observed and predicted gold prices. Assuming that “true” inflation expectations are 1% higher than what is embedded in 10-year TIPS yields, our model predicted gold prices would be around $1410/ozt. 2.5% higher inflation expectations close the gap almost entirely.
However, while we are sympathetic to the view that the gold market simply prices in higher (and in our view, more reasonable) longer-term inflation expectations than the TIPS market, this does still not explain why the correlation between changes in TIPS yields and gold prices seem to have completely broken-down multiple times since 2022. We, thus, present our readers with a third explanation. That is, we think western central banks have simply lost control over gold prices. What do we mean by that?
Despite abandoning the gold standard decades ago, gold prices still largely reflected central bank actions since then. Arguably western central banks so far were not primarily concerned about the price of gold in their respective currency, but they do try to control some of the factors that also drive gold prices. To illustrate this with the three main drivers for gold prices we identified in our model (Central bank net gold purchases/sales, real-interest rate expectations and longer dated energy prices):
-
Until recently, it was mainly western central banks that bought and sold large quantities of gold (mostly sold).
-
Central banks set interest rates, which impacted real-interest rates expectations. Central banks also control how much money is in circulation, which impacted inflation and inflation expectations. QE was just another form of manipulating interest rates (and we argue it is behind the surge in inflation).
-
On a long enough timeline, longer dated energy prices reflect mostly inflation.
In other words, markets understood that central banks and their policies were ultimately behind rising gold prices. But importantly, the market also believed that central banks had the power to reverse the impact of their policies and implicitly had the power to bring gold prices down. Our model shows that over the last 20+ years, sell-offs in gold prices were mainly due to falling longer-dated energy prices and / or rising real-interest rate expectations. The fact that the recent massive rally in real-interest rate expectations – which was entirely driven by central bank rate hikes – was just shrugged off by the gold market, suggests that the power of western central banks, and particularly the Fed, to implicitly control gold prices, has dramatically decreased, if not vanished.
To go one step further, the above interpretation may look at things the wrong way around. One can argue golds reluctance to react to the Fed rate hikes is just a symptom of a much larger issue. Rather than having lost control over gold prices, the Fed may have lost control over the US dollar itself. Gold priced in US dollars simply reflects that. And the Fed is not alone, all central banks are facing the same issue.
Gold has always been able to retain its purchasing power over the long run. But now it seems that gold is the only form of money left that retains value. All other monies are just wildly fluctuating against each other. It appears that gold is a better arbiter of value today than it has ever been since President Nixon suspended the gold standard in 1971.
Can the fed regain control over gold prices? The sharp rise in US interest rates by the Fed may have temporarily slowed price inflation as reported in the CPI. We think there is a high chance that the sudden rise in interest rates will cause a global recession in the near term, which in turn could even lead to temporary deflation as commodity demand collapses. But all the monetary policy that preceded the recent rise in inflation has not been undone and as a result, neither have all the excesses in the financial markets. For example, while the Fed funds rate went from zero to 5.5%, the Fed only unwound a fraction of its assets, from $9 trillion to $8 trillion (see Exhibit 9). Since the start of QT, the Fed has reduced its balance sheet by roughly $13bn per week. At this pace, it would take until 2029 to bring back the Feds balance sheet to just pre-pandemic levels, and until 2034 to bring it back to pre-financial crisis levels.
Exhibit 9: Amidst massively tighter financial conditions, the Feds balance sheet has barely moved lower
$ millions
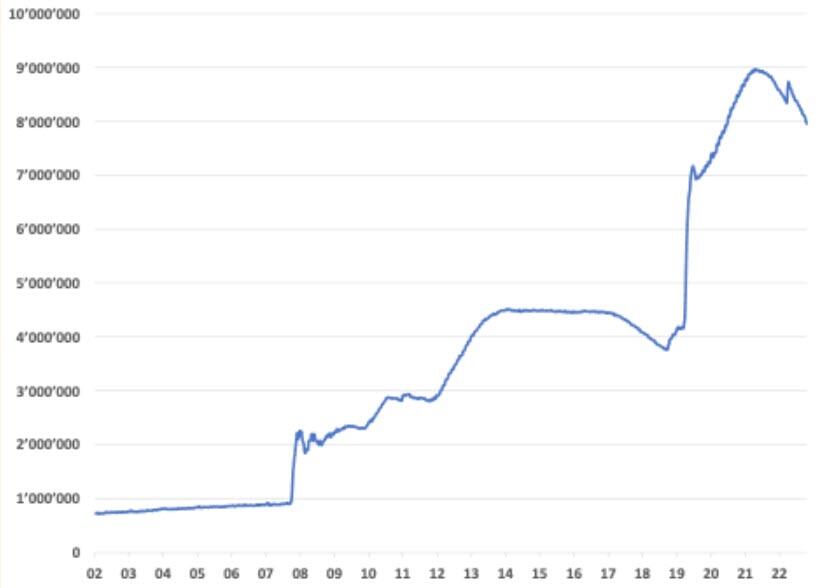
Source: FRED, Goldmoney Research
It is extremely unlikely in our view that we will see significantly more QT until the next crisis forces the Fed to reverse course. More and more people are recognizing that gold is a neutral anchor in an increasingly fragile currency world.
They chose to move more of their wealth in gold simply because the uncertainty of currency value remains extremely high even as observed inflation has come off substantially.
In our past reports about this topic, we concluded that the reasons why gold prices deviate from their historical drivers may well be permanent, but there is also a risk that the impending recession will crush that gap as inflation turns to deflation, real-interest rate expectations jump and investors seek refuge in the $ rather than gold, as they have done before, most notably in the early days of the great financial crisis in 2008/2009. While we still think that a sharp recession can put downward pressure on gold prices, we no longer think that the gap between observed prices and model predicted prices will close. The drivers behind the deviation are permanent in our view. Foreign central banks will most likely continue increasing their gold holdings.
“True” inflation expectations will remain high, and probably rise sharply when the Fed and other western central banks will inevitably return to ZIRP and NIRP and aggressively pursue QE. This will further undermine the Feds and other central banks ability to control the exchange rate between gold and their respective currencies.
Uncategorized
February Employment Situation
By Paul Gomme and Peter Rupert The establishment data from the BLS showed a 275,000 increase in payroll employment for February, outpacing the 230,000…
Share this:


By Paul Gomme and Peter Rupert
The establishment data from the BLS showed a 275,000 increase in payroll employment for February, outpacing the 230,000 average over the previous 12 months. The payroll data for January and December were revised down by a total of 167,000. The private sector added 223,000 new jobs, the largest gain since May of last year.

Temporary help services employment continues a steep decline after a sharp post-pandemic rise.


Average hours of work increased from 34.2 to 34.3. The increase, along with the 223,000 private employment increase led to a hefty increase in total hours of 5.6% at an annualized rate, also the largest increase since May of last year.

The establishment report, once again, beat “expectations;” the WSJ survey of economists was 198,000. Other than the downward revisions, mentioned above, another bit of negative news was a smallish increase in wage growth, from $34.52 to $34.57.

The household survey shows that the labor force increased 150,000, a drop in employment of 184,000 and an increase in the number of unemployed persons of 334,000. The labor force participation rate held steady at 62.5, the employment to population ratio decreased from 60.2 to 60.1 and the unemployment rate increased from 3.66 to 3.86. Remember that the unemployment rate is the number of unemployed relative to the labor force (the number employed plus the number unemployed). Consequently, the unemployment rate can go up if the number of unemployed rises holding fixed the labor force, or if the labor force shrinks holding the number unemployed unchanged. An increase in the unemployment rate is not necessarily a bad thing: it may reflect a strong labor market drawing “marginally attached” individuals from outside the labor force. Indeed, there was a 96,000 decline in those workers.


Earlier in the week, the BLS announced JOLTS (Job Openings and Labor Turnover Survey) data for January. There isn’t much to report here as the job openings changed little at 8.9 million, the number of hires and total separations were little changed at 5.7 million and 5.3 million, respectively.

As has been the case for the last couple of years, the number of job openings remains higher than the number of unemployed persons.

Also earlier in the week the BLS announced that productivity increased 3.2% in the 4th quarter with output rising 3.5% and hours of work rising 0.3%.

The bottom line is that the labor market continues its surprisingly (to some) strong performance, once again proving stronger than many had expected. This strength makes it difficult to justify any interest rate cuts soon, particularly given the recent inflation spike.
unemployment pandemic unemploymentUncategorized
Mortgage rates fall as labor market normalizes
Jobless claims show an expanding economy. We will only be in a recession once jobless claims exceed 323,000 on a four-week moving average.
Share this:


Everyone was waiting to see if this week’s jobs report would send mortgage rates higher, which is what happened last month. Instead, the 10-year yield had a muted response after the headline number beat estimates, but we have negative job revisions from previous months. The Federal Reserve’s fear of wage growth spiraling out of control hasn’t materialized for over two years now and the unemployment rate ticked up to 3.9%. For now, we can say the labor market isn’t tight anymore, but it’s also not breaking.
The key labor data line in this expansion is the weekly jobless claims report. Jobless claims show an expanding economy that has not lost jobs yet. We will only be in a recession once jobless claims exceed 323,000 on a four-week moving average.
From the Fed: In the week ended March 2, initial claims for unemployment insurance benefits were flat, at 217,000. The four-week moving average declined slightly by 750, to 212,250
Below is an explanation of how we got here with the labor market, which all started during COVID-19.
1. I wrote the COVID-19 recovery model on April 7, 2020, and retired it on Dec. 9, 2020. By that time, the upfront recovery phase was done, and I needed to model out when we would get the jobs lost back.
2. Early in the labor market recovery, when we saw weaker job reports, I doubled and tripled down on my assertion that job openings would get to 10 million in this recovery. Job openings rose as high as to 12 million and are currently over 9 million. Even with the massive miss on a job report in May 2021, I didn’t waver.
Currently, the jobs openings, quit percentage and hires data are below pre-COVID-19 levels, which means the labor market isn’t as tight as it once was, and this is why the employment cost index has been slowing data to move along the quits percentage.

3. I wrote that we should get back all the jobs lost to COVID-19 by September of 2022. At the time this would be a speedy labor market recovery, and it happened on schedule, too
Total employment data
4. This is the key one for right now: If COVID-19 hadn’t happened, we would have between 157 million and 159 million jobs today, which would have been in line with the job growth rate in February 2020. Today, we are at 157,808,000. This is important because job growth should be cooling down now. We are more in line with where the labor market should be when averaging 140K-165K monthly. So for now, the fact that we aren’t trending between 140K-165K means we still have a bit more recovery kick left before we get down to those levels.

From BLS: Total nonfarm payroll employment rose by 275,000 in February, and the unemployment rate increased to 3.9 percent, the U.S. Bureau of Labor Statistics reported today. Job gains occurred in health care, in government, in food services and drinking places, in social assistance, and in transportation and warehousing.
Here are the jobs that were created and lost in the previous month:

In this jobs report, the unemployment rate for education levels looks like this:
- Less than a high school diploma: 6.1%
- High school graduate and no college: 4.2%
- Some college or associate degree: 3.1%
- Bachelor’s degree or higher: 2.2%

Today’s report has continued the trend of the labor data beating my expectations, only because I am looking for the jobs data to slow down to a level of 140K-165K, which hasn’t happened yet. I wouldn’t categorize the labor market as being tight anymore because of the quits ratio and the hires data in the job openings report. This also shows itself in the employment cost index as well. These are key data lines for the Fed and the reason we are going to see three rate cuts this year.
recession unemployment covid-19 fed federal reserve mortgage rates recession recovery unemploymentUncategorized
Inside The Most Ridiculous Jobs Report In History: Record 1.2 Million Immigrant Jobs Added In One Month
Inside The Most Ridiculous Jobs Report In History: Record 1.2 Million Immigrant Jobs Added In One Month
Last month we though that the January…
Share this:


Last month we though that the January jobs report was the "most ridiculous in recent history" but, boy, were we wrong because this morning the Biden department of goalseeked propaganda (aka BLS) published the February jobs report, and holy crap was that something else. Even Goebbels would blush.
What happened? Let's take a closer look.
On the surface, it was (almost) another blockbuster jobs report, certainly one which nobody expected, or rather just one bank out of 76 expected. Starting at the top, the BLS reported that in February the US unexpectedly added 275K jobs, with just one research analyst (from Dai-Ichi Research) expecting a higher number.
Some context: after last month's record 4-sigma beat, today's print was "only" 3 sigma higher than estimates. Needless to say, two multiple sigma beats in a row used to only happen in the USSR... and now in the US, apparently.

Before we go any further, a quick note on what last month we said was "the most ridiculous jobs report in recent history": it appears the BLS read our comments and decided to stop beclowing itself. It did that by slashing last month's ridiculous print by over a third, and revising what was originally reported as a massive 353K beat to just 229K, a 124K revision, which was the biggest one-month negative revision in two years!

Of course, that does not mean that this month's jobs print won't be revised lower: it will be, and not just that month but every other month until the November election because that's the only tool left in the Biden admin's box: pretend the economic and jobs are strong, then revise them sharply lower the next month, something we pointed out first last summer and which has not failed to disappoint once.
In the past month the Biden department of goalseeking stuff higher before revising it lower, has revised the following data sharply lower:
— zerohedge (@zerohedge) August 30, 2023
- Jobs
- JOLTS
- New Home sales
- Housing Starts and Permits
- Industrial Production
- PCE and core PCE
To be fair, not every aspect of the jobs report was stellar (after all, the BLS had to give it some vague credibility). Take the unemployment rate, after flatlining between 3.4% and 3.8% for two years - and thus denying expectations from Sahm's Rule that a recession may have already started - in February the unemployment rate unexpectedly jumped to 3.9%, the highest since February 2022 (with Black unemployment spiking by 0.3% to 5.6%, an indicator which the Biden admin will quickly slam as widespread economic racism or something).

And then there were average hourly earnings, which after surging 0.6% MoM in January (since revised to 0.5%) and spooking markets that wage growth is so hot, the Fed will have no choice but to delay cuts, in February the number tumbled to just 0.1%, the lowest in two years...

... for one simple reason: last month's average wage surge had nothing to do with actual wages, and everything to do with the BLS estimate of hours worked (which is the denominator in the average wage calculation) which last month tumbled to just 34.1 (we were led to believe) the lowest since the covid pandemic...

... but has since been revised higher while the February print rose even more, to 34.3, hence why the latest average wage data was once again a product not of wages going up, but of how long Americans worked in any weekly period, in this case higher from 34.1 to 34.3, an increase which has a major impact on the average calculation.

While the above data points were examples of some latent weakness in the latest report, perhaps meant to give it a sheen of veracity, it was everything else in the report that was a problem starting with the BLS's latest choice of seasonal adjustments (after last month's wholesale revision), which have gone from merely laughable to full clownshow, as the following comparison between the monthly change in BLS and ADP payrolls shows. The trend is clear: the Biden admin numbers are now clearly rising even as the impartial ADP (which directly logs employment numbers at the company level and is far more accurate), shows an accelerating slowdown.

But it's more than just the Biden admin hanging its "success" on seasonal adjustments: when one digs deeper inside the jobs report, all sorts of ugly things emerge... such as the growing unprecedented divergence between the Establishment (payrolls) survey and much more accurate Household (actual employment) survey. To wit, while in January the BLS claims 275K payrolls were added, the Household survey found that the number of actually employed workers dropped for the third straight month (and 4 in the past 5), this time by 184K (from 161.152K to 160.968K).

This means that while the Payrolls series hits new all time highs every month since December 2020 (when according to the BLS the US had its last month of payrolls losses), the level of Employment has not budged in the past year. Worse, as shown in the chart below, such a gaping divergence has opened between the two series in the past 4 years, that the number of Employed workers would need to soar by 9 million (!) to catch up to what Payrolls claims is the employment situation.

There's more: shifting from a quantitative to a qualitative assessment, reveals just how ugly the composition of "new jobs" has been. Consider this: the BLS reports that in February 2024, the US had 132.9 million full-time jobs and 27.9 million part-time jobs. Well, that's great... until you look back one year and find that in February 2023 the US had 133.2 million full-time jobs, or more than it does one year later! And yes, all the job growth since then has been in part-time jobs, which have increased by 921K since February 2023 (from 27.020 million to 27.941 million).

Here is a summary of the labor composition in the past year: all the new jobs have been part-time jobs!

But wait there's even more, because now that the primary season is over and we enter the heart of election season and political talking points will be thrown around left and right, especially in the context of the immigration crisis created intentionally by the Biden administration which is hoping to import millions of new Democratic voters (maybe the US can hold the presidential election in Honduras or Guatemala, after all it is their citizens that will be illegally casting the key votes in November), what we find is that in February, the number of native-born workers tumbled again, sliding by a massive 560K to just 129.807 million. Add to this the December data, and we get a near-record 2.4 million plunge in native-born workers in just the past 3 months (only the covid crash was worse)!

The offset? A record 1.2 million foreign-born (read immigrants, both legal and illegal but mostly illegal) workers added in February!

Said otherwise, not only has all job creation in the past 6 years has been exclusively for foreign-born workers...

... but there has been zero job-creation for native born workers since June 2018!

This is a huge issue - especially at a time of an illegal alien flood at the southwest border...

... and is about to become a huge political scandal, because once the inevitable recession finally hits, there will be millions of furious unemployed Americans demanding a more accurate explanation for what happened - i.e., the illegal immigration floodgates that were opened by the Biden admin.
Which is also why Biden's handlers will do everything in their power to insure there is no official recession before November... and why after the election is over, all economic hell will finally break loose. Until then, however, expect the jobs numbers to get even more ridiculous.


Wendy’s has a new deal for daylight savings time haters


Watch Live: President Biden Reminds Americans Just How Good They’ve Got It Thanks To Him


Mortgage rates fall as labor market normalizes


Racial and Ethnic Wealth Inequality in the Post‑Pandemic Era


Wealth Inequality by Age in the Post‑Pandemic Era


Watch: President Biden Delivers The “Darkest, Most Un-American Speech Given By A President”


Shipping company files surprise Chapter 7 bankruptcy, liquidation


Interest rates, the best it gets. It’s time to deploy cash


Is the biotech market rally real? Data suggest comeback in private, public markets


February Employment Situation
-

 Uncategorized2 weeks ago
All Of The Elements Are In Place For An Economic Crisis Of Staggering Proportions
-

 Uncategorized1 month ago
Cathie Wood sells a major tech stock (again)
-

 Uncategorized3 weeks ago
California Counties Could Be Forced To Pay $300 Million To Cover COVID-Era Program
-

 Uncategorized2 weeks ago
Apparel Retailer Express Moving Toward Bankruptcy
-

 Uncategorized3 weeks ago
Industrial Production Decreased 0.1% in January
-

 International1 day ago
Walmart launches clever answer to Target’s new membership program
-

 Uncategorized3 weeks ago
RFK Jr: The Wuhan Cover-Up & The Rise Of The Biowarfare-Industrial Complex
-

 Uncategorized3 weeks ago
GOP Efforts To Shore Up Election Security In Swing States Face Challenges