Uncategorized
Futures Rise, Yields Dip Ahead Of August Jobs Data
Futures Rise, Yields Dip Ahead Of August Jobs Data
Futures and global markets are higher ahead of the NFP today at 8:30am ET (full preview…
Share this:

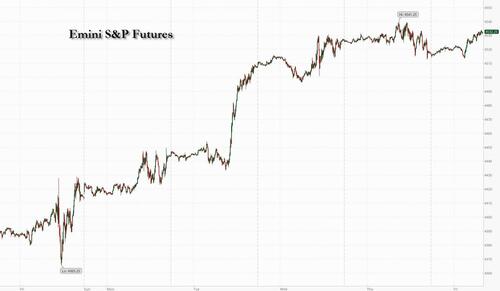
Futures and global markets are higher ahead of the NFP today at 8:30am ET (full preview here). At 7:40am ET, S&P futures rose 0.3% to 4,531 with Nasdaq futures up 0.2%. Major global markets are also higher, led by the UK (UKX +0.5%, SX5E +0.4%, SXXP +0.4%, DAX +0.1%), with the final Eurozone Mfg PMI is revised lower to 43.5 from 43.7, further boosting odds the ECB is done. On September ECB, Greg Fuzesi thinks that the July minutes and Isabel Schnabel’s comments yesterday (“growth had “moderated visibly”) both consistent with a pause in September ECB. He expects the final hike to happen in October after a pause in September. China reduced banks’ reserve requirement of foreign currency deposits, boosting the yuan, while China's Caixin Mfg PMIsurprised to the upside: 51.0 vs. 49.0 survey vs. 49.2 prior. Bond yields are lower and the Bloomberg dollar index is flat. Commodities are mostly stronger led by oil. Key macro focus will be the labor data release today (NFP, Unemployment Rate, Avg. Hourly Earnings, Labor Force Participation) at 8.30am ET and the Mfg ISM at 10am ET.
In premarket trading, Broadcom dropped as much as 4.6% after its revenue forecast disappointed, signaling that demand for electronic components remains sluggish. Dell Technologies jumped 10% after it reported better-than-expected second-quarter revenue, driven by personal computers and data center hardware sales. US-listed Chinese stocks advanced in premarket trading after Beijing and Shanghai both eased housing rules, a sign of further government support toward the economy. Here are some other notable premarket movers:
- 23andMe jumps 19% after it received FDA 510(k) clearance to report an additional 41 genetic variants in the BRCA1 and BRCA2 genes that increase risk for breast, ovarian, prostate and pancreatic cancer.
- Elastic rises 17% after its first-quarter results beat expectations and full-year forecast was raised.
- Eos Energy Enterprises soars 50% after announcing that the Department of Energy’s Loan Programs Office has issued an up to $398.6 million conditional commitment to the battery startup.
- Lululemon gains 3% as analysts lift their price targets on the the athleisure firm that boosted its net revenue guidance after the close on Thursday.
- MongoDB rallies 6.4% after a 55% boost to full-year EPS guidance at mid-point of the outlook range, prompting analysts to raise price targets.
- Nutanix jumps 18% as guidance beat expectations. Analysts noted a strong performance in renewals and a share buyback worth $350 million.
- SentinelOne gains 2% after estimate-beating results and raised guidance eased investor fears over competition.
- Shares in marijuana companies advanced as the Drug Enforcement Agency said Wednesday it would review its classification of cannabis. Canopy Growth gains 12%, Tilray Brands (TLRY) rises 3%, Aurora Cannabis (ACB) is up 2.5%.
- Tingo Group falls 14% as short seller Hindenburg Research posted a message about the agri-fintech firm on X.
Friday’s payrolls report (previewed here) should provide further evidence of cooling in the still-tight US labor market. The question is whether that will be enough to stall the Federal Reserve’s tightening cycle or even lead to early rate cuts. Meanwhile, a rapidly weakening economy is likely to tilt the European Central Bank in favor of a pause this month, with no further hikes beyond the current rate of 3.75%, according to Morgan Stanley economists.
Consensus expects a 170K NFP print with unemployment unchanged at 3.5%, and average hourly earnings dropping to 4.3% YoY from 4.4%. Here is a breakdown of payrolls forecasts by bank:
- 215,000 - Societe Generale
- 200,000 - Barclays
- 200,000 - UBS
- 175,000 - HSBC
- 170,000 - Credit Suisse
- 160,000 - Wells Fargo
- 155,000 - Morgan Stanley
- 150,000 - Deutsche Bank
- 149,000 - Goldman Sachs
- 130,000 - Citigroup
- 125,000 - JP Morgan Chase
“I’m personally more inclined toward the soft landing scenario given the resilience of the labor market and inflation slowing down, so I’m not expecting any catastrophic numbers this afternoon,” said Harry Wolhandler, head of equities at Meeschaert Asset Management in Paris. “In any event, should there be bad surprises, the Fed now has room for maneuver to lower rates.”
The Stoxx Europe 600 index rose 0.3%, trimming a bigger gain earlier in the session, with energy majors outperforming as crude oil headed for the biggest weekly advance since April. Miners jumped as China’s latest stimulus measures boosted prices of some industrial metals. Car makers declined, with Renault SA and Volkswagen AG falling more than 3% each after being downgraded to sell by UBS Group AG on increasing competition from Asia. Aurubis AG slumped as much as 18% after Europe’s top copper producer said it faces large losses due to a massive metal theft. Here are the other notable European movers:
- Johnson Matthey jumps as much as 14% after Standard Investments, the investment arm of US company Standard Industries, doubles its stake in the British chemicals maker
- Vestas gains as much as 3.8% after the wind-turbine manufacturer announced it is close to landing a large order to deliver turbines for a US wind park, a potential respite for the beleaguered industry
- European energy stocks outperform after the sector is double-upgraded to overweight at Morgan Stanley, predicting an extended period of strong free cash flow, buybacks and dividend growth
- WH Smith gains as much as 4.3% after Goodbody upgraded its recommendation on the UK newsagent and bookstore chain to buy, citing “encouraging momentum” going into the new fiscal year
- Boohoo shares rise as much as 10% on Friday, on track for their biggest weekly advance since Nov. 11, after Frasers increases its stake in the online fast fashion retailer
- Fielmann Group rises as much as 6.3% after the eyewear company raised its full-year guidance after its recent acquisition of SVS Vision amid what AlsterResearch sees as an attractive market.
- AmRest Holdings rise as much as 3.5% after the Polish restaurant operator reported better-than-expected 2Q earnings and gave positive outlook on current trading
- Aurubis slumps as much as 18% after Europe’s top copper producer releases an update identifying a large metal theft. Salzgitter, which has a 30% stake in Aurubis, drops 7.3% as it suspends guidance
- Renault and Volkswagen decline after both carmakers were cut to sell and given Street-low price targets by UBS, which cites the impact from factors including the rise of Chinese automakers
- BioMerieux falls as much as 7.7% after the French diagnostics firm’s second-quarter Ebit slightly missed estimates due to negative currency and M&A effects, overshadowing a beat on overall sales
Earlier in the session, Asian stocks advanced and headed for their second weekly gain, as Chinese equities climbed following more stimulus measures from Beijing. Japan’s benchmark also rose, eyeing an historic milestone. The MSCI Asia Pacific Index rose as much as 0.5%, led higher by Samsung and several Japanese firms.
China shares traded higher and metals looked set to extend this week’s advances after China's government allowed the nation’s largest cities to cut down payments for home buyers and encouraged lenders to lower rates on existing mortgages as well as on deposits. Meanwhile, Shanghai and Beijing eased home-buying mortgage rules for residents. Hong Kong’s market was shut as the city braced for what may be the strongest storm to hit in at least five years.
The yuan also strengthened after China’s central bank reduced the foreign exchange reserve requirement ratio for financial institutions in a bid to support the currency. The currency has since pared its gains. Sentiment was further buoyed by an unexpected rise in manufacturing data that advanced to 51 in August, the highest reading since February, according to a Caixin survey.
Japan’s Topix benchmark gained nearly 1%, boosted by Sony, putting it on course for its highest close since 1990. The index posted its eighth consecutive month of increase in August — the longest winning streak since 2013 — and the gauge was now set for the best weekly advance since October. Data earlier showed companies’ profits rose 11.6% on an annual basis in the second quarter.
Australia's ASX 200 declined further under 7,300 and was weighted by its metals names as Fortescue Metals slumped after its CFO left three days after the CEO's departure. Korea's KOSPI was underpinned by the South Korean trade data which printed better than feared.
Indian stocks posted their biggest advance in two months on Friday as metals and utilities led the rally across sectors after strong economic data boosted investor sentiment. The S&P BSE Sensex Index rose 0.9% to 65,387.16 in Mumbai, while the NSE Nifty 50 Index advanced by a similar measure as both gauges surged the most since June 30. The sharp move pushed the benchmarks by at least 0.7% higher for the week, snapping their retreat for preceding five weeks. Stocks in India have been receiving a chunk of foreign flows coming to emerging markets. For August, foreigners bought $1.6 billion of local shares while selling Taiwan, South Korea and Indonesia, and extending a selloff in China.
In FX, the Bloomberg Dollar Spot Index was little changed on Friday but down 0.2% this week, set to halt six straight weeks of gains after data showed the Federal Reserve’s preferred measure of underlying inflation posted the smallest back-to-back increases since late 2020. Focus now is on US payrolls data later on Friday, which is expected to show the US labor market likely cooled in August
Further dollar declines could be limited. “The path to more pronounced dollar depreciation — further moderation in the US economic data, including nonfarm payrolls report, combined with less negativity abroad — has been narrowing lately,” wrote Goldman Sachs strategist Karen Fishman, and since Goldman's sellside desk is always wrong, it means the dollar is about to crater.
- EUR/USD recouped some lost ground ahead of the key US data. The common currency fell yesterday after bearish comments from European Central Bank officials fueled concern the euro region may be heading for stagflation.
- USD/JPY little changed at 145.49. The pair recovered from an intraday low of 145.24 after Japanese Finance Minister Shunichi Suzuki said sudden moves in the foreign currency market aren’t desirable, and he will closely watch movements
- A 0.3% rise in the Aussie dollar on China’s FX RRR cut was reversed in part by leveraged selling shortly after by weak domestic home loan data. Move extended under weight of early London names selling to partially fill in option and exporter related bids under 0.6450 strikes, according to traders
In rates, treasuries were mixed in early US trading ahead of the August employment report, with the curve steeper. With Fed swaps pricing in about 50% odds of another rate hike this year, report is anticipated to show 170k nonfarm payrolls increase, smallest in more than two years; crowd-sourced whisper number is 155k. Yields remain within 2bp of Thursday’s closing levels; Thursday’s ranges included weekly lows for 10-year to 30-year tenors. 2s10s and 5s30s spreads are wider by 2bp-3bp, paced by curve-steepening in most euro-zone bond markets. The economic calendar also includes August final S&P Global US Manufacturing PMI at 9:45am, July construction spending and August ISM manufacturing at 10am and August vehicle sales throughout the day.
In commodities, oil is set for a weekly gain after Russia signaled that it would extend export curbs and US inventories dropped further. Gold headed for the second weekly advance.
Looking to the day ahead now, and the main highlight will be the US jobs report for August. Otherwise, we’ll get the global manufacturing PMIs for August and the ISM manufacturing reading from the US. From central banks, we’ll hear from the Fed’s Bostic and Mester.
Market Snapshot
- S&P 500 futures up 0.2% to 4,526.00
- MXAP up 0.4% to 162.78
- MXAPJ up 0.3% to 508.53
- Nikkei up 0.3% to 32,710.62
- Topix up 0.8% to 2,349.75
- Hang Seng Index down 0.5% to 18,382.06
- Shanghai Composite up 0.4% to 3,133.25
- Sensex up 0.8% to 65,348.50
- Australia S&P/ASX 200 down 0.4% to 7,278.30
- Kospi up 0.3% to 2,563.71
- STOXX Europe 600 up 0.2% to 459.33
- German 10Y yield little changed at 2.49%
- Euro little changed at $1.0852
- Brent Futures up 0.3% to $87.13/bbl
- Gold spot up 0.1% to $1,942.47
- US Dollar Index little changed at 103.57
Top Overnight News from Bloomberg
- Markets settled into a holding pattern ahead of Friday’s key US jobs data, with European stocks and American equity-index futures edging higher, Treasury yields flat and a gauge of the dollar steady.
- China intensified efforts to stimulate the economy and support its currency, as investor concerns over the growth outlook persist. The central bank will trim the amount of foreign currency deposits banks are required to hold as reserves for the first time this year, the People’s Bank of China said Friday.
- Dollar General Corp., already on track for its first annual share decline, fell again after cutting its profit forecast for the second straight quarter amid rising labor costs and “softer sales trends.”
- US and other Group of Seven nations increasingly see evidence of deep-seated structural problems in China that ultimately will strengthen the West’s hand against a weakening geopolitical competitor. The view emerging from officials in Washington, Rome, Tokyo and other capitals, who spoke with Bloomberg News mostly on condition of anonymity in recent days, is that the dominant economic narrative that has guided the flows of capital around the globe for decades is flipping fast.
A more detailed look at global markets courtesy of Newsquawk
APAC stocks traded mixed following a similar lead from Wall Street, whilst Hong Kong markets were closed due to Typhoon Saola. ASX 200 declined further under 7,300 and was weighted by its metals names as Fortescue Metals slumped after its CFO left three days after the CEO's departure. Nikkei 225 opened in the red but quickly trimmed losses with the rebound spearheaded by the energy sector. KOSPI was underpinned by the South Korean trade data which printed better than feared. Shanghai Comp opened firmer after large Chinese banks cut their deposit rates, while the PBoC also lowered down payment for first and second-time home buyers and announced a cut to the FX RRR. Modest upticks were seen after the Caixin PMI Finals were surprisingly revised into expansion territory.
Top Asian News
- PBoC is to cut FX RRR by 2ppts to 4% (prev. 6%) from September 15th, according to the central bank. China's Global Times, on the PBoC FX RRR cut, said "This move aims to enhance the ability of financial institutions to utilize foreign exchange capital."
- Several major Chinese banks lowered their deposit rates, including ICBC, China Construction Bank, Bank of Communications, and Bank of China.
- China's Shenzhen City will suspend work, businesses, transportation, and markets from Friday afternoon amid Typhoon Saola, according to the Shenzhen Government.
- PBoC sold CNY 101bln via 7-day reverse repos with the rate at 1.80% for a CNY 120bln net injection.
- China to take additional action to revive the property sector, via Reuters citing sources; incl. relaxing home purchase curbs and removing caps on new homes.
- Softbank's (9984 JT) Arm Holdings is expected to set a price range for its IPO next week, with plans to price its shares on September 13th and trading to start the following day, according to Reuters sources.
- Japanese Finance Minister Suzuki said FX moves should be set by the market and should reflect fundamentals; sudden FX moves are undesirable, according to Reuters.
European bourses are in the green, Euro Stoxx 50 +0.3%, as modest upside creeps in following a tentative/slightly subdued open with fundamentals light ahead of key US data. Sectors are primarily positive, Energy the clear outperformer after an MS upgrade and broader benchmark action while Autos lag following a negative Volkswagen broker move and as Tesla cuts prices in China for some models. Stateside, futures are in-fitting with Europe and are slightly firmer, ES +0.2%. with the tone equally as tentative before NFP & ISM Manufacturing.
Top European News
- ECB's de Guindos said the latest data from July and August point towards economic deceleration in Q3 and probably in Q4, and the ECB needs to keep working to bring inflation back to the 2% target. He said the latest data from inflation in August has been very similar to July, and the rate decision in September is still up for debate. He said data in the next few days is key to the September ECB decision, according to Reuters.
- ECB's Villeroy says after overall inflation peaked and underlying inflation has also peaked since April and appears to have begun its decline. This encouraging sign is still far from sufficient. Options are open at the next and upcoming meetings. Very close to a peak in rates, far from the point where we could consider cuts. Keeping rates high for long enough matters more than the level. Will slightly revise up France's 2023 GDP forecast.
- ECB's Vujcic says inflation data in August was in-line with expectations, economic activity is slowing faster than forecast. Will not know in September, October or November where the terminal is. Inflation will ease in the coming months but there is a risk that disinflation will stall above the target.
- BoE's Pill says BoE needs to be particularly wary about letting an inflation persistence dynamic to set in; we have not yet seen a downturn in core inflation which would reassure us.
FX
- Buck bounces from overnight lows, but is contained overall ahead of US payrolls, DXY sits within 103.480-770 range.
- Franc a tad firmer in line with Swiss YY CPI vs consensus, USD/CHF towards base of 0.8813-46 parameters.
- Euro, Pound, Yen and Loonie all rangy pre-NFP and Canadian GDP, EUR/USD around 1.0850 and surrounded by hefty expiries, Cable hovering below 1.2700, USD/JPY pivoting 145.00 and USD/CAD straddling 1.3500.
- Yuan underpinned by multiple factors including 200 bp RRR cut and surprise upgrade to Caixin Chinese manufacturing PMI to growth from contraction, USD/CNY close to 7.2450 and USD/CNH sub-7.2400 at one stage.
- PBoC set USD/CNY mid-point at 7.1788 vs exp. 7.2967 (prev. 7.1811)
Fixed Income
- Debt succumbs to some consolidation as the turn of the month comes with key US macro releases via NFP and the manufacturing ISM.
- Bunds, Gilts and T-note all in negative territory after Thursday's rallies and within 133.13-132.76, 95.49-14 and 110-31+/27 respective ranges.
Commodities
- Crude benchmarks are in the green but only modestly so and taking impetus from the USD rather than any specific crude driver with the overall tone tentative pre-NFP.
- Dutch TTF has pared back to near the unchanged mark after initial gains as Chevron workers rejected the first mediation package ahead of potential strikes on September 7th.
- Spot gold is at the top-end of parameters but as above this is relatively modest with specifics light while base metals have returned firmly to the green as China unveils further stimulus.
- Crude futures were on a slightly firmer footing and extended on the prior session’s gains, with Brent testing 87/bbl to the upside as it takes aim at the August high of USD 87.37/bbl.
- Spot gold saw an uptick as the DXY pulled back but price action remains within yesterday’s range and under USD 1,950/oz ahead of NFPs.
- Copper futures were lifted on the aforementioned China announcement, with 3M LME copper briefly topping USD 8,500/t to the upside.
- Chevron's (CVX) Australia LNG workers reject the Co's bargaining offer, according to unions; less than 1% of the Wheatstone and Gorgon downstream workforce voted in support of the offer, according to Reuters. Subsequently, sources report that CVX and unions will meet for talks next week.
- Russia introduced a 7% export duty on a number of fertilisers from September 1st, according to Interfax.
Geopolitics
- Japan imposed additional sanctions against North Korea, according to Reuters.
US Event Calendar
- 08:30: Aug. Change in Nonfarm Payrolls, est. 170,000, prior 187,000
- Change in Private Payrolls, est. 148,000, prior 172,000
- Change in Manufact. Payrolls, est. zero, prior -2,000
- 08:30: Aug. Average Hourly Earnings MoM, est. 0.3%, prior 0.4%
- Average Hourly Earnings YoY, est. 4.3%, prior 4.4%
- Average Weekly Hours All Emplo, est. 34.3, prior 34.3
- 08:30: Aug. Unemployment Rate, est. 3.5%, prior 3.5%
- Underemployment Rate, prior 6.7%
- Labor Force Participation Rate, est. 62.6%, prior 62.6%
- 09:45: Aug. S&P Global US Manufacturing PM, est. 47.0, prior 47.0
- 10:00: July Construction Spending MoM, est. 0.5%, prior 0.5%
- 10:00: Aug. ISM Manufacturing, est. 47.0, prior 46.4
Central Bank Speakers
- 06:00: FEd’s Bostic Speaks on US Monetary Policy
- 09:45: Fed’s Mester Speaks on Inflation
DB's Jim Reid concludes the overnight wrap
Welcome to September and to an early month payrolls Friday. Spare a thought for me this weekend as I’ll be refereeing 40 plus over excited 6 year olds playing Laser Quest as our twins have their birthday party on Sunday. My advice to all the graduates just joining the industry and reading this is to have your kids young while you have lots of energy. Then when you get to my age you can have easy paced relaxing weekends rather than the ones I have. I'm going to be especially exhausted by Monday.
Since it’s the start of the month, we’ll shortly be releasing our monthly performance review for August, which has been a pretty challenging one for financial markets albeit one where markets had a much better last week or so. In the month we had a further softening in the economic data, particularly in Europe and China, which has led to growing concern about the near-term outlook. At the same time, there’s been rising speculation that interest rates are set to remain higher for longer, and earlier in the month we even saw the 10yr Treasury yield hit a post-GFC high after both a US government debt downgrade and a much higher Treasury issuance profile announced than expected. So a lot going on in a holiday heavy month. See the full report in your inboxes shortly.
August might not have been a great month overall, but since Jackson Hole last week, we’ve actually had a decent market rally though one that lost a little momentum in the last 24 hours. Yesterday saw the S&P 500 (-0.16%) end a four-day winning streak after a sell off late in the US session, whilst the 10yr Treasury yield (-0.7bps) retreated for a 5th day running. Fresh China stimulus overnight (more below) has restored a little momentum as we start September.
For much of the final day of the month yesterday, markets were supported by the data alongside several central bank speakers who sounded cautious about further rate hikes. For instance in the US, the weekly initial jobless claims fell back to 228k over the week ending August 26 (vs. 235k expected), which is their third consecutive decline. Furthermore, the PCE inflation numbers for July were also in decent shape, and that’s the number the Fed officially targets. The important takeaway was that the year-on-year number for core PCE only rose a tenth to 4.2%, which is beneath the 4.3% estimate that Chair Powell cited in his speech last week. So things are running a bit better than the Fed was expecting even a week ago. Slightly concerningly, the supercore services measure often referred to by the Fed was up a strong +0.45% on the month. But more encouragingly, our US economists noted that the 1-month annualised rate of trimmed mean PCE was only +2.4%, its lowest since spring 2021. So take your pick.
In conjunction with the inflation data, we had several remarks from central bank officials that added to hopes they might be done with their rate hikes. That included Atlanta Fed President Bostic, who said that “I feel policy is appropriately restrictive”, and that “we should be cautious and patient and let the restrictive policy continue to influence the economy, lest we risk tightening too much and inflicting unnecessary economic pain.” Meanwhile at the ECB, Isabel Schnabel of the Executive Board said that recent developments “point to growth prospects being weaker than foreseen in the baseline scenario” in the June projections. She also said that whilst further rate hikes could be warranted, there was also an acknowledgement that “should our assessment of the transmission of monetary policy suggest that the pace of disinflation is proceeding as desired, we may afford to wait until our next meeting”. We also got the accounts of the ECB’s July meeting, which showed a moderation of the ECB’s hawkish bias. See our European economists’ reaction note here.
When it comes to the ECB’s decision in a couple of weeks, yesterday brought another piece of the jigsaw with the flash CPI print for August. That showed headline inflation remaining at +5.3%, whilst core inflation fell back two-tenths to +5.3%. While the core print was in line with consensus, our economists note that the underlying momentum was more encouraging, with services inflation easing slightly despite upside in volatile package holidays. The global trend, the inflation data, and the Schnabel remarks helped dial back the chances of a rate hike in September, with market pricing moving from a 55% chance at the previous close, down to 40% immediately prior to the CPI print (after Schnabel’s comments) and to 24% by the close. That’s the lowest chance the market has given a September hike since May, so as it stands we’re getting to the point where it would actively be a surprise if the ECB didn’t pause. In turn, those expectations of a pause led to a significant rally among European sovereign bonds, with yields on 10yr bunds (-8.1bps), OATs (-8.3bps) and BTPs (-7.7bps) seeing big declines.
Looking forward, we’ve got a couple of important releases today that might give us extra clues on the hard vs soft landing debate. The most important will be the US jobs report for August, which is out at 13:30 London time. Our US economists expect nonfarm payrolls growth to slow to +150k (consensus at +170k). That would be the slowest print since December 2020, and they see that causing the unemployment rate to move up a tenth to 3.6%. The other release of note will be the ISM manufacturing, which has now been in contractionary territory for 9 months in a row.
With another round of data to look forward to, US equities were in something of a holding pattern. Having started the day up by nearly +0.4% in the morning, the S&P 500 ended up closing -0.16% down after a late sell-off. Healthcare services (-2.65%) and banks (-0.73%) were among the underperformers. Meanwhile, tech stocks outperformed, with the NASDAQ (+0.11%) hitting a 4-week high as it eked out a fifth consecutive gain. Over in Europe, equities saw a subdued performance, with the STOXX 600 down -0.20%.
Asian equity markets are trading higher this morning as China ramped up its efforts to support the economy after the People’s Bank of China (PBOC) reduced the amount of foreign exchange that financial institutions must hold as reserves for the first time this year. Starting from September 15, the central bank will lower the forex reserve ratio to 4% from the current level of 6%, a move aimed at reining in yuan weakness. The offshore yuan did spike +0.5% on the news but has settled only +0.1% higher as we type. Additionally, China’s Caixin manufacturing PMI rose to 51.0 in August, the highest reading since February compared to a level of 49.2 in July.
In terms of equity market moves, the Nikkei (+0.53%) is leading gains overnight, while the CSI (+0.51%), the Shanghai Composite (+0.25%), and the KOSPI (+0.17%) are also trading in positive territory. Elsewhere, trading in Hong Kong has been suspended for today as the city is bracing itself for super Typhoon Saola. S&P 500 (+0.10%) and NASDAQ 100 (+0.07%) futures are trading slightly higher.
Looking back at yesterday’s other data, there was a decent +0.8% jump in US personal spending in July (vs. +0.7% expected) supporting the evidence of strong start to the quarter. However, the savings rate fell back to an 8-month low of 3.5% and incomes were a tenth below expectations at +0.2%. Otherwise, the MNI Chicago PMI for August rose to a one-year high of 48.7 (vs. 44.2 expected) and 42.8 last month. Earlier in the day, German retail sales for July disappointed (-0.8% vs +0.3% expected) in a latest sign of growth struggles for Europe’s largest economy.
To the day ahead now, and the main highlight will be the US jobs report for August. Otherwise, we’ll get the global manufacturing PMIs for August and the ISM manufacturing reading from the US. From central banks, we’ll hear from the Fed’s Bostic and Mester.
Uncategorized
Mortgage rates fall as labor market normalizes
Jobless claims show an expanding economy. We will only be in a recession once jobless claims exceed 323,000 on a four-week moving average.
Share this:


Everyone was waiting to see if this week’s jobs report would send mortgage rates higher, which is what happened last month. Instead, the 10-year yield had a muted response after the headline number beat estimates, but we have negative job revisions from previous months. The Federal Reserve’s fear of wage growth spiraling out of control hasn’t materialized for over two years now and the unemployment rate ticked up to 3.9%. For now, we can say the labor market isn’t tight anymore, but it’s also not breaking.
The key labor data line in this expansion is the weekly jobless claims report. Jobless claims show an expanding economy that has not lost jobs yet. We will only be in a recession once jobless claims exceed 323,000 on a four-week moving average.
From the Fed: In the week ended March 2, initial claims for unemployment insurance benefits were flat, at 217,000. The four-week moving average declined slightly by 750, to 212,250
Below is an explanation of how we got here with the labor market, which all started during COVID-19.
1. I wrote the COVID-19 recovery model on April 7, 2020, and retired it on Dec. 9, 2020. By that time, the upfront recovery phase was done, and I needed to model out when we would get the jobs lost back.
2. Early in the labor market recovery, when we saw weaker job reports, I doubled and tripled down on my assertion that job openings would get to 10 million in this recovery. Job openings rose as high as to 12 million and are currently over 9 million. Even with the massive miss on a job report in May 2021, I didn’t waver.
Currently, the jobs openings, quit percentage and hires data are below pre-COVID-19 levels, which means the labor market isn’t as tight as it once was, and this is why the employment cost index has been slowing data to move along the quits percentage.

3. I wrote that we should get back all the jobs lost to COVID-19 by September of 2022. At the time this would be a speedy labor market recovery, and it happened on schedule, too
Total employment data
4. This is the key one for right now: If COVID-19 hadn’t happened, we would have between 157 million and 159 million jobs today, which would have been in line with the job growth rate in February 2020. Today, we are at 157,808,000. This is important because job growth should be cooling down now. We are more in line with where the labor market should be when averaging 140K-165K monthly. So for now, the fact that we aren’t trending between 140K-165K means we still have a bit more recovery kick left before we get down to those levels.

From BLS: Total nonfarm payroll employment rose by 275,000 in February, and the unemployment rate increased to 3.9 percent, the U.S. Bureau of Labor Statistics reported today. Job gains occurred in health care, in government, in food services and drinking places, in social assistance, and in transportation and warehousing.
Here are the jobs that were created and lost in the previous month:

In this jobs report, the unemployment rate for education levels looks like this:
- Less than a high school diploma: 6.1%
- High school graduate and no college: 4.2%
- Some college or associate degree: 3.1%
- Bachelor’s degree or higher: 2.2%

Today’s report has continued the trend of the labor data beating my expectations, only because I am looking for the jobs data to slow down to a level of 140K-165K, which hasn’t happened yet. I wouldn’t categorize the labor market as being tight anymore because of the quits ratio and the hires data in the job openings report. This also shows itself in the employment cost index as well. These are key data lines for the Fed and the reason we are going to see three rate cuts this year.
recession unemployment covid-19 fed federal reserve mortgage rates recession recovery unemploymentUncategorized
Inside The Most Ridiculous Jobs Report In History: Record 1.2 Million Immigrant Jobs Added In One Month
Inside The Most Ridiculous Jobs Report In History: Record 1.2 Million Immigrant Jobs Added In One Month
Last month we though that the January…
Share this:


Last month we though that the January jobs report was the "most ridiculous in recent history" but, boy, were we wrong because this morning the Biden department of goalseeked propaganda (aka BLS) published the February jobs report, and holy crap was that something else. Even Goebbels would blush.
What happened? Let's take a closer look.
On the surface, it was (almost) another blockbuster jobs report, certainly one which nobody expected, or rather just one bank out of 76 expected. Starting at the top, the BLS reported that in February the US unexpectedly added 275K jobs, with just one research analyst (from Dai-Ichi Research) expecting a higher number.
Some context: after last month's record 4-sigma beat, today's print was "only" 3 sigma higher than estimates. Needless to say, two multiple sigma beats in a row used to only happen in the USSR... and now in the US, apparently.

Before we go any further, a quick note on what last month we said was "the most ridiculous jobs report in recent history": it appears the BLS read our comments and decided to stop beclowing itself. It did that by slashing last month's ridiculous print by over a third, and revising what was originally reported as a massive 353K beat to just 229K, a 124K revision, which was the biggest one-month negative revision in two years!

Of course, that does not mean that this month's jobs print won't be revised lower: it will be, and not just that month but every other month until the November election because that's the only tool left in the Biden admin's box: pretend the economic and jobs are strong, then revise them sharply lower the next month, something we pointed out first last summer and which has not failed to disappoint once.
In the past month the Biden department of goalseeking stuff higher before revising it lower, has revised the following data sharply lower:
— zerohedge (@zerohedge) August 30, 2023
- Jobs
- JOLTS
- New Home sales
- Housing Starts and Permits
- Industrial Production
- PCE and core PCE
To be fair, not every aspect of the jobs report was stellar (after all, the BLS had to give it some vague credibility). Take the unemployment rate, after flatlining between 3.4% and 3.8% for two years - and thus denying expectations from Sahm's Rule that a recession may have already started - in February the unemployment rate unexpectedly jumped to 3.9%, the highest since February 2022 (with Black unemployment spiking by 0.3% to 5.6%, an indicator which the Biden admin will quickly slam as widespread economic racism or something).

And then there were average hourly earnings, which after surging 0.6% MoM in January (since revised to 0.5%) and spooking markets that wage growth is so hot, the Fed will have no choice but to delay cuts, in February the number tumbled to just 0.1%, the lowest in two years...

... for one simple reason: last month's average wage surge had nothing to do with actual wages, and everything to do with the BLS estimate of hours worked (which is the denominator in the average wage calculation) which last month tumbled to just 34.1 (we were led to believe) the lowest since the covid pandemic...

... but has since been revised higher while the February print rose even more, to 34.3, hence why the latest average wage data was once again a product not of wages going up, but of how long Americans worked in any weekly period, in this case higher from 34.1 to 34.3, an increase which has a major impact on the average calculation.

While the above data points were examples of some latent weakness in the latest report, perhaps meant to give it a sheen of veracity, it was everything else in the report that was a problem starting with the BLS's latest choice of seasonal adjustments (after last month's wholesale revision), which have gone from merely laughable to full clownshow, as the following comparison between the monthly change in BLS and ADP payrolls shows. The trend is clear: the Biden admin numbers are now clearly rising even as the impartial ADP (which directly logs employment numbers at the company level and is far more accurate), shows an accelerating slowdown.

But it's more than just the Biden admin hanging its "success" on seasonal adjustments: when one digs deeper inside the jobs report, all sorts of ugly things emerge... such as the growing unprecedented divergence between the Establishment (payrolls) survey and much more accurate Household (actual employment) survey. To wit, while in January the BLS claims 275K payrolls were added, the Household survey found that the number of actually employed workers dropped for the third straight month (and 4 in the past 5), this time by 184K (from 161.152K to 160.968K).

This means that while the Payrolls series hits new all time highs every month since December 2020 (when according to the BLS the US had its last month of payrolls losses), the level of Employment has not budged in the past year. Worse, as shown in the chart below, such a gaping divergence has opened between the two series in the past 4 years, that the number of Employed workers would need to soar by 9 million (!) to catch up to what Payrolls claims is the employment situation.

There's more: shifting from a quantitative to a qualitative assessment, reveals just how ugly the composition of "new jobs" has been. Consider this: the BLS reports that in February 2024, the US had 132.9 million full-time jobs and 27.9 million part-time jobs. Well, that's great... until you look back one year and find that in February 2023 the US had 133.2 million full-time jobs, or more than it does one year later! And yes, all the job growth since then has been in part-time jobs, which have increased by 921K since February 2023 (from 27.020 million to 27.941 million).

Here is a summary of the labor composition in the past year: all the new jobs have been part-time jobs!

But wait there's even more, because now that the primary season is over and we enter the heart of election season and political talking points will be thrown around left and right, especially in the context of the immigration crisis created intentionally by the Biden administration which is hoping to import millions of new Democratic voters (maybe the US can hold the presidential election in Honduras or Guatemala, after all it is their citizens that will be illegally casting the key votes in November), what we find is that in February, the number of native-born workers tumbled again, sliding by a massive 560K to just 129.807 million. Add to this the December data, and we get a near-record 2.4 million plunge in native-born workers in just the past 3 months (only the covid crash was worse)!

The offset? A record 1.2 million foreign-born (read immigrants, both legal and illegal but mostly illegal) workers added in February!

Said otherwise, not only has all job creation in the past 6 years has been exclusively for foreign-born workers...

... but there has been zero job-creation for native born workers since June 2018!

This is a huge issue - especially at a time of an illegal alien flood at the southwest border...

... and is about to become a huge political scandal, because once the inevitable recession finally hits, there will be millions of furious unemployed Americans demanding a more accurate explanation for what happened - i.e., the illegal immigration floodgates that were opened by the Biden admin.
Which is also why Biden's handlers will do everything in their power to insure there is no official recession before November... and why after the election is over, all economic hell will finally break loose. Until then, however, expect the jobs numbers to get even more ridiculous.
Uncategorized
Economic Earthquake Ahead? The Cracks Are Spreading Fast
Economic Earthquake Ahead? The Cracks Are Spreading Fast
Authored by Brandon Smith via Alt-Market.us,
One of my favorite false narratives…
Share this:


Authored by Brandon Smith via Alt-Market.us,
One of my favorite false narratives floating around corporate media platforms has been the argument that the American people “just don’t seem to understand how good the economy really is right now.” If only they would look at the stats, they would realize that we are in the middle of a financial renaissance, right? It must be that people have been brainwashed by negative press from conservative sources…
I have to laugh at this notion because it’s a very common one throughout history – it’s an assertion made by almost every single political regime right before a major collapse. These people always say the same things, and when you study economics as long as I have you can’t help but throw up your hands and marvel at their dedication to the propaganda.
One example that comes to mind immediately is the delusional optimism of the “roaring” 1920s and the lead up to the Great Depression. At the time around 60% of the U.S. population was living in poverty conditions (according to the metrics of the decade) earning less than $2000 a year. However, in the years after WWI ravaged Europe, America’s economic power was considered unrivaled.
The 1920s was an era of mass production and rampant consumerism but it was all fueled by easy access to debt, a condition which had not really existed before in America. It was this illusion of prosperity created by the unchecked application of credit that eventually led to the massive stock market bubble and the crash of 1929. This implosion, along with the Federal Reserve’s policy of raising interest rates into economic weakness, created a black hole in the U.S. financial system for over a decade.
There are two primary tools that various failing regimes will often use to distort the true conditions of the economy: Debt and inflation. In the case of America today, we are experiencing BOTH problems simultaneously and this has made certain economic indicators appear healthy when they are, in fact, highly unstable. The average American knows this is the case because they see the effects everyday. They see the damage to their wallets, to their buying power, in the jobs market and in their quality of life. This is why public faith in the economy has been stuck in the dregs since 2021.
The establishment can flash out-of-context stats in people’s faces, but they can’t force the populace to see a recovery that simply does not exist. Let’s go through a short list of the most faulty indicators and the real reasons why the fiscal picture is not a rosy as the media would like us to believe…
The “miracle” labor market recovery
In the case of the U.S. labor market, we have a clear example of distortion through inflation. The $8 trillion+ dropped on the economy in the first 18 months of the pandemic response sent the system over the edge into stagflation land. Helicopter money has a habit of doing two things very well: Blowing up a bubble in stock markets and blowing up a bubble in retail. Hence, the massive rush by Americans to go out and buy, followed by the sudden labor shortage and the race to hire (mostly for low wage part-time jobs).
The problem with this “miracle” is that inflation leads to price explosions, which we have already experienced. The average American is spending around 30% more for goods, services and housing compared to what they were spending in 2020. This is what happens when you have too much money chasing too few goods and limited production.
The jobs market looks great on paper, but the majority of jobs generated in the past few years are jobs that returned after the covid lockdowns ended. The rest are jobs created through monetary stimulus and the artificial retail rush. Part time low wage service sector jobs are not going to keep the country rolling for very long in a stagflation environment. The question is, what happens now that the stimulus punch bowl has been removed?
Just as we witnessed in the 1920s, Americans have turned to debt to make up for higher prices and stagnant wages by maxing out their credit cards. With the central bank keeping interest rates high, the credit safety net will soon falter. This condition also goes for businesses; the same businesses that will jump headlong into mass layoffs when they realize the party is over. It happened during the Great Depression and it will happen again today.
Cracks in the foundation
We saw cracks in the narrative of the financial structure in 2023 with the banking crisis, and without the Federal Reserve backstop policy many more small and medium banks would have dropped dead. The weakness of U.S. banks is offset by the relative strength of the U.S. dollar, which lures in foreign investors hoping to protect their wealth using dollar denominated assets.
But something is amiss. Gold and bitcoin have rocketed higher along with economically sensitive assets and the dollar. This is the opposite of what’s supposed to happen. Gold and BTC are supposed to be hedges against a weak dollar and a weak economy, right? If global faith in the dollar and in the U.S. economy is so high, why are investors diving into protective assets like gold?
Again, as noted above, inflation distorts everything.
Tens of trillions of extra dollars printed by the Fed are floating around and it’s no surprise that much of that cash is flooding into the economy which simply pushes higher right along with prices on the shelf. But, gold and bitcoin are telling us a more honest story about what’s really happening.
Right now, the U.S. government is adding around $600 billion per month to the national debt as the Fed holds rates higher to fight inflation. This debt is going to crush America’s financial standing for global investors who will eventually ask HOW the U.S. is going to handle that growing millstone? As I predicted years ago, the Fed has created a perfect Catch-22 scenario in which the U.S. must either return to rampant inflation, or, face a debt crisis. In either case, U.S. dollar-denominated assets will lose their appeal and their prices will plummet.
“Healthy” GDP is a complete farce
GDP is the most common out-of-context stat used by governments to convince the citizenry that all is well. It is yet another stat that is entirely manipulated by inflation. It is also manipulated by the way in which modern governments define “economic activity.”
GDP is primarily driven by spending. Meaning, the higher inflation goes, the higher prices go, and the higher GDP climbs (to a point). Eventually prices go too high, credit cards tap out and spending ceases. But, for a short time inflation makes GDP (as well as retail sales) look good.
Another factor that creates a bubble is the fact that government spending is actually included in the calculation of GDP. That’s right, every dollar of your tax money that the government wastes helps the establishment by propping up GDP numbers. This is why government spending increases will never stop – It’s too valuable for them to spend as a way to make the economy appear healthier than it is.
The REAL economy is eclipsing the fake economy
The bottom line is that Americans used to be able to ignore the warning signs because their bank accounts were not being directly affected. This is over. Now, every person in the country is dealing with a massive decline in buying power and higher prices across the board on everything – from food and fuel to housing and financial assets alike. Even the wealthy are seeing a compression to their profit and many are struggling to keep their businesses in the black.
The unfortunate truth is that the elections of 2024 will probably be the turning point at which the whole edifice comes tumbling down. Even if the public votes for change, the system is already broken and cannot be repaired without a complete overhaul.
We have consistently avoided taking our medicine and our disease has gotten worse and worse.
People have lost faith in the economy because they have not faced this kind of uncertainty since the 1930s. Even the stagflation crisis of the 1970s will likely pale in comparison to what is about to happen. On the bright side, at least a large number of Americans are aware of the threat, as opposed to the 1920s when the vast majority of people were utterly conned by the government, the banks and the media into thinking all was well. Knowing is the first step to preparing.
The second step is securing your own financial future – that’s where physical precious metals can play a role. Diversifying your savings with inflation-resistant, uninflatable assets whose intrinsic value doesn’t rely on a counterparty’s promise to pay adds resilience to your savings. That’s the main reason physical gold and silver have been the safe haven store-of-value assets of choice for centuries (among both the elite and the everyday citizen).
* * *
As the world moves away from dollars and toward Central Bank Digital Currencies (CBDCs), is your 401(k) or IRA really safe? A smart and conservative move is to diversify into a physical gold IRA. That way your savings will be in something solid and enduring. Get your FREE info kit on Gold IRAs from Birch Gold Group. No strings attached, just peace of mind. Click here to secure your future today.


Wendy’s has a new deal for daylight savings time haters


Watch Live: President Biden Reminds Americans Just How Good They’ve Got It Thanks To Him


Watch: President Biden Delivers The “Darkest, Most Un-American Speech Given By A President”


These Are The 5 Charts The FDIC Does Not Want You Paying Attention To


Interest rates, the best it gets. It’s time to deploy cash


Is the biotech market rally real? Data suggest comeback in private, public markets


Mortgage rates fall as labor market normalizes


People Who Received Ivermectin Were Better Off, Study Finds


Stock Market’s Top Will Outlast Your Disbelief


COVID-19 May Lead To Persistent Cognitive Impairment, Brain Fog, And Lower IQ Scores
-

 Uncategorized2 weeks ago
All Of The Elements Are In Place For An Economic Crisis Of Staggering Proportions
-

 Uncategorized1 month ago
Cathie Wood sells a major tech stock (again)
-

 Uncategorized3 weeks ago
California Counties Could Be Forced To Pay $300 Million To Cover COVID-Era Program
-

 Uncategorized2 weeks ago
Apparel Retailer Express Moving Toward Bankruptcy
-

 Uncategorized3 weeks ago
Industrial Production Decreased 0.1% in January
-

 International18 hours ago
Walmart launches clever answer to Target’s new membership program
-

 Uncategorized3 weeks ago
RFK Jr: The Wuhan Cover-Up & The Rise Of The Biowarfare-Industrial Complex
-

 Uncategorized3 weeks ago
GOP Efforts To Shore Up Election Security In Swing States Face Challenges