Uncategorized
Futures Rebound After BOJ YCC “Tweak” Turns Out To Be Less Hawkish Than Some Feared
Futures Rebound After BOJ YCC "Tweak" Turns Out To Be Less Hawkish Than Some Feared
US equity futures reversed an earlier loss and traded…
Share this:


US equity futures reversed an earlier loss and traded at session highs even as bonds around the world fell, briefly sending the 10Y Treasury to 4.04% and JGBs to 0.57%, well above the previous 0.5% cap and the highest since 2014, after the Bank of Japan - the only major central bank not to have begun reversing ultra-easy monetary policy - surprised investors by tweaking its control of market rates, in a market test to how far it can go without explicitly starting normalization. But in the end, the tweak ended up being less hawkish than some feared and as a result, futures are now reversing much of yesterday's sharpo losses.
Having previously capped bond yields at 0.5% in a bid to stoke borrowing and its economy, the central bank said today it now regarded that level as a reference point rather than a rigid limit, and instead of intervening to keep rates capped at 0.5% it would only do so firmly at 1.0%, while deciding whether and where to intervene in the 0.5% to 1.0% band (the BOJ graphic explaining the change is below).
The BOJ pledged to show more flexibility over its yield curve control policy, though governor Kazuo Ueda insisted the bank was still far from the point where it could raise rates, and by then global deflation will have returned anyway.
In stock markets, the busiest week in the earnings calendar was drawing to a close, with sentiment supported by forecast-beating results and conviction that interest rates in the US and euro zone are near their peak. As of 7:30am ET, S&P futures traded 0.5% higher, reversing some of yesterday dump which was sparked, ironically, by a planted story in the Nikkei previewing the BOJ's action, which however turned out to be less hawkish than expected, and thus the equity market overreacted on Thursday, and rebounded today as 10Y yields traded down to 3.96% after rising as high as 4.04%

In premarket trading, Enphase Energy shares plunged 15% after the solar-equipment manufacturer reported second-quarter revenue that missed estimates. Analysts found the results to be disappointing, and noted that the third-quarter revenue outlook also failed to meet expectations. On the other end, First Solar shares jumped as much as 9% after the solar technology company results beat estimates and announced plans for a new manufacturing facility in the US, which analysts took as a sign of confidence in demand. Brokers also highlighted strong bookings and average selling prices. Here are some other notable premarket mover:
Ford shares drop 2% after the automaker said it now expects to see losses from electric vehicles hit $4.5 billion this year. While Ford’s other segments performed well, Morgan Stanley sees major changes to the EV strategy possibly being necessary.
- Homology Medicines shares surge 17% after the biotech said it will evaluate strategic alternatives and cut 87% of its workforce, citing the current financing environment and Homology’s anticipated clinical development timelines. RBC said that the decision to preserve cash was “pragmatic.”
- Intel shares are rise as much as 8% in premarket trading on Friday after the chipmaker reported second-quarter results that beat expectations as its PC business was starting to recover. The company’s CEO says Intel remains on track to meet its of target of regaining manufacturing leadership by 2025.
- Roku shares rise nearly 10% after the streaming-video platform company reported second-quarter revenue that was much stronger than expected. While analysts were positive about the results, they warned that Hollywood strikes would turn into a headwind if they prolong.
- Solar stocks fell in US premarket trading after Enphase Energy reported second-quarter revenue that missed the average analyst estimate, and gave lower-than-anticipated third-quarter revenue guidance.
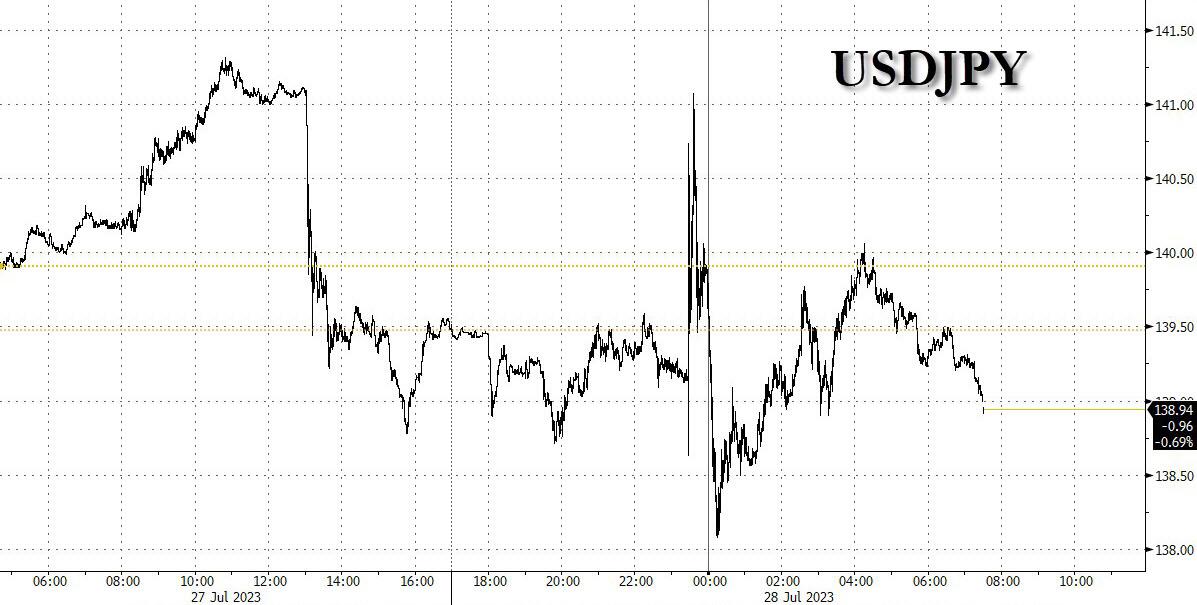
The BOJ move also sparked speculation it marked the first step towards the end of extraordinary stimulus after the recent surge in inflation. It also triggered big swings in the yen, sending it as much as 1% lower and higher at one point against the dollar, before trading largely unchanged compared to the pre-BOJ announcement. Despite the rollercoaster move, the yen was still headed for its best month since March, with gains of almost 3.5%.
“The BOJ decision is an invitation to short dollar-yen,” said Kenneth Broux, currency strategist at Societe Generale SA. “Higher Japanese yields reduce the spread versus US Treasuries and German bunds.” He added however that dollar downside could be limited, given Thursday’s strong US data that could imply further Fed tightening; furthermore sticky rate differentials mean that those who are stuck in a short USDJPY will suffer brutal bleeding thanks to the 5.50% difference between the BOJ and the Fed, a difference which will remain for a long time.
Markets elsewhere reacted to the possibility that higher yields at home will persuade Japanese investors, who own sizable amounts of US, European and Australian bonds, to reduce overseas debt holdings. As noted above, US Treasury yields rocked as high as 4.04% - first after a Nikkei news report that Japan was poised to tweak its yield-curve control policy, and then after the BOJ indeed tweaked it - but then yields dipped back down to 3.96% after markets digested the announcement realizing that it is not as hawkish as some had feared.

Elsewhere, the German 10Y Bund increased as much as 5 basis points, and Australia’s climbed 20 basis points at one point.
"This is a big week as it signals we are pretty much at the end of hiking cycles globally,” said Peter Kinsella, head of currency strategy at asset manager Union Bancaire Privee UBP SA. The “BOJ is effectively saying the top of the yield range is now 1% so that implies 50 basis points in potential steepening. So it’s slow gradual normalization, but yes, it’s normalization BOJ style,” he added.
European stocks are in the red with technology leading declines while banks rise. While the Stoxx 600 is down 0.3%, European bourses were still set for their third straight weekly gain. Here are the most notable European movers:
- AstraZeneca gains as much as 4.8% after reporting second-quarter sales and profit that beat estimates and announcing the $1 billion acquisition of a portfolio of rare disease gene therapies from Pfizer
- Hermes shares jumped as much as 4.3% after the French luxury group outperformed its rivals during the second quarter with unabated demand for its high-end purses, notably in the US and China
- Standard Chartered shares rise as much as 6.7% in London, the most since March, after the bank reported better-than-expected pretax profit for the second quarter
- Eni shares rise as much as 1.8% after the Italian oil and gas giant’s second-quarter profit beat consensus estimates, with the analysts flagging a strong performance at its Global Gas & Lng Portfolio (GGP) unit
- Euronext shares jump as much as 7.1%, most since March, after the exchange operator reported revenue for the second quarter that beat the average analyst estimate and announced a €200m buyback
- Ams-OSRAM shares rally as much as 19%, their biggest one-day climb since 2020. The company says it will exit non-core and lower-performing semiconductor businesses, a move that analysts say will help facilitate a turnaround and its debt refinancing
- Sanofi falls as much as 4.1%, the most since May 30, after the French drugmaker reported its latest earnings, which analysts say is a mixed bag, as overall sales missed slightly and growth for its key drug Dupixent only arrived in line
- Air France-KLM shares fall as much as 6% after analysts noted headwinds including elusive profit guidance and a higher unit-cost forecast, even as the company posted a strong 2Q operating income beat
- Signify shares fell as much as 5.1%, the biggest drop since May 18, after the lighting maker cut its adjusted Ebita margin forecast for the full year and reported revenue for the second quarter that missed the average analyst estimate
- Atos shares sink as much as 20% after the French IT firm recorded a negative free cash flow of €969m in the first half, a figure that is well below analyst estimates and is about three quarters of the stock’s market value
- Vanquis Banking shares slumped as much as 29% to their lowest level in over 30 years, after the specialist lender reported a loss and a decrease in its net interest margin
- Evotec falls as much as 11%, the most since November, after the German biotech cut its full-year forecast as the effects from the cyberattack earlier this year continues to impact the firm’s earnings
Earlier in the session, Asia’s equity benchmark held steady as a rally in Chinese stocks was offset by losses in Japan, where the central bank jolted markets by loosening its grip on bond yields. The MSCI Asia Pacific Index was little changed on Friday, but headed for a 2% weekly gain as Chinese shares extended this week’s rally on emerging signs that Beijing is acting on its policy pledges. Meanwhile, the Nikkei 225 slid as much as 2.6%, the worst performance in Asia, on concern the Bank of Japan’s adjustment paves the way for a stronger currency, potentially hurting exporters, however the Nikkei eventually rallied sharply, closing down just 0.4% led by Japan's lenders who rallied on optimism their profitability will improve.

Regional stocks have climbed this week on hopes of stimulus measures in China following the Politburo meeting. A gauge of the nation’s equities listed in Hong Kong jumped as much as 1.7% on Friday after regulators were said to have signaled additional support for the technology sector and on speculation that authorities may lower stamp duties to bolster trading. Tencent and Meituan were among the top positive contributors in the MSCI Asia gauge, while Japan’s Sony and Toyota Motor were among the biggest drags.
Asia’s stock benchmark climbed for a fourth straight day on Thursday after the US central bank raised interest rates to a 22-year high and said further tightening would be data dependent. The gauge is approaching this year’s high seen in January though its gain of 9% so far in 2023 compares poorly with the S&P 500 Index’s 18% advance. Optimism over earnings, gains in China and rising speculation that the Federal Reserve is nearing the end of its policy tightening have boosted sentiment toward Asia’s emerging-market equities in recent weeks.
The MSCI Asia gauge is on track for a second straight month of gains, with its 3.7% rally in July set to be the best since January. An index of Southeast Asian stocks has jumped close to 6% this month, heading for the best performance since November. “There is enormous potential for emerging-market equities to play catch up on emerging market debt in a world where the Fed stops tightening and the dollar weakens,” Christopher Wood, global head of equity strategy at Jefferies, wrote in a note.
Australia's ASX 200 was pressured amid weakness in the property sector and miners, with sentiment also not helped by the surprise contraction in Retail Sales
The record-breaking India stock market ended the week among the worst performing markets in the region as sentiment was hit by weaker-than-expected earnings from some index heavyweights. The S&P BSE Sensex fell 0.2% on Friday to 66,160.20 in Mumbai, while the NSE Nifty 50 Index was little changed at 19,646.05. The MSCI Asia Pacific Index was up 0.5% for the day. For the week, benchmark indexes lost 0.8% as compared to the regional benchmark’s 2.6% gains. Indian equities underperformed their peers in China, Hong Kong and Taiwan. The losses in the benchmarks during the week were limited by continued net buying of stocks by global funds, who look set to mark their fifth consecutive month of net purchases in July. Global funds have net bought over $19 billion since end of February. HDFC Bank contributed the most to the Sensex’s decline, decreasing 1.7%. Out of 31 shares in the Sensex index, 15 rose and 15 fell, while 1 was unchanged
In FX, the Bloomberg Dollar Spot Index slipped, while Treasury yields fell led by the short-end of the curve. USD/JPY fell more than 1% after the BOJ decision before gaining by a similar amount. It was down 0.1% at 139.30 at 10:30 a.m. London. Dollar sell-stops are building below 137.25, the July 14 low and buy stops above 142, according to Asia-based FX traders. European short-end bonds gained following dovish comments by ECB policymakers; Money markets ease ECB tightening wagers for a second day.
In rates, treasuries held gains in early US trading, led by the short end, steepening the curve. Curves are steeper globally led by UK and Japan, where 10-year yields jumped to highest level in nearly a decade after BOJ effectively adopted a higher target, a move previewed during US trading hours Thursday. US yields lower across the curve by as much as 5bp-6bp at short end with long end little changed; however 30-year earlier climbed to within 0.1bp of its July 10 YTD high 4.082%.
Yields remain higher on the week with the curve steeper, as focus began shifting from Fed policy stance — which Chair Powell this week said was evenhanded with respect to another interest-rate hike in September — to strong economic growth indicators and expectations that Treasury auction size increases will be announced next week for the August-to-October financing period. Also ahead next week, month-end Treasury index rebalancing is projected to extend its duration by 0.07 year, and first major economic indicators for July including ISM manufacturing and services gauges and employment report are slated.
In commodities, crude futures decline with WTi falling 0.3%. Spot gold adds 0.2%.
Bitcoin prices are relatively stable just above the USD 29,000 level.
To the day ahead now, and data releases from the US include the Q2 employment cost index, June’s PCE inflation, personal income and personal spending, and the final University of Michigan consumer sentiment index for July. Over in Europe, we’ll get the French and German CPI readings for July. Central bank speakers include the ECB’s Simkus. Finally, earnings releases include Exxon Mobil and Procter & Gamble.
Market Snapshot
- S&P 500 futures up 0.3% to 4,578.25
- MXAP up 0.3% to 169.86
- MXAPJ up 0.1% to 536.74
- Nikkei down 0.4% to 32,759.23
- Topix down 0.2% to 2,290.61
- Hang Seng Index up 1.4% to 19,916.56
- Shanghai Composite up 1.8% to 3,275.93
- Sensex down 0.5% to 65,953.22
- Australia S&P/ASX 200 down 0.7% to 7,403.65
- Kospi up 0.2% to 2,608.32
- STOXX Europe 600 down 0.4% to 470.02
- German 10Y yield little changed at 2.52%
- Euro down 0.1% to $1.0963
- Brent Futures down 0.2% to $84.03/bbl
- Gold spot up 0.2% to $1,949.96
- U.S. Dollar Index up 0.12% to 101.90
Top Overnight News from Bloomberg
- China’s markets regulator has consulted securities firms for possible measures to boost stocks amid growing signs Beijing is seeking to restore investor confidence, people familiar with the matter said. BBG
- China has asked its largest technology companies to provide case studies of their most successful startup investments in consumer, telecom and media companies, a sign authorities are ready to grant them broader leeway in backing such deals after a crackdown brought them to a virtual halt two years ago. BBG
- The White House has decided it will bar Hong Kong’s top government official from attending a major economic summit in the United States this fall, according to three U.S. officials familiar with the matter, in the latest test of President Biden’s bid to reset relations with China. Washington Post
- The Tokyo CPI for Jul overshoots the Street, with core (ex-food/energy) coming in at +4% Y/Y (up from +3.8% in June and ahead of the Street’s +3.7% forecast). RTRS
- The BOJ surprised markets by loosening its grip on bond yields. It kept the target for 10-year yields at around 0% but said its 0.5% ceiling was now a reference point — not a rigid limit. It will manage the curve "flexibly" and buy benchmark bonds at 1% every business day, effectively capping it at that level. BBG
- Donald Trump has been accused of attempting to have surveillance video footage at his Mar-a-Lago estate deleted ahead of an FBI search, as federal prosecutors added more criminal counts to a case over the former US president’s handling of classified documents. FT
- Office space set to shrink for the first time on record – the lack of new supply coupled with existing buildings being repurposed or destroyed means the total square footage available to be used as office space will shrink this year for the first time on record. BBG
- Tech investment giant Sequoia Capital pared back the size of two major venture funds, part of a dramatic downsizing the venture firm is undertaking amid a startup downturn. WSJ
- Facebook removed content related to Covid-19 in response to pressure from the Biden administration, including posts claiming the virus was man-made, according to internal company communications viewed by The Wall Street Journal. WSJ
A more detailed look at global markets courtesy of Newsquawk
APAC stocks traded mixed with the region cautious as all attention was on the BoJ policy decision in which the central bank kept monetary policy settings unchanged but announced to guide YCC more flexibly with fixed rate operations for 10yr JGB to be conducted at 1.0% (prev. 50bps). ASX 200 was pressured amid weakness in the property sector and miners, with sentiment also not helped by the surprise contraction in Retail Sales. Nikkei 225 underperformed with yields higher and markets spooked by the latest BoJ developments. Hang Seng and Shanghai Comp shrugged off early weakness and gained after further calls and efforts for China to support the housing market and tech industry. US equity futures were rangebound overnight although slumped during US trade as markets faltered stateside following source reporting by the Nikkei on the BoJ. European equity futures are indicative of a lower open with the Euro Stoxx 50 -0.4% after the cash market closed up by 2.3% yesterday.
Top Asian News
- Chinese market watchdog has reportedly asked brokers for advice to boost stocks, according to Bloomberg; brokers reportedly proposed stamp duty reduction.
- Italian PM Meloni said she plans to go to China in one of her next diplomatic missions and the decision on leaving China's Belt and Road Initiative will be made by December.
- China reportedly urges improved mortgage rules to support the housing market, while it also asked tech giants to showcase investments in a sign of easing, according to Bloomberg.
- US is to ban Hong Kong Chief Executive Lee from the APEC Economic Summit, according to Washington Post.
European equities are a mixed bag as the dust settles on yesterday’s ECB announcement and the overnight BoJ release. The Stoxx 600 index is on track to close the week out with gains over just over 1% with discrepancies between regional bourses stemming from various heavyweight earnings releases. Equity sectors in Europe have a negative tilt with Tech, Real Estate and Travel & Leisure names lagging peers. US equity futures are trading on the front foot, as positivity seemingly returns following a sell-off in stocks yesterday, after a slew of hot data prints ahead of today's top-tier data.
Top European News
- ECB's Simkus says the choice for September is between 25bps hike and unchanged rate; rate cut unlikely in H1'24; would not call a situation a recession, it is more a soft landing scenario, according to Reuters.
- ECB's Villeroy says French data showing inflation is falling without a recession; Pragmatism also needed as decisions at upcoming rate meetings will be open and entirely data drivenPerseverance is now the prime key virtue given the time needed for full transmission of monetary policy. Our growing confidence in the fall in inflation towards 2% is based on the good transmission of monetary policy, according to Reuters.
- ECB's Kazimir says ECB is nearing the completion of policy tightening; he is still waiting for an answer for what is coming in September; says ECB's mission is still not fulfilled and "we should take firm step further". He noted if ECB was to take a break in September, it would be premature to consider it the end, and added the ECB looking for the right place to stay for a large part of next year, according to Reuters.
- ECB Survey of Professional Forecasters (SBF): expectations for headline HICP inflation were broadly unchanged compared to the previous survey
FX
- XY briefly topped 102.00 earlier in the European morning. Dollar paused for breath after Thursday’s sharp rebound on bullish US data and Euro depreciation on the back of a dovish ECB hike, but retained a firm underlying bid.
- The Buck faced strong competition from the Yen following the BoJ’s hawkish "surprise" as this hammered USD/JPY down to within single digit pips of 138.00 at one stage from 141.05
- Antipodeans lag with the Aussie underperforming as Australian Retail Sales were downwardly revised, while market pricing was already tilting heavily in favour of no change in rates from the RBA next week.
Fixed Income
- Debt futures have settled down following several bouts of fast market moves and high volatility amidst somewhat mixed data and further reaction to or reflection on Central Bank meetings that threw several surprises.
- Bunds and Gilts have regained poise within wider 132.96-81 and 95.62-11 respective ranges, while OATs and Bonos lag in wake of French and Spain inflation data.
- The T-note remains above parity between 110-10+/110-25+ parameters in consolidative trade after yesterday’s mostly stellar US macro releases and turning attention to another busy agenda to end a hectic week.
Commodities
- WTI and Brent front-month futures continue with the choppy but horizontal performance seen overnight with prices moving in tandem with the broader risk sentiment. Complex-specific newsflow has been light this morning aside from the release of overall mixed GDP from various EZ nations.
- Spot gold was dragged back under its 100 DMA (USD 1,966.76/oz) to levels near USD 1,950/oz yesterday following the hot US economic data, with prices today meandering around the half-round figure and on both sides of the 50 DMA and 21 DMA.
- Base metals meanwhile are mostly firmer despite the stronger Dollar amid continued tailwinds from Chinese stimulus.
Geopolitics
- Russia prevented a Ukrainian drone attack on targets in Moscow, according to RIA citing the Defence Ministry.
- US President Biden and Italian PM Meloni's joint statement said the US and Italy will continue to provide political, military, financial and humanitarian assistance to Ukraine for as long as it takes. US and Italy are firmly committed to a free, open, prosperous, inclusive and secure Indo-Pacific, while they reiterated the vital importance of maintaining peace and stability across the Taiwan Strait. Furthermore, they commit to strengthening the bilateral and multilateral consultation on the opportunities and challenges posed by China.
- US is expected to announce a weapons package for Taiwan worth more than USD 300mln, according to US officials cited by Reuters.
- North Korea staged a military parade in celebration of the 70th anniversary of the end of the Korean War, while the Chinese delegation attended the parade and North Korea displayed an ICBM at the parade, according to KCNA.
- North Korean leader Kim had a formal lunch with Russian Defence Minister Shoigu and exchanged views on the political situation around the Korean peninsula, as well as discussed issues to advance strategic cooperation on military and security. Furthermore, North Korea said it will fight on the side of countries challenging US hegemony, according to KCNA.
- Russian President Putin said North Korea's support for the military operation against Ukraine emboldens the two countries' determination to cope with Western organisations, according to KCNA.
- Russia's Putin says we will discuss peace plan today, according ot Reuters.
- China declares a large no-sail zone in the South China Sea for military exercises from July 29 to August 2nd, according to a journalist on Twitter.
US Event Calendar
- 08:30: June PCE Deflator MoM, est. 0.2%, prior 0.1%
- June PCE Core Deflator MoM, est. 0.2%, prior 0.3%
- June PCE Core Deflator YoY, est. 4.2%, prior 4.6%
- June PCE Deflator YoY, est. 3.0%, prior 3.8%
- June Personal Income, est. 0.5%, prior 0.4%
- June Personal Spending, est. 0.4%, prior 0.1%
- June Real Personal Spending, est. 0.3%, prior 0%
- 10:00: July U. of Mich. Sentiment, est. 72.6, prior 72.6
- July U. of Mich. Current Conditions, prior 77.5
- July U. of Mich. Expectations, prior 69.4
- July U. of Mich. 5-10 Yr Inflation, est. 3.0%, prior 3.1%
- July U. of Mich. 1 Yr Inflation, prior 3.4%
- 11:00: July Kansas City Fed Services Activ, prior 14
DB's Jim Reid concludes the overnight wrap
It was originally another great day for the fictitious soft-landing ETF yesterday until markets started to break down around 6pm London time last night after a softish 7-year Treasury auction and more importantly, a report from Nikkei suggesting the BoJ would discuss tweaks to YCC at this morning's meeting, something they've followed through on as we'll see immediately below. This turned an +8bps sell-off in 10yr US yields into a +13.1bps one by the close and turned the S&P 500 from a +0.7% gain to a -0.64% loss, with the NASDAQ moving from c.+1.3% to -0.22% over the same 3 hour late session period. It all overshadowed a relatively dovish ECB meeting, within the context of the expected +25bps hike, afterwhich European yields moved notably lower for the day (e.g. 2yr bunds -5.1bps).
So the last international hold out on ultra low yields has turned with the BoJ tweaking it's YCC policy in the last couple of hours. In a slightly complicated message the BoJ kept their target for 10yr JGBs at 0% but effectively widened the band to +1% from 0.5% even if they've kept the original bands as reference points. It confused me a bit this early in the morning but they won't be able to defend 0.5% now absent a macro development that structurally lowers yields. 10yr JGBs have increased +12bps as we type to 0.56bps, their highest since 2014 and all other things being equal this should continue to creep up in the days and weeks to come and removes an anchor for global yields. It's going to be an interesting press conference just after we go to print.
Initially, the Japanese yen strangely fell on the news to 141 but now trades +0.6% higher at 138.6. Elsewhere the Nikkei (-2.24%) is sharply lower with the KOSPI (-0.26%) also trading in the red. Chinese stocks are bucking the trend with the CSI (+1.79%) leading gains followed by the Shanghai Composite (+1.38%) and the Hang Seng (+0.89%). US stock futures are edging slightly higher with those tied to the S&P 500 +0.18%. Meanwhile, yields on 10yr USTs (+3.01bps) are at 4.02% as we go to press.
Coming back to Japan, Tokyo’s consumer price index (CPI) rose +3.2% y/y in July (v/s +2.9% expected). This is the 14th consecutive month that the inflation rate in the capital came in above the BOJ’s 2% target. At the same time, core inflation (excluding fresh food) advanced +3.0% y/y in July, higher than Bloomberg estimates of +2.9% but lower than prior month’s reading of 3.2%. More surprising was the core-core inflation (excluding fresh food and energy) which climbed to +4.0% y/y in July (v/s +3.7% expected, +3.8% in June) and provided more justification for the move today. Elsewhere, Australia’s retail sales sharply declined by -0.8% m/m in June, recording its biggest decline this year, versus expectations of a flat outcome.
Before the 6pm London headline markets were riding high on optimism and shrugging off higher US yields. This all stemmed from another round of strong US data that added to investors’ optimism. At one point the Dow Jones was comfortably on track to record a 14th consecutive daily advance for the first time since the index’s creation in 1896. So a 1-in-a-127 year event. Blame the Nikkei article for that streak being over and only equally the record run.
Even before the late rate moves investors were growing increasingly sceptical about Fed rate cuts anytime soon, with the 2yr real yield (+6.3bps) hitting another post-GFC high of 3.058% with 2yr nominal yields up +7.7bps. The rate priced in for the December 2024 meeting rose by +15.3bps on the day to 4.23%. This moved US rates in the opposite direction to European yields (2yr bunds -5.1bps) after a slight dovish bias to the ECB meeting. All these moves will be put to the test today, or reinforced, by US core PCE, US ECI (important to see if labour costs can fall organicallly), alongside German and French CPI.
The main catalyst for the early move higher in US rates, and the earlier risk on yesterday, was a robust GDP print from the US, which showed growth accelerated in Q2 to an annualised pace of +2.4% (vs. +1.8% expected). The report also came with several positive details, including that core PCE inflation was only at +3.8% in Q2 (vs. +4.0% expected), which added to the recent theme of better-than-expected growth and softer-than-expected inflation. As well as the GDP release, the weekly jobless claims fell for a third week running to 221k over the week ending July 22 (vs. 235k expected), which is their lowest level since February. And the continuing claims print for the previous week came in at a post-January low of 1.69m (vs. 1.75m expected). So lots of good news all round from an economic standpoint maybe before the full impact of the monetary policy lag starts to bite.
So as discussed at the top equities faded into the close with tech stocks seeing the biggest beta to the move with the FANG+ index falling from c.+2.3% to -0.24% in the last 3 hours of trading. Meta (+4.40%) outperformed thanks to its strong Q2 results after the previous day’s close. This helped lift the communication services sector into the green for the day (+0.85%) while the rest of the top level S&P sectors declined, most notably real estate (-2.13%) and utilities (-1.73%). In Europe markets closed before the sell-off and neatly encapsulated the earlier bullish sentiment, with the STOXX 600 (+1.35%) hitting a 17-month high, whilst France’s CAC 40 (+2.05%) and Italy’s FTSE MIB (+2.13%) saw significant advances of their own.
Before all this excitement, the ECB delivered their own 25bp rate hike as expected, which took the deposit rate up to 3.75%. However, unlike recent meetings, there wasn’t a strong steer about what they’re going to do next, and President Lagarde said that “we have an open mind as to what the decisions will be in September and in subsequent meetings”. She avoided signalling a specific outcome, and said that if they did pause, then it “would not necessarily be for an extended period.” At the same time, the language in the statement was also softened, since it said that future decisions would ensure rates “will be set at sufficiently restrictive levels”. That’s a change from last time, when it said they “will be brought to levels sufficiently restrictive”. See our economists’ review here.
When it comes to the ECB’s next decision, we should start to get some more signals today, as the flash CPI releases from France, Spain and Germany are coming out ahead of the Euro Area-wide release on Monday. Obviously the data will go a long way to determining the likelihood of another move, but markets are still pricing in a 71.7% chance of another 25bp hike in September anyway. Nevertheless, sovereign bonds rallied yesterday after the decision, with yields on 10yr bunds (-1.0bps), OATs (-1.6bps) and BTPs (-3.0bps) all coming down. That divergence between Europe and the US also meant that the spread of 10yr Treasury yields over 10yr bunds reached its widest level of 2023 so far, at 153.4bps.
When it came to yesterday’s other data, in the US we had the preliminary durable goods orders for June, which showed strong growth of +4.7% (vs. +1.3% expected). Core capital goods orders were more subdued however, with just +0.2% growth (but better than the -0.1% expected). Elsewhere, pending home sales for June beat expectations with a +0.3% gain (vs. -0.5% expected), and the Kansas City Fed’s manufacturing index came in at -11 (vs. -10 expected).
To the day ahead now, and data releases from the US include the Q2 employment cost index, June’s PCE inflation, personal income and personal spending, and the final University of Michigan consumer sentiment index for July. Over in Europe, we’ll get the French and German CPI readings for July. Central bank speakers include the ECB’s Simkus. Finally, earnings releases include Exxon Mobil and Procter & Gamble.
Uncategorized
Mortgage rates fall as labor market normalizes
Jobless claims show an expanding economy. We will only be in a recession once jobless claims exceed 323,000 on a four-week moving average.
Share this:


Everyone was waiting to see if this week’s jobs report would send mortgage rates higher, which is what happened last month. Instead, the 10-year yield had a muted response after the headline number beat estimates, but we have negative job revisions from previous months. The Federal Reserve’s fear of wage growth spiraling out of control hasn’t materialized for over two years now and the unemployment rate ticked up to 3.9%. For now, we can say the labor market isn’t tight anymore, but it’s also not breaking.
The key labor data line in this expansion is the weekly jobless claims report. Jobless claims show an expanding economy that has not lost jobs yet. We will only be in a recession once jobless claims exceed 323,000 on a four-week moving average.
From the Fed: In the week ended March 2, initial claims for unemployment insurance benefits were flat, at 217,000. The four-week moving average declined slightly by 750, to 212,250
Below is an explanation of how we got here with the labor market, which all started during COVID-19.
1. I wrote the COVID-19 recovery model on April 7, 2020, and retired it on Dec. 9, 2020. By that time, the upfront recovery phase was done, and I needed to model out when we would get the jobs lost back.
2. Early in the labor market recovery, when we saw weaker job reports, I doubled and tripled down on my assertion that job openings would get to 10 million in this recovery. Job openings rose as high as to 12 million and are currently over 9 million. Even with the massive miss on a job report in May 2021, I didn’t waver.
Currently, the jobs openings, quit percentage and hires data are below pre-COVID-19 levels, which means the labor market isn’t as tight as it once was, and this is why the employment cost index has been slowing data to move along the quits percentage.

3. I wrote that we should get back all the jobs lost to COVID-19 by September of 2022. At the time this would be a speedy labor market recovery, and it happened on schedule, too
Total employment data
4. This is the key one for right now: If COVID-19 hadn’t happened, we would have between 157 million and 159 million jobs today, which would have been in line with the job growth rate in February 2020. Today, we are at 157,808,000. This is important because job growth should be cooling down now. We are more in line with where the labor market should be when averaging 140K-165K monthly. So for now, the fact that we aren’t trending between 140K-165K means we still have a bit more recovery kick left before we get down to those levels.

From BLS: Total nonfarm payroll employment rose by 275,000 in February, and the unemployment rate increased to 3.9 percent, the U.S. Bureau of Labor Statistics reported today. Job gains occurred in health care, in government, in food services and drinking places, in social assistance, and in transportation and warehousing.
Here are the jobs that were created and lost in the previous month:

In this jobs report, the unemployment rate for education levels looks like this:
- Less than a high school diploma: 6.1%
- High school graduate and no college: 4.2%
- Some college or associate degree: 3.1%
- Bachelor’s degree or higher: 2.2%

Today’s report has continued the trend of the labor data beating my expectations, only because I am looking for the jobs data to slow down to a level of 140K-165K, which hasn’t happened yet. I wouldn’t categorize the labor market as being tight anymore because of the quits ratio and the hires data in the job openings report. This also shows itself in the employment cost index as well. These are key data lines for the Fed and the reason we are going to see three rate cuts this year.
recession unemployment covid-19 fed federal reserve mortgage rates recession recovery unemploymentUncategorized
Inside The Most Ridiculous Jobs Report In History: Record 1.2 Million Immigrant Jobs Added In One Month
Inside The Most Ridiculous Jobs Report In History: Record 1.2 Million Immigrant Jobs Added In One Month
Last month we though that the January…
Share this:


Last month we though that the January jobs report was the "most ridiculous in recent history" but, boy, were we wrong because this morning the Biden department of goalseeked propaganda (aka BLS) published the February jobs report, and holy crap was that something else. Even Goebbels would blush.
What happened? Let's take a closer look.
On the surface, it was (almost) another blockbuster jobs report, certainly one which nobody expected, or rather just one bank out of 76 expected. Starting at the top, the BLS reported that in February the US unexpectedly added 275K jobs, with just one research analyst (from Dai-Ichi Research) expecting a higher number.
Some context: after last month's record 4-sigma beat, today's print was "only" 3 sigma higher than estimates. Needless to say, two multiple sigma beats in a row used to only happen in the USSR... and now in the US, apparently.

Before we go any further, a quick note on what last month we said was "the most ridiculous jobs report in recent history": it appears the BLS read our comments and decided to stop beclowing itself. It did that by slashing last month's ridiculous print by over a third, and revising what was originally reported as a massive 353K beat to just 229K, a 124K revision, which was the biggest one-month negative revision in two years!

Of course, that does not mean that this month's jobs print won't be revised lower: it will be, and not just that month but every other month until the November election because that's the only tool left in the Biden admin's box: pretend the economic and jobs are strong, then revise them sharply lower the next month, something we pointed out first last summer and which has not failed to disappoint once.
In the past month the Biden department of goalseeking stuff higher before revising it lower, has revised the following data sharply lower:
— zerohedge (@zerohedge) August 30, 2023
- Jobs
- JOLTS
- New Home sales
- Housing Starts and Permits
- Industrial Production
- PCE and core PCE
To be fair, not every aspect of the jobs report was stellar (after all, the BLS had to give it some vague credibility). Take the unemployment rate, after flatlining between 3.4% and 3.8% for two years - and thus denying expectations from Sahm's Rule that a recession may have already started - in February the unemployment rate unexpectedly jumped to 3.9%, the highest since February 2022 (with Black unemployment spiking by 0.3% to 5.6%, an indicator which the Biden admin will quickly slam as widespread economic racism or something).

And then there were average hourly earnings, which after surging 0.6% MoM in January (since revised to 0.5%) and spooking markets that wage growth is so hot, the Fed will have no choice but to delay cuts, in February the number tumbled to just 0.1%, the lowest in two years...

... for one simple reason: last month's average wage surge had nothing to do with actual wages, and everything to do with the BLS estimate of hours worked (which is the denominator in the average wage calculation) which last month tumbled to just 34.1 (we were led to believe) the lowest since the covid pandemic...

... but has since been revised higher while the February print rose even more, to 34.3, hence why the latest average wage data was once again a product not of wages going up, but of how long Americans worked in any weekly period, in this case higher from 34.1 to 34.3, an increase which has a major impact on the average calculation.

While the above data points were examples of some latent weakness in the latest report, perhaps meant to give it a sheen of veracity, it was everything else in the report that was a problem starting with the BLS's latest choice of seasonal adjustments (after last month's wholesale revision), which have gone from merely laughable to full clownshow, as the following comparison between the monthly change in BLS and ADP payrolls shows. The trend is clear: the Biden admin numbers are now clearly rising even as the impartial ADP (which directly logs employment numbers at the company level and is far more accurate), shows an accelerating slowdown.

But it's more than just the Biden admin hanging its "success" on seasonal adjustments: when one digs deeper inside the jobs report, all sorts of ugly things emerge... such as the growing unprecedented divergence between the Establishment (payrolls) survey and much more accurate Household (actual employment) survey. To wit, while in January the BLS claims 275K payrolls were added, the Household survey found that the number of actually employed workers dropped for the third straight month (and 4 in the past 5), this time by 184K (from 161.152K to 160.968K).

This means that while the Payrolls series hits new all time highs every month since December 2020 (when according to the BLS the US had its last month of payrolls losses), the level of Employment has not budged in the past year. Worse, as shown in the chart below, such a gaping divergence has opened between the two series in the past 4 years, that the number of Employed workers would need to soar by 9 million (!) to catch up to what Payrolls claims is the employment situation.

There's more: shifting from a quantitative to a qualitative assessment, reveals just how ugly the composition of "new jobs" has been. Consider this: the BLS reports that in February 2024, the US had 132.9 million full-time jobs and 27.9 million part-time jobs. Well, that's great... until you look back one year and find that in February 2023 the US had 133.2 million full-time jobs, or more than it does one year later! And yes, all the job growth since then has been in part-time jobs, which have increased by 921K since February 2023 (from 27.020 million to 27.941 million).

Here is a summary of the labor composition in the past year: all the new jobs have been part-time jobs!

But wait there's even more, because now that the primary season is over and we enter the heart of election season and political talking points will be thrown around left and right, especially in the context of the immigration crisis created intentionally by the Biden administration which is hoping to import millions of new Democratic voters (maybe the US can hold the presidential election in Honduras or Guatemala, after all it is their citizens that will be illegally casting the key votes in November), what we find is that in February, the number of native-born workers tumbled again, sliding by a massive 560K to just 129.807 million. Add to this the December data, and we get a near-record 2.4 million plunge in native-born workers in just the past 3 months (only the covid crash was worse)!

The offset? A record 1.2 million foreign-born (read immigrants, both legal and illegal but mostly illegal) workers added in February!

Said otherwise, not only has all job creation in the past 6 years has been exclusively for foreign-born workers...

... but there has been zero job-creation for native born workers since June 2018!

This is a huge issue - especially at a time of an illegal alien flood at the southwest border...

... and is about to become a huge political scandal, because once the inevitable recession finally hits, there will be millions of furious unemployed Americans demanding a more accurate explanation for what happened - i.e., the illegal immigration floodgates that were opened by the Biden admin.
Which is also why Biden's handlers will do everything in their power to insure there is no official recession before November... and why after the election is over, all economic hell will finally break loose. Until then, however, expect the jobs numbers to get even more ridiculous.
Uncategorized
Economic Earthquake Ahead? The Cracks Are Spreading Fast
Economic Earthquake Ahead? The Cracks Are Spreading Fast
Authored by Brandon Smith via Alt-Market.us,
One of my favorite false narratives…
Share this:


Authored by Brandon Smith via Alt-Market.us,
One of my favorite false narratives floating around corporate media platforms has been the argument that the American people “just don’t seem to understand how good the economy really is right now.” If only they would look at the stats, they would realize that we are in the middle of a financial renaissance, right? It must be that people have been brainwashed by negative press from conservative sources…
I have to laugh at this notion because it’s a very common one throughout history – it’s an assertion made by almost every single political regime right before a major collapse. These people always say the same things, and when you study economics as long as I have you can’t help but throw up your hands and marvel at their dedication to the propaganda.
One example that comes to mind immediately is the delusional optimism of the “roaring” 1920s and the lead up to the Great Depression. At the time around 60% of the U.S. population was living in poverty conditions (according to the metrics of the decade) earning less than $2000 a year. However, in the years after WWI ravaged Europe, America’s economic power was considered unrivaled.
The 1920s was an era of mass production and rampant consumerism but it was all fueled by easy access to debt, a condition which had not really existed before in America. It was this illusion of prosperity created by the unchecked application of credit that eventually led to the massive stock market bubble and the crash of 1929. This implosion, along with the Federal Reserve’s policy of raising interest rates into economic weakness, created a black hole in the U.S. financial system for over a decade.
There are two primary tools that various failing regimes will often use to distort the true conditions of the economy: Debt and inflation. In the case of America today, we are experiencing BOTH problems simultaneously and this has made certain economic indicators appear healthy when they are, in fact, highly unstable. The average American knows this is the case because they see the effects everyday. They see the damage to their wallets, to their buying power, in the jobs market and in their quality of life. This is why public faith in the economy has been stuck in the dregs since 2021.
The establishment can flash out-of-context stats in people’s faces, but they can’t force the populace to see a recovery that simply does not exist. Let’s go through a short list of the most faulty indicators and the real reasons why the fiscal picture is not a rosy as the media would like us to believe…
The “miracle” labor market recovery
In the case of the U.S. labor market, we have a clear example of distortion through inflation. The $8 trillion+ dropped on the economy in the first 18 months of the pandemic response sent the system over the edge into stagflation land. Helicopter money has a habit of doing two things very well: Blowing up a bubble in stock markets and blowing up a bubble in retail. Hence, the massive rush by Americans to go out and buy, followed by the sudden labor shortage and the race to hire (mostly for low wage part-time jobs).
The problem with this “miracle” is that inflation leads to price explosions, which we have already experienced. The average American is spending around 30% more for goods, services and housing compared to what they were spending in 2020. This is what happens when you have too much money chasing too few goods and limited production.
The jobs market looks great on paper, but the majority of jobs generated in the past few years are jobs that returned after the covid lockdowns ended. The rest are jobs created through monetary stimulus and the artificial retail rush. Part time low wage service sector jobs are not going to keep the country rolling for very long in a stagflation environment. The question is, what happens now that the stimulus punch bowl has been removed?
Just as we witnessed in the 1920s, Americans have turned to debt to make up for higher prices and stagnant wages by maxing out their credit cards. With the central bank keeping interest rates high, the credit safety net will soon falter. This condition also goes for businesses; the same businesses that will jump headlong into mass layoffs when they realize the party is over. It happened during the Great Depression and it will happen again today.
Cracks in the foundation
We saw cracks in the narrative of the financial structure in 2023 with the banking crisis, and without the Federal Reserve backstop policy many more small and medium banks would have dropped dead. The weakness of U.S. banks is offset by the relative strength of the U.S. dollar, which lures in foreign investors hoping to protect their wealth using dollar denominated assets.
But something is amiss. Gold and bitcoin have rocketed higher along with economically sensitive assets and the dollar. This is the opposite of what’s supposed to happen. Gold and BTC are supposed to be hedges against a weak dollar and a weak economy, right? If global faith in the dollar and in the U.S. economy is so high, why are investors diving into protective assets like gold?
Again, as noted above, inflation distorts everything.
Tens of trillions of extra dollars printed by the Fed are floating around and it’s no surprise that much of that cash is flooding into the economy which simply pushes higher right along with prices on the shelf. But, gold and bitcoin are telling us a more honest story about what’s really happening.
Right now, the U.S. government is adding around $600 billion per month to the national debt as the Fed holds rates higher to fight inflation. This debt is going to crush America’s financial standing for global investors who will eventually ask HOW the U.S. is going to handle that growing millstone? As I predicted years ago, the Fed has created a perfect Catch-22 scenario in which the U.S. must either return to rampant inflation, or, face a debt crisis. In either case, U.S. dollar-denominated assets will lose their appeal and their prices will plummet.
“Healthy” GDP is a complete farce
GDP is the most common out-of-context stat used by governments to convince the citizenry that all is well. It is yet another stat that is entirely manipulated by inflation. It is also manipulated by the way in which modern governments define “economic activity.”
GDP is primarily driven by spending. Meaning, the higher inflation goes, the higher prices go, and the higher GDP climbs (to a point). Eventually prices go too high, credit cards tap out and spending ceases. But, for a short time inflation makes GDP (as well as retail sales) look good.
Another factor that creates a bubble is the fact that government spending is actually included in the calculation of GDP. That’s right, every dollar of your tax money that the government wastes helps the establishment by propping up GDP numbers. This is why government spending increases will never stop – It’s too valuable for them to spend as a way to make the economy appear healthier than it is.
The REAL economy is eclipsing the fake economy
The bottom line is that Americans used to be able to ignore the warning signs because their bank accounts were not being directly affected. This is over. Now, every person in the country is dealing with a massive decline in buying power and higher prices across the board on everything – from food and fuel to housing and financial assets alike. Even the wealthy are seeing a compression to their profit and many are struggling to keep their businesses in the black.
The unfortunate truth is that the elections of 2024 will probably be the turning point at which the whole edifice comes tumbling down. Even if the public votes for change, the system is already broken and cannot be repaired without a complete overhaul.
We have consistently avoided taking our medicine and our disease has gotten worse and worse.
People have lost faith in the economy because they have not faced this kind of uncertainty since the 1930s. Even the stagflation crisis of the 1970s will likely pale in comparison to what is about to happen. On the bright side, at least a large number of Americans are aware of the threat, as opposed to the 1920s when the vast majority of people were utterly conned by the government, the banks and the media into thinking all was well. Knowing is the first step to preparing.
The second step is securing your own financial future – that’s where physical precious metals can play a role. Diversifying your savings with inflation-resistant, uninflatable assets whose intrinsic value doesn’t rely on a counterparty’s promise to pay adds resilience to your savings. That’s the main reason physical gold and silver have been the safe haven store-of-value assets of choice for centuries (among both the elite and the everyday citizen).
* * *
As the world moves away from dollars and toward Central Bank Digital Currencies (CBDCs), is your 401(k) or IRA really safe? A smart and conservative move is to diversify into a physical gold IRA. That way your savings will be in something solid and enduring. Get your FREE info kit on Gold IRAs from Birch Gold Group. No strings attached, just peace of mind. Click here to secure your future today.


Wendy’s has a new deal for daylight savings time haters


Watch Live: President Biden Reminds Americans Just How Good They’ve Got It Thanks To Him


Watch: President Biden Delivers The “Darkest, Most Un-American Speech Given By A President”


Is the biotech market rally real? Data suggest comeback in private, public markets


People Who Received Ivermectin Were Better Off, Study Finds


These Are The 5 Charts The FDIC Does Not Want You Paying Attention To


Interest rates, the best it gets. It’s time to deploy cash


COVID-19 May Lead To Persistent Cognitive Impairment, Brain Fog, And Lower IQ Scores


Stock Market’s Top Will Outlast Your Disbelief


COVID-19 Lockdowns Had High Health, Economic Costs: Swedish Study
-

 Uncategorized2 weeks ago
All Of The Elements Are In Place For An Economic Crisis Of Staggering Proportions
-

 Uncategorized1 month ago
Cathie Wood sells a major tech stock (again)
-

 Uncategorized3 weeks ago
California Counties Could Be Forced To Pay $300 Million To Cover COVID-Era Program
-

 Uncategorized2 weeks ago
Apparel Retailer Express Moving Toward Bankruptcy
-

 Uncategorized3 weeks ago
Industrial Production Decreased 0.1% in January
-

 International13 hours ago
Walmart launches clever answer to Target’s new membership program
-

 Uncategorized3 weeks ago
RFK Jr: The Wuhan Cover-Up & The Rise Of The Biowarfare-Industrial Complex
-

 Uncategorized3 weeks ago
GOP Efforts To Shore Up Election Security In Swing States Face Challenges