Uncategorized
Futures Dip As Tech Rally Faces First Major Test With Microsoft Earnings
Futures Dip As Tech Rally Faces First Major Test With Microsoft Earnings
The rally in US tech stocks and European markets paused on Tuesday…
Share this:

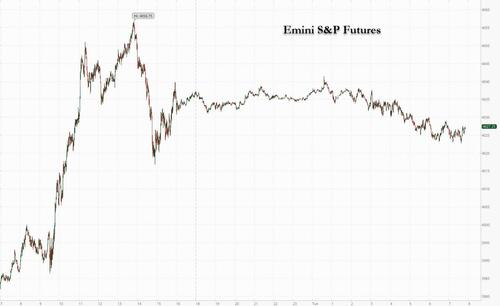
The rally in US tech stocks and European markets paused on Tuesday as investors prepared for earnings updates from industry giants, including Microsoft and Texas Instruments. US equity futures fell after the tech-heavy Nasdaq 100 posted its best two-day gain since November, as traders braced for the worst tech earnings slump since 2016. Europe’s region’s Stoxx 600 Index erased an early advance to fall into the red. At 7:30am ET, S&P 500 futures were 0.2% lower and Nasdaq futures were down 0.3%; the tech-heavy benchmark is up8.5% in January, on pace for its best month since July even as profit estimates are declining and as Federal Reserve officials advocate for more policy tightening to combat inflation if at a slower, 25bps pace. The USD rose; Treasuries were unchanged while commodities were mixed with strength in natgas, nickel, oil and precious metals.
In pre-market trading, Alphabet shares fell slightly after a Bloomberg News report that the US Justice Department could file an antitrust lawsuit against Google as soon as Tuesday regarding the search giant’s dominance over the digital advertising market. Microsoft, which reports results today, was little changed. Yesterday the world’s largest software maker confirmed it is investing $10 billion in OpenAI, the owner of artificial intelligence tool ChatGPT. Advanced Micro Devices fell in pre-market trading, after Bernstein downgraded the stock to market perform from outperform, citing a worsening PC climate and “semi-destructive behavior” by rival Intel Corp. Here are the other notable pre-market movers:
- 3M forecast adjusted earnings per share for 2023; the guidance missed the average analyst estimate. Shares decline 4.9%.
- GE forecast adjusted earnings per share for 2023; the guidance missed the average analyst estimate. Shares gain 1.8%.
- Johnson & Johnson guided to stronger earnings for 2023 than analysts were expecting after a year in which the pharma division suffered because of waning demand for its unpopular Covid-19 shot. Shares rise 0.5%.
- Lyft shares gain 3.4% after KeyBanc upgrades the ride- hailing firm to overweight from sector weight, with broker saying data indicates that the firm is turning a corner, while cost-cutting could boost Ebitda.
- HighPeak Energy shares rise 15% after the oil producer’s board voted to initiate a process to evaluate strategic alternatives including a potential sale.
- Zions shares drop 2.7% after the bank’s total deposits fell short of Wall Street estimates, with analysts also disappointed by the firm’s forecast for net interest income which they said could put pressure on estimates amid a tough macroeconomic backdrop.
- Watch oil and gas stocks as Morgan Stanley says it’s increasingly selective in the sector as it continues to see a “mixed setup” for North American shares ahead of earnings. Upgrades Marathon Oil to overweight, and cuts APA and Ovintiv to equal-weight.
- Keep an eye on Target shares as Oppenheimer begins coverage at outperform, seeing potential for a “strong multi-year profit recovery” and opportunity for the discount retailer to capture market share.
- KeyBanc initiates coverage of Virgin Galactic Holdings at sector weight, saying the company could be highly profitable if it succeeds in ramping up its “next-generation” spaceship fleet, but that its performance hinges on execution.
- Amazon’price target and 2024 outlook cut at Telsey Advisory Group as the spending environment becomes more challenging and growth rates normalize after a couple of years of acceleration during Covid. Shares decline 0.3%.
- Cheesecake Factory downgraded at Raymond James to market perform from outperform reflecting concerns about the restaurant chain operator’s ability to recover pre-Covid margins. The brokerage also cut its rating on Dine Brands Global, the parent company of Applebee’s Neighborhood Grill + Bar and IHOP restaurants. Shares decline 1.8%.
- Cymabay Therapeutics gains 11% in premarket trading after the offering priced via Piper Sandler, Raymond James, Cantor Fitzgerald.
- Halliburton Co. boosted its dividend 33% as the world’s biggest provider of fracking services follows its oil-and-gas clients by expanding shareholder returns amid tight global supplies for crude. Shares gain 0.3%.
- HighPeak Energy (HPK) shares rise 17% after the oil producer’s board voted to initiate a process to evaluate strategic alternatives including a potential sale.
- Lululemon Athletica Inc. (LULU) falls as much as 2.1% after Bernstein analyst Aneesha Sherman cut her recommendation on the athleticwear maker to underperform from market perform.
- PennantPark Floating (PFLT) drops 6.4% after an offering of 4.25m shares raised proceeds of $47.6 million, or $11.20 apiece, representing a discount to last close.
- Verizon Communications Inc.’s profit outlook trailed Wall Street estimates in a sign that consumer wireless business continues to weigh down performance as the company turns to costly phone giveaways to compete with its peers. Shares decline 2%.
In previewing this week's barrage of tech earnings, JPMorgan writes that with MSFT earnings coming today, and the balance of the
FANG+ complex next week, "many are asking whether the US can reverse its underperformance. In the near-term, the answer seemingly lies with Tech earnings, which are expected to experience their largest decline since 2016, according to Bloomberg. Longer-term, a Fed pause may not be enough given the difference in growth rates of regions economies. The weakening USD has been a bigger benefit to international Equities than it has to create a domestic earnings tailwind. It may also be the case where the US is more vulnerable to margin compression than its international counterparts. Longer-term, if we do experience a Fed pivot this year, then would anticipate a strong, positive buying impulse for Tech."
Wall Street has been slashing earnings estimates for months for the tech sector, which is projected to be the biggest drag on S&P 500 profits in the fourth quarter, data compiled by Bloomberg Intelligence show. The danger for investors, however, is that analysts still prove too optimistic, with demand for the industry’s products crumbling as the economy cools.
“We do not see much scope for markets to rally in the near term, especially given our outlook for continued pressure on corporate profit growth,” Mark Haefele, chief investment officer at UBS Global Wealth Management, said in a note echoing what is now a consensus view with identical sentiment shared by his peers at Goldman, JPM, and Bank of America. Haefele noted that UBS GWM’s S&P 500 target for both June and December, at 3,700 points and 4,000 points, were both below Monday’s 4,020 close. “In our view, the risk-reward trade-off remains unfavorable for broad US indexes, and we retain a least preferred stance on US equities and the technology sector,” he added.
European stocks also traded lower with the Stoxx 600 down 0.3%. Energy, miners and personal care are the worst performing sectors while insurance and media rise. The risk-off tone has benefited bonds with UK and German benchmarks rising and 10-year borrowing costs falling by 5bps and 2bps respectively. Here are the most notable European movers:
- Norwegian salmon farmers surge after a politician told newspaper Dagbladet the party is open to modifying a proposed resource tax to be levied on seafood producers in Norway
- Logitech shares edge up by as much as 2.4% as analysts highlighted better sell- through figures, market-share gains and solid 3Q cash flow from the computer-equipment maker
- Swatch shares rise 2.1% after analysts said China’s ending of its zero-Covid stance should mean a robust rebound in demand
- Topdanmark shares bounce as much as 4.9%, the most since February 2022, with a higher-than- expected special dividend the highlight of the Danish insurer’s results
- Marston’s shares gain as much as 8.7%, with analysts saying the trading update from the UK pub company shows some encouraging sales trends
- Senior Plc gains as much as 12% in early trading, after the company issued a trading update Monday showing a “strong finish” to the year, with profits ahead of expectations
- Ericsson shares fall as much as 2.9% after being cut to sell from neutral at Goldman Sachs with the broker bearish on the telecoms-equipment group’s ongoing downside risks
- Associated British Foods shares slip as much as 1.7% after the food processing and retailing company posted a trading update noting a softer sugar segment offsetting strong performances elsewhere
- Direct Line shares fall as much as 3.2% as Citi switches to a new system to better value European insurance stocks, cutting the company to sell
- Dometic slides as much as 4.4% after Pareto Securities cut the Swedish recreational vehicle equipment maker to hold, with US demand in “free fall” in the short term
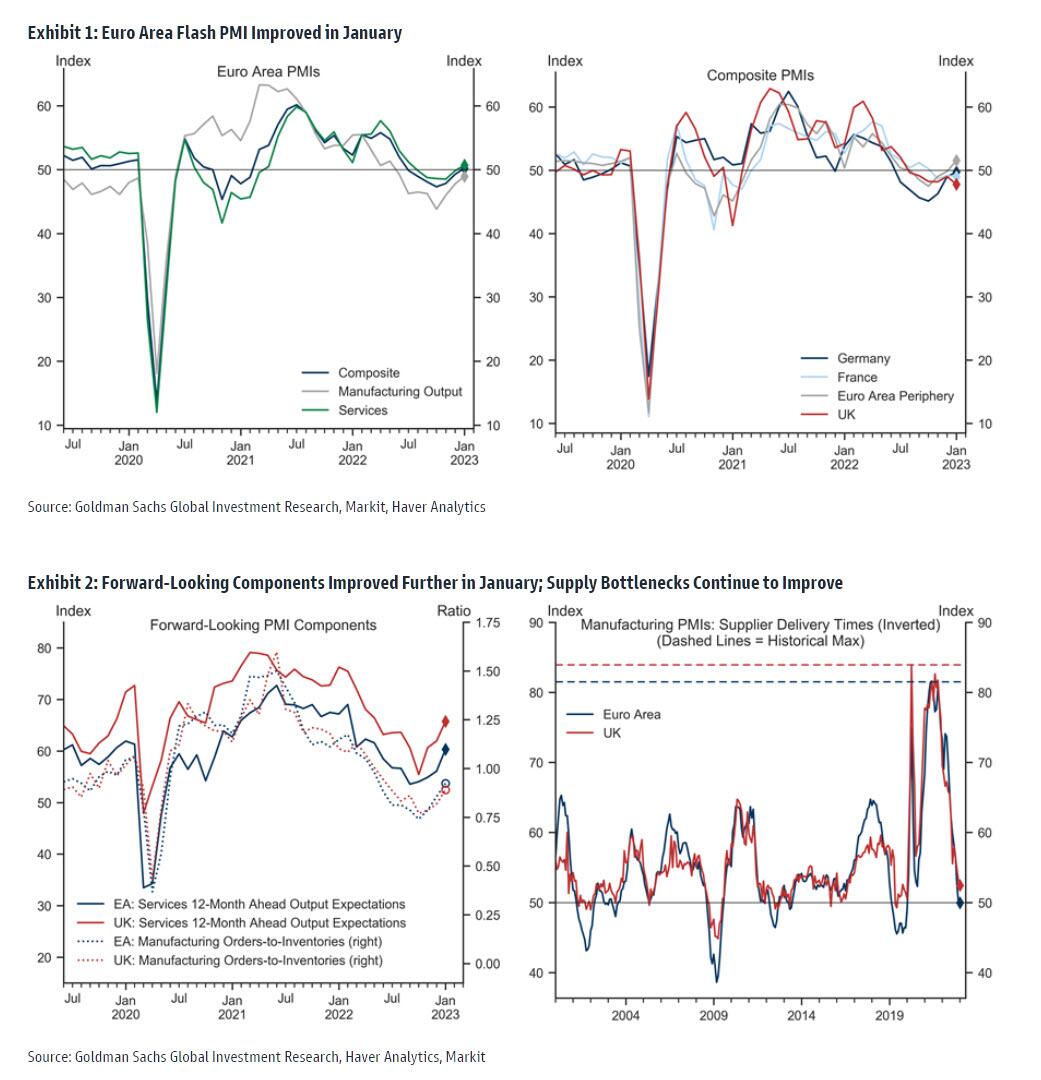
Meanwhile, European flash business activity data, while better than expected, highlighted ongoing weakness across the euro bloc and in Britain, while US figures later in the day will offer investors a snapshot of how the world’s largest economy is faring. Commenting on today's PMI data, which came out as follows...
- Germany Jan. Flash Manufacturing PMI 47; Est 48
- Germany Jan. Flash Services PMI 50.4; Est 49.5
- France Jan. Flash Manufacturing PMI 50.8; Est 49.5
- France Jan. Flash Services PMI 49.2; Est 49.8
- UK Jan. Flash Services PMI 48; Est 49.5
- UK Jan. Flash Manufacturing PMI 46.7; Est 45.5
... Goldman writes that "the January flash PMIs showed significant improvements in future expectations and other forward-looking indicators like new orders also improved on the margin." And some more details:
The Euro area composite flash PMI increased by 0.9pt to 50.2 in January, above consensus expectations. The increase in the composite index was broad-based across sectors, with the services sector surpassing the 50 threshold for the first time since July. Across countries, the improvement was led by the periphery and Germany, offset partially by a moderation in France. In the UK, the composite flash PMI decreased by 1.2pt to 47.8, well below consensus expectations. We see three main takeaways from today's data. First, the upside surprise in the data today and the Euro area composite PMI surpassing the 50 threshold confirm our view that Euro area growth prospects have improved significantly recently. Second, cost inflation is moderating but the increase in output prices released today provided another reminder that underlying inflation remains sticky. Third, today's data reinforce our expectation that the UK will underperform the Euro area even with falling energy prices.
PMI data aside, the upcoming wave of US corporate earnings — from tech giants such as Microsoft Corp. and Texas Instruments Inc. as well as industrials such as GE — is likely to dominate attention.
“It’s all about earnings,” said Peter Kinsella, head of FX strategy at asset manager UBP. “Given that equities are trading at elevated levels, any earnings disappointment would justify a shift lower in stocks.” Kinsella said there was scope for bonds to rally and reckons that the dollar, already down about 1.7% this year against a basket of rivals, has likely seen its peak as the Federal Reserve approaches the end of its rate-hiking cycle. The US central bank bank is expected to cut rates by a smaller 25 basis points at a Jan. 31-Feb. 1 meeting.
“The market is saying inflation is done and dusted, which justifies a turn in tone from the Fed,” Kinsella added. “Overall I am off the view we saw the multi-year dollar peak last year.”
Earlier in the session, Asian stocks extended their recent rise in holiday thinned trading, as investors looked beyond expected near-term earnings weakness and rising US interest rates. The MSCI Asia Pacific Index rose 0.8%, poised for a third straight day of gains, driven by industrial and technology shares. Japan led the advance for a second session, with China and much of the region still shut for Lunar New Year.
“With job cuts proceeding apace, the markets likely continue to ignore short-term earnings and look into next year,” a bullish scenario, analyst Mark Chadwick wrote in a note on Smartkarma. Growth stocks also benefit with “Fed hike risks out of the headlines and consensus now around peak rates at 5%.” Major Asian tech stocks reporting results this week include South Korean EV battery maker LG Energy Solution and Japanese robot maker Fanuc. In addition to the rebound in global peers, local shares have also gained on optimism over China’s reopening and easing corporate crackdowns
Japanese stocks rose Tuesday, gaining traction after a tech rally drove gains in US peers and amid growing optimism that the Federal Reserve will be less hawkish than previously expected. The Topix Index rose 1.4% to 1,972.92 at the market’s close in Tokyo, while the Nikkei advanced 1.5% to 27,299.19. Sony Group Corp. contributed the most to the Topix’s advance, increasing 1.9%. Mitsubishi UFJ Financial and Toyota Motor were other notable gainers. Among 2,161 stocks in the index, 1,713 rose, 369 fell and 79 were unchanged. “The rise in US stocks is positive to Japanese equities, especially with a fairly strong sentiment that US interest rate hikes might come to an end soon,” said Tomo Kinoshita, a global market strategist at Invesco Asset Management. “In Japan, exporters are rebounding as concerns over yen’s appreciation cool and inbound demand continues to contribute to the rally.”
Australian stocks rose for a fifth session; the S&P/ASX 200 index rose 0.4% to close at 7,490.40, led by gains in mining and real estate shares. The benchmark closed at the highest since April 21, extending gains for fifth session. In New Zealand, the S&P/NZX 50 index fell 0.1% to 11,932.92
In FX, the Bloomberg Dollar Spot Index swung to a gain in European session and the greenback rose against all of its Group-of-10 peers apart from the yen and the Swedish krona. The pound fell to the bottom of the G-10 pile after PMI data highlighted the looming risk of a recession in the UK economy. Readings from France and Germany were more mixed but enough to prompt the euro to reverse an earlier advance. Traders position for a series of US data releases and the next meetings by the world’s major central banks, and the dollar meets topside demand through options.
- The euro climbed toward $1.09 only to reverse its gain after Germany’s manufacturing PMI unexpectedly fell. Germany’s composite PMI however came in better than forecast, at 49.7, and the composite for the whole euro zone entered expansionary territory after rising to 50.2, versus expected 49.8. Separately, German February GfK consumer confidence improved to -33.9 versus estimate -33.3
- The pound fell against all of its G-10 peers and gilts outperformed Treasuries and bunds after S&P Global’s UK PMI fell to 47.8 in January from 49 the month before, well below economists’ forecasts for little change
- The yen advanced for the first time in three days and bonds fell. Investors were waiting for the Bank of Japan’s summary of opinions from its January meeting and Tokyo inflation data later this week to see if a further policy change was in store
- Australian sovereign bonds pared opening losses as markets parsed improved National Australia Bank business confidence, instead focusing on how components to business conditions softened. Australian and New Zealand dollars swung to losses in European trading
In rates, Treasuries are slightly richer with yields shedding 1-3bps across the curve, supported by a wider rally in gilts after lower-than-estimated UK PMI services gauge. The 10Y TSY is around 3.50%, richer by 1bp vs Monday’s close while lagging gilts by 2bp in the sector. The risk-off tone has benefited bonds with UK and German benchmarks rising and 10-year borrowing costs falling by 5bps and 2bps respectively. In core European rates gilts outperform in bull-steepening move where front-end and belly yields are richer by 5bp on the day. The US auction cycle begins at 1pm with $42b 2-year note sale, ahead of $43b 5- year and $35b 7-year notes Wednesday and Thursday. Focal points of US session also include January PMIs, along with 2-year note auction, first of this week’s three coupon sales.
In commodities, crude futures are little changed while spot gold rises 0.3% to trade near $1,938/oz.
FBI said two hacker groups associated with North Korea were behind the USD 100mln theft from US crypto firm Harmony Horizon Bridge last June, according to Reuters.
Looking to the day ahead now, the main data highlight will be the January flash PMIs from Europe and the US. Elsewhere, central bank speakers include ECB President Lagarde, along with the ECB’s Knot and Vujcic. Earnings releases include Microsoft, General Electric, Danaher, Johnson & Johnson, Lockheed Martin, Texas Instruments, Union Pacific and Verizon Communications.
Market Snapshot
- S&P 500 futures down 0.1% to 4,031.75
- STOXX Europe 600 down 0.1% to 453.95
- MXAP up 0.6% to 168.43
- MXAPJ little changed at 551.68
- Nikkei up 1.5% to 27,299.19
- Topix up 1.4% to 1,972.92
- Hang Seng Index up 1.8% to 22,044.65
- Shanghai Composite up 0.8% to 3,264.81
- Sensex up 0.1% to 61,016.22
- Australia S&P/ASX 200 up 0.4% to 7,490.40
- Kospi up 0.6% to 2,395.26
- German 10Y yield little changed at 2.18%
- Euro little changed at $1.0867
- Brent Futures down 0.5% to $87.73/bbl
- Gold spot up 0.2% to $1,935.75
- U.S. Dollar Index down 0.11% to 102.03
Top Overnight News From Bloomberg
- The UK government sank deeper into debt in December as rising debt-interest payments and the cost of insulating consumers and businesses from the energy-price shock strained the public finances. The budget deficit stood at £27.4 billion ($34 billion), a record for the month and almost triple the £10.7 billion shortfall a year earlier
- Some UK homes are requested to curb power demand on Tuesday evening as the nation’s grid struggles for a second day to plug the gap left by a drop in wind generation
- The immense wealth coming from Norway’s gas and oil fields is underpinning a new refrain among market experts: it’s time for a big rebound in the krone
A more detailed summary of overnight events courtesy of Newsquawk
Asia-Pacific stocks were positive and took impetus from the tech rally on Wall Street but with trade quiet amid a lack of fresh catalysts and as many participants in the region remained absent with markets in China, Hong Kong, Taiwan, South Korea, Singapore, Malaysia and Vietnam all closed for the holiday. ASX 200 was underpinned by strength in the real estate, tech and mining industries albeit with gains capped after a mixed NAB business survey and soft PMI data which showed a contraction in the manufacturing and services. Nikkei 225 continued its outperformance and climbed above the 27,000 level with the index unaffected by the latest preliminary PMI data in which Manufacturing PMI contracted for the 3rd consecutive month although Services and Composite PMIs improved with the latter back in expansionary territory, while reports also noted that Japan is considering early May for its planned downgrade of COVID policy.
Top Asian News
- US President Biden's Administration reportedly confronted China's government with evidence that suggested some China SOEs may be providing assistance to Russia's war effort, according to Bloomberg.
- The first three days of the Chinese Spring Festival holidays saw bookings for domestic hotel and scenic spots increase by 56% and 79% Y/Y, according to data by online travel agency Tongcheng Travel cited by these Global Times; Domestic air ticket bookings rose by 30%, China's passenger trips via railway, road, waterway and plane amounted 23.53 million on Monday, up 67.7% Y/Y.
- BoJ Governor Kuroda says markets moves are becoming more stable, via Reuters.
European bourses are a touch softer overall, Euro Stoxx 50 -0.2%, and relatively unreactive to better-than-expected EZ Flash PMIs. Albeit, the FTSE 100 -0.4% is lagging slightly following its own PMIs, which point to a particularly grim start to the UK economy for 2023. Stateside, futures are a touch softer but contained overall, ES -0.2% but above 4k, ahead of data points and key earnings including MSFT.
Top European News
- Euro-Area Business Activity Unexpectedly Grows at Start of Year
- Britain and the EU are unlikely to make major changes to the underlying Brexit deal, according to a report by the academic body UK in a Changing Europe cited by Reuters.
- ECB's Nagel said ECB is not done on far too high inflation, according to L'Express; additionally, Villeroy said the ECB probably will reach peak rates by summer.
- Judge Removed From HSBC Dispute Over Loan to Hot Yoga Studio
- UK Homes Asked to Curb Power for Second Day as Wind Fades
- Ukraine Latest: Stoltenberg Confident of Solution on Tanks Soon
Notable data
- EU S&P Global Composite Flash PMI (Jan) 50.2 vs. Exp. 49.8 (Prev. 49.3); “The region is by no means out of the woods yet, however, as demand continues to fall – merely dropping at a reduced rate – and an upturn in the rate of inflation of selling prices for both goods and services will add encouragement to the hawks to push for further monetary policy tightening. The case for higher interest rates is fuelled further by the upturn in employment growth recorded during the month and signs of higher wages driving the latest upturn in price pressures."
- EU S&P Global Manufacturing Flash PMI (Jan) 48.8 vs. Exp. 48.5 (Prev. 47.8); Services Flash PMI (Jan) 50.7 vs. Exp. 50.2 (Prev. 49.8)
- German S&P Global Composite Flash PMI (Jan) 49.7 vs. Exp. 49.6 (Prev. 49.0); Click here for more detail.
- German S&P Global Manufacturing Flash PMI (Jan) 47.0 vs. Exp. 47.9 (Prev. 47.1); Services Flash PMI (Jan) 50.4 vs. Exp. 49.6 (Prev. 49.2)
- UK Flash Composite PMI (Jan) 47.8 vs. Exp. 49.1 (Prev. 49.0): "Jobs also continued to be lost as firms tightened their belts in the face of these headwinds, though many other firms reported being constrained by an ongoing lack of available labour."
- UK Flash Services PMI (Jan) 48.0 vs. Exp. 49.7 (Prev. 49.9); Manufacturing PMI (Jan) 46.7 vs. Exp. 45.5 (Prev. 45.3)
- German GfK Consumer Sentiment (Feb) -33.9 vs. Exp. -33.0 (Prev. -37.8, Rev. -37.6)
FX
- The USD has benefitted from a PMI-induced decline in Sterling, with the DXY lifted to a 102.17 peak and Cable testing 1.23 to the downside.
- In contrast, the EUR was underpinned by Monday's late-doors ECB speak though EUR/USD stalled on a test of 1.09 before contrasting EZ/regional PMIs.
- JPY is the marked outperformer having been below 130.00 against the USD, though it has given back some of this recovery momentum in face of the above USD action.
- CAD is contained pre-BoC with the Antipodeans equally rangebound ahead of inflation data.
- Brazil's Finance Minister Haddad said President Lula and Argentina's President Fernandez requested the creation of a clearing house with a common currency to settle accounts, but added it has no name or deadline and their idea does not seek monetary unification as is the case with the Euro, according to Reuters.
Fixed Income
- EGBs perhaps gleaned initial support on technical factors, though subsequent action was driven by a marked spike in Gilts to near 105.00.
- Much of the UK move was driven by the region's PMI release though subsequent bearish fiscal developments served as a fleeting headwind for Gilts and, to a lesser extent, peers more broadly with Bunds continuing to slip post-PMIs.
- USTs are a touch firmer given the above action and ahead of its own data release and 2yr issuance.
- UK sells GBP 6bln 2053 Gilt via syndication, order book closed in excess of GBP 65bln, according to a bookrunner.
Commodities
- The crude benchmarks are little changed/slightly softer as a GBP-induced lift to the USD weighs on the complex.
- However, WTI and Brent remain underpinned overall by the broader improving demand picture amid the Lunar New Year holiday.
- US is weighing the cancellation of the next SPR sale, according to sources cited by Energy Intel.
- Dubai sets the official crude differential to DME Oman for April at a USD 0.20/bbl discount.
- Norwegian Energy Ministry plans a 2023 APA oil and gas licensing round, adding acreage to the Norwegian and Barents sea.
- 5.4 magnitude earthquake strikes Nepal, via EMSC.
- Spot gold has slipped from its intraday peak given USD action, though the yellow metal continues to glean support from the slightly softer equity tone while LME Copper has slipped from best but remains in proximity to USD 9.5k/T.
Geopolitics
- Russian Chief of the General Staff Gerasimov said the new army plan considers threats such as Finland and Sweden's desire to join NATO, and the use of Ukraine as a tool of hybrid war against Russia, according to TASS.
- Polish Defence Minister said Germany has now received Poland's official request to re-export Leopard tanks to Ukraine; following the German Defence Minister saying there is no new position on the Leopard tanks.
US Event Calendar
- 08:30: Jan. Philadelphia Fed Non-Manufactu, prior -17.1, revised -12.8
- 09:45: Jan. S&P Global US Composite PMI, est. 46.4, prior 45.0
- 09:45: Jan. S&P Global US Services PMI, est. 45.0, prior 44.7
- 09:45: Jan. S&P Global US Manufacturing PM, est. 46.0, prior 46.2
- 10:00: Jan. Richmond Fed Index, est. -5, prior 1
DB's Jim Reid concludes the overnight wrap
Risk assets got the week off to a very strong start yesterday, with the S&P 500 (+1.19%) at a 7-week high as investors awaited a raft of earnings reports over the coming days. However, just as equities were surging to fresh highs for 2023, there were also growing concerns about a potential US recession, with the Conference Board’s leading index for December falling by a larger-than-expected -1.0% (vs. -0.7% expected). So that’s a further negative signal after last week’s downbeat releases on retail sales and industrial production, and one that will increase the focus on today’s flash PMIs for January.
In many respects, this divergence between more positive markets and weak economic data echoes what Jim and I published last week in our “Sweet Spot” note (link here). We pointed out how it was consistent to be tactically positive on risk assets whilst maintaining our (very) bearish view for H2 2023. In essence, since October markets have been less concerned about inflation and where rates might need to go, with terminal pricing for the Fed funds remaining steady around the 5% mark for a few months now. But we also haven’t reached the US recession that we’re forecasting for H2, which is giving markets scope to rally in the meantime. Indeed, we show in the piece this is also consistent with the historic pattern, with the S&P 500 only tending to turn significantly lower a few weeks before the recession on average.
When it came to that release from the Conference Board, the -1.0% decline in December marked the 10th successive monthly decline for the leading index. Furthermore, it means that it’s now down -6.0% on a year-on-year basis, the most since June 2020. Bear in mind that on every other occasion the index has been down by that amount in a single year, the US economy has either been in a recession or was just emerging from one. So clearly not a positive sign by historic standards.
For the time being at least, investors put aside their caution on a recession, with equities seeing a strong rally on both sides of the Atlantic. Tech stocks led the advance, which continues their very strong performance in January so far. The NASDAQ was up +2.01%, thus bringing its YTD gains to +8.58%. Meanwhile the FANG+ index of megacap tech stocks saw even larger gains, with a +4.03% advance that brought its own YTD performance to +14.80%, and puts it on track for its best monthly performance since August 2020. After the close there was a Bloomberg report that the US Justice Department was set to sue Google’s parent company Alphabet as soon as today about their digital ad dominance. Alphabet shares were down -0.9% in after-market trading, but futures for the NASDAQ 100 more broadly saw little reaction, and are only down -0.02% this morning. Elsewhere, the cyclical sectors outperformed in line with the risk-on tone for the day, but there was a broader underperformance in Europe, with the STOXX 600 only up +0.52%.
Whilst equities were buoyant, sovereign bonds lost ground amidst the risk-off tone, with yields on 10yr Treasuries up by +3.1bps yesterday to 3.51%, followed up by a +0.7bps move overnight to 3.52% as we go to print. That was echoed in Europe too, with yields on 10yr bunds (+2.9bps), OATs (+3.2bps) and BTPs (+3.4bps) seeing similar rises of their own. Those moves came as there was some pushback from ECB speakers about the idea of slowing their rate hikes down from 50bps after the February meeting, with Slovakia’s Kazimir saying yesterday that “we need to deliver two more 50 basis-point moves”. After the close, we also heard from President Lagarde, who said that “We will stay the course to ensure the timely return of inflation to our target”.
Looking forward, the main highlight today will be the flash PMIs for January, since they’ll provide an initial steer on how the global economy is performing into 2023. Last month both the US and the Eurozone composite PMIs were in contractionary territory, thus adding to fears about a potential recession. However, the year so far has brought some relatively good news, with European natural gas currently around its lowest in over a year, alongside clear signs that consumer confidence has begun to recover. When it comes to the PMIs, our European economists think the positive impact of easing uncertainty is more likely to come in services than manufacturing.
Overnight, we’ve already had some initial PMI numbers from Japan and Australia, which have added to that picture that the global economy might be faring worse than feared. Starting with Japan, the composite PMI moved back into expansionary territory at 50.8, following two months beneath the 50 mark. The manufacturing PMI did remain in contractionary territory at 48.9, but services saw a stronger move higher to 52.4. Meanwhile in Australia, there was also a rise in the composite PMI overnight to 48.2 (vs. 47.5 previously), so still in contractionary territory but a change from three consecutive declines in the PMI.
Those more positive PMI releases along with the US equity rally has boosted sentiment in Asian markets this morning, with the Nikkei (+1.52%) as well as the S&P/ASX 200 (+0.44%) both trading in positive territory. However, several major markets across the region remained closed for the Lunar New year holiday. Elsewhere, equity futures suggest that US stocks will hold onto yesterday’s gains, with those on the S&P 500 basically stable at +0.02%.
Otherwise yesterday, there was a fair amount of optimism across different asset classes. For instance, Brent crude oil closed above $88/bbl for the first time in 2023 (+0.64% yesterday), which is a decent jump after trading beneath $78/bbl at the lows around the start of the month. Elsewhere, Bloomberg’s index of US financial conditions showed they were at their most accommodative levels since last February. And we also saw the Euro move above $1.09 in trading for the first time since April, before closing back at $1.087.
Finally in other data yesterday, the European Commission’s preliminary consumer confidence indicator for the Euro Area in January rose to -20.9 (vs. -20.0 expected). That was beneath expectations, but still the strongest that reading has been since last February.
To the day ahead now, and the main data highlight will be the January flash PMIs from Europe and the US. Elsewhere, central bank speakers include ECB President Lagarde, along with the ECB’s Knot and Vujcic. Earnings releases include Microsoft, General Electric, Danaher, Johnson & Johnson, Lockheed Martin, Texas Instruments, Union Pacific and Verizon Communications.
Uncategorized
February Employment Situation
By Paul Gomme and Peter Rupert The establishment data from the BLS showed a 275,000 increase in payroll employment for February, outpacing the 230,000…
Share this:


By Paul Gomme and Peter Rupert
The establishment data from the BLS showed a 275,000 increase in payroll employment for February, outpacing the 230,000 average over the previous 12 months. The payroll data for January and December were revised down by a total of 167,000. The private sector added 223,000 new jobs, the largest gain since May of last year.

Temporary help services employment continues a steep decline after a sharp post-pandemic rise.


Average hours of work increased from 34.2 to 34.3. The increase, along with the 223,000 private employment increase led to a hefty increase in total hours of 5.6% at an annualized rate, also the largest increase since May of last year.

The establishment report, once again, beat “expectations;” the WSJ survey of economists was 198,000. Other than the downward revisions, mentioned above, another bit of negative news was a smallish increase in wage growth, from $34.52 to $34.57.

The household survey shows that the labor force increased 150,000, a drop in employment of 184,000 and an increase in the number of unemployed persons of 334,000. The labor force participation rate held steady at 62.5, the employment to population ratio decreased from 60.2 to 60.1 and the unemployment rate increased from 3.66 to 3.86. Remember that the unemployment rate is the number of unemployed relative to the labor force (the number employed plus the number unemployed). Consequently, the unemployment rate can go up if the number of unemployed rises holding fixed the labor force, or if the labor force shrinks holding the number unemployed unchanged. An increase in the unemployment rate is not necessarily a bad thing: it may reflect a strong labor market drawing “marginally attached” individuals from outside the labor force. Indeed, there was a 96,000 decline in those workers.


Earlier in the week, the BLS announced JOLTS (Job Openings and Labor Turnover Survey) data for January. There isn’t much to report here as the job openings changed little at 8.9 million, the number of hires and total separations were little changed at 5.7 million and 5.3 million, respectively.

As has been the case for the last couple of years, the number of job openings remains higher than the number of unemployed persons.

Also earlier in the week the BLS announced that productivity increased 3.2% in the 4th quarter with output rising 3.5% and hours of work rising 0.3%.

The bottom line is that the labor market continues its surprisingly (to some) strong performance, once again proving stronger than many had expected. This strength makes it difficult to justify any interest rate cuts soon, particularly given the recent inflation spike.
unemployment pandemic unemploymentUncategorized
Mortgage rates fall as labor market normalizes
Jobless claims show an expanding economy. We will only be in a recession once jobless claims exceed 323,000 on a four-week moving average.
Share this:


Everyone was waiting to see if this week’s jobs report would send mortgage rates higher, which is what happened last month. Instead, the 10-year yield had a muted response after the headline number beat estimates, but we have negative job revisions from previous months. The Federal Reserve’s fear of wage growth spiraling out of control hasn’t materialized for over two years now and the unemployment rate ticked up to 3.9%. For now, we can say the labor market isn’t tight anymore, but it’s also not breaking.
The key labor data line in this expansion is the weekly jobless claims report. Jobless claims show an expanding economy that has not lost jobs yet. We will only be in a recession once jobless claims exceed 323,000 on a four-week moving average.
From the Fed: In the week ended March 2, initial claims for unemployment insurance benefits were flat, at 217,000. The four-week moving average declined slightly by 750, to 212,250
Below is an explanation of how we got here with the labor market, which all started during COVID-19.
1. I wrote the COVID-19 recovery model on April 7, 2020, and retired it on Dec. 9, 2020. By that time, the upfront recovery phase was done, and I needed to model out when we would get the jobs lost back.
2. Early in the labor market recovery, when we saw weaker job reports, I doubled and tripled down on my assertion that job openings would get to 10 million in this recovery. Job openings rose as high as to 12 million and are currently over 9 million. Even with the massive miss on a job report in May 2021, I didn’t waver.
Currently, the jobs openings, quit percentage and hires data are below pre-COVID-19 levels, which means the labor market isn’t as tight as it once was, and this is why the employment cost index has been slowing data to move along the quits percentage.

3. I wrote that we should get back all the jobs lost to COVID-19 by September of 2022. At the time this would be a speedy labor market recovery, and it happened on schedule, too
Total employment data
4. This is the key one for right now: If COVID-19 hadn’t happened, we would have between 157 million and 159 million jobs today, which would have been in line with the job growth rate in February 2020. Today, we are at 157,808,000. This is important because job growth should be cooling down now. We are more in line with where the labor market should be when averaging 140K-165K monthly. So for now, the fact that we aren’t trending between 140K-165K means we still have a bit more recovery kick left before we get down to those levels.

From BLS: Total nonfarm payroll employment rose by 275,000 in February, and the unemployment rate increased to 3.9 percent, the U.S. Bureau of Labor Statistics reported today. Job gains occurred in health care, in government, in food services and drinking places, in social assistance, and in transportation and warehousing.
Here are the jobs that were created and lost in the previous month:

In this jobs report, the unemployment rate for education levels looks like this:
- Less than a high school diploma: 6.1%
- High school graduate and no college: 4.2%
- Some college or associate degree: 3.1%
- Bachelor’s degree or higher: 2.2%

Today’s report has continued the trend of the labor data beating my expectations, only because I am looking for the jobs data to slow down to a level of 140K-165K, which hasn’t happened yet. I wouldn’t categorize the labor market as being tight anymore because of the quits ratio and the hires data in the job openings report. This also shows itself in the employment cost index as well. These are key data lines for the Fed and the reason we are going to see three rate cuts this year.
recession unemployment covid-19 fed federal reserve mortgage rates recession recovery unemploymentUncategorized
Inside The Most Ridiculous Jobs Report In History: Record 1.2 Million Immigrant Jobs Added In One Month
Inside The Most Ridiculous Jobs Report In History: Record 1.2 Million Immigrant Jobs Added In One Month
Last month we though that the January…
Share this:


Last month we though that the January jobs report was the "most ridiculous in recent history" but, boy, were we wrong because this morning the Biden department of goalseeked propaganda (aka BLS) published the February jobs report, and holy crap was that something else. Even Goebbels would blush.
What happened? Let's take a closer look.
On the surface, it was (almost) another blockbuster jobs report, certainly one which nobody expected, or rather just one bank out of 76 expected. Starting at the top, the BLS reported that in February the US unexpectedly added 275K jobs, with just one research analyst (from Dai-Ichi Research) expecting a higher number.
Some context: after last month's record 4-sigma beat, today's print was "only" 3 sigma higher than estimates. Needless to say, two multiple sigma beats in a row used to only happen in the USSR... and now in the US, apparently.

Before we go any further, a quick note on what last month we said was "the most ridiculous jobs report in recent history": it appears the BLS read our comments and decided to stop beclowing itself. It did that by slashing last month's ridiculous print by over a third, and revising what was originally reported as a massive 353K beat to just 229K, a 124K revision, which was the biggest one-month negative revision in two years!

Of course, that does not mean that this month's jobs print won't be revised lower: it will be, and not just that month but every other month until the November election because that's the only tool left in the Biden admin's box: pretend the economic and jobs are strong, then revise them sharply lower the next month, something we pointed out first last summer and which has not failed to disappoint once.
In the past month the Biden department of goalseeking stuff higher before revising it lower, has revised the following data sharply lower:
— zerohedge (@zerohedge) August 30, 2023
- Jobs
- JOLTS
- New Home sales
- Housing Starts and Permits
- Industrial Production
- PCE and core PCE
To be fair, not every aspect of the jobs report was stellar (after all, the BLS had to give it some vague credibility). Take the unemployment rate, after flatlining between 3.4% and 3.8% for two years - and thus denying expectations from Sahm's Rule that a recession may have already started - in February the unemployment rate unexpectedly jumped to 3.9%, the highest since February 2022 (with Black unemployment spiking by 0.3% to 5.6%, an indicator which the Biden admin will quickly slam as widespread economic racism or something).

And then there were average hourly earnings, which after surging 0.6% MoM in January (since revised to 0.5%) and spooking markets that wage growth is so hot, the Fed will have no choice but to delay cuts, in February the number tumbled to just 0.1%, the lowest in two years...

... for one simple reason: last month's average wage surge had nothing to do with actual wages, and everything to do with the BLS estimate of hours worked (which is the denominator in the average wage calculation) which last month tumbled to just 34.1 (we were led to believe) the lowest since the covid pandemic...

... but has since been revised higher while the February print rose even more, to 34.3, hence why the latest average wage data was once again a product not of wages going up, but of how long Americans worked in any weekly period, in this case higher from 34.1 to 34.3, an increase which has a major impact on the average calculation.

While the above data points were examples of some latent weakness in the latest report, perhaps meant to give it a sheen of veracity, it was everything else in the report that was a problem starting with the BLS's latest choice of seasonal adjustments (after last month's wholesale revision), which have gone from merely laughable to full clownshow, as the following comparison between the monthly change in BLS and ADP payrolls shows. The trend is clear: the Biden admin numbers are now clearly rising even as the impartial ADP (which directly logs employment numbers at the company level and is far more accurate), shows an accelerating slowdown.

But it's more than just the Biden admin hanging its "success" on seasonal adjustments: when one digs deeper inside the jobs report, all sorts of ugly things emerge... such as the growing unprecedented divergence between the Establishment (payrolls) survey and much more accurate Household (actual employment) survey. To wit, while in January the BLS claims 275K payrolls were added, the Household survey found that the number of actually employed workers dropped for the third straight month (and 4 in the past 5), this time by 184K (from 161.152K to 160.968K).

This means that while the Payrolls series hits new all time highs every month since December 2020 (when according to the BLS the US had its last month of payrolls losses), the level of Employment has not budged in the past year. Worse, as shown in the chart below, such a gaping divergence has opened between the two series in the past 4 years, that the number of Employed workers would need to soar by 9 million (!) to catch up to what Payrolls claims is the employment situation.

There's more: shifting from a quantitative to a qualitative assessment, reveals just how ugly the composition of "new jobs" has been. Consider this: the BLS reports that in February 2024, the US had 132.9 million full-time jobs and 27.9 million part-time jobs. Well, that's great... until you look back one year and find that in February 2023 the US had 133.2 million full-time jobs, or more than it does one year later! And yes, all the job growth since then has been in part-time jobs, which have increased by 921K since February 2023 (from 27.020 million to 27.941 million).

Here is a summary of the labor composition in the past year: all the new jobs have been part-time jobs!

But wait there's even more, because now that the primary season is over and we enter the heart of election season and political talking points will be thrown around left and right, especially in the context of the immigration crisis created intentionally by the Biden administration which is hoping to import millions of new Democratic voters (maybe the US can hold the presidential election in Honduras or Guatemala, after all it is their citizens that will be illegally casting the key votes in November), what we find is that in February, the number of native-born workers tumbled again, sliding by a massive 560K to just 129.807 million. Add to this the December data, and we get a near-record 2.4 million plunge in native-born workers in just the past 3 months (only the covid crash was worse)!

The offset? A record 1.2 million foreign-born (read immigrants, both legal and illegal but mostly illegal) workers added in February!

Said otherwise, not only has all job creation in the past 6 years has been exclusively for foreign-born workers...

... but there has been zero job-creation for native born workers since June 2018!

This is a huge issue - especially at a time of an illegal alien flood at the southwest border...

... and is about to become a huge political scandal, because once the inevitable recession finally hits, there will be millions of furious unemployed Americans demanding a more accurate explanation for what happened - i.e., the illegal immigration floodgates that were opened by the Biden admin.
Which is also why Biden's handlers will do everything in their power to insure there is no official recession before November... and why after the election is over, all economic hell will finally break loose. Until then, however, expect the jobs numbers to get even more ridiculous.


Wendy’s has a new deal for daylight savings time haters


Watch Live: President Biden Reminds Americans Just How Good They’ve Got It Thanks To Him


Mortgage rates fall as labor market normalizes


Racial and Ethnic Wealth Inequality in the Post‑Pandemic Era


Wealth Inequality by Age in the Post‑Pandemic Era


Watch: President Biden Delivers The “Darkest, Most Un-American Speech Given By A President”


Shipping company files surprise Chapter 7 bankruptcy, liquidation


Interest rates, the best it gets. It’s time to deploy cash


Is the biotech market rally real? Data suggest comeback in private, public markets


February Employment Situation
-

 Uncategorized2 weeks ago
All Of The Elements Are In Place For An Economic Crisis Of Staggering Proportions
-

 Uncategorized1 month ago
Cathie Wood sells a major tech stock (again)
-

 Uncategorized3 weeks ago
California Counties Could Be Forced To Pay $300 Million To Cover COVID-Era Program
-

 Uncategorized2 weeks ago
Apparel Retailer Express Moving Toward Bankruptcy
-

 Uncategorized3 weeks ago
Industrial Production Decreased 0.1% in January
-

 International1 day ago
Walmart launches clever answer to Target’s new membership program
-

 Uncategorized3 weeks ago
RFK Jr: The Wuhan Cover-Up & The Rise Of The Biowarfare-Industrial Complex
-

 Uncategorized3 weeks ago
GOP Efforts To Shore Up Election Security In Swing States Face Challenges