Connect with us

Uncategorized

Explaining the 2022-23 Disinflation Out-of-Sample

In tomorrow’s lecture on the Phillips Curve and the recent inflation surge for Econ 442, I ask whether a modifed Blanchard-Cerutti-Summers (2015) Phillips…

Published

on

In tomorrow’s lecture on the Phillips Curve and the recent inflation surge for Econ 442, I ask whether a modifed Blanchard-Cerutti-Summers (2015) Phillips Curve specification can predict the disinflation. Answer: Yes.

BCS use:

I modify by (1) unconstraining the coefficients on expected and lagged y/y inflation, (2) using lagged y/y core instead of headline CPI, (3) using the relative inflation rate of oil instead of imported materials, and/or (4) adding the NY Fed’s Global Supply Chain Pressure Index (GSCPI). I then estimate 1998-2019 (the sample dictated by availability of the GSCPI, and avoiding the pandemic):

Augmenting with GSCPI.

The unemployment gap comes in with the right sign, albeit not statistically significantly so. Oil price inflation is quite significant, as is the GSCPI. Note the impact of the GSCPI comes in a sample that predates the covid pandemic.

Using these two regressions to conduct out of sample predictions, I obtain the following:

Figure 1: Quarter-on-Quarter CPI inflation annualized (bold black), out-of-sample fit from modified BCS regression (tan), and from modified BCS regression augmented with GSCPI (green). NBER defined peak-to-trough recession dates shaded gray. Source: BLS, NBER, and author’s calculations.

Mean Error (RMSE) for the w/oil specification is 1.3%(1.4%) and for the w/oil, GSCPI is -1.0%(1.2%), with 12 observations 2021Q1-2023Q4.

The fact that the GSCPI-augmented equation predicts the inflation and disinflation better than the oil-alone specification suggests to me that the unexpected (by some) persistence of inflation is due to the unanticipated disruptions in supply chains.


Read More

Continue Reading

Uncategorized

Altered brain morphology and functional connectivity in postmenopausal women

“[…] our findings suggest that diminished brain volume and functional connectivity may be linked to menopause-related symptoms caused by the lower…

Published

on

“[…] our findings suggest that diminished brain volume and functional connectivity may be linked to menopause-related symptoms caused by the lower sex hormone levels.”

Credit: 2024 Kim et al.

“[…] our findings suggest that diminished brain volume and functional connectivity may be linked to menopause-related symptoms caused by the lower sex hormone levels.”

BUFFALO, NY- April 1, 2024 – A new research paper was published on the cover of Aging (listed by MEDLINE/PubMed as “Aging (Albany NY)” and “Aging-US” by Web of Science) Volume 16, Issue 6, entitled, “Altered brain morphology and functional connectivity in postmenopausal women: automatic segmentation of whole-brain and thalamic subnuclei and resting-state fMRI.”

The transition to menopause is associated with various physiological changes, including alterations in brain structure and function. However, menopause-related structural and functional changes are poorly understood. In this new study, researchers Gwang-Won Kim, Kwangsung Park, Yun-Hyeon Kim, and Gwang-Woo Jeong from Chonnam National University not only compared the brain volume changes between premenopausal and postmenopausal women, but also evaluated the functional connectivity between the targeted brain regions associated with structural atrophy in postmenopausal women. 

“To the best of our knowledge, no comparative neuroimaging study on alterations in the brain volume and functional connectivity, especially focusing on the thalamic subnuclei in premenopausal vs. postmenopausal women has been reported.”

Each of the 21 premenopausal and postmenopausal women underwent magnetic resonance imaging (MRI). T1-weighted MRI and resting-state functional MRI data were used to compare the brain volume and seed-based functional connectivity, respectively. In statistical analysis, multivariate analysis of variance, with age and whole brain volume as covariates, was used to evaluate surface areas and subcortical volumes between the two groups. 

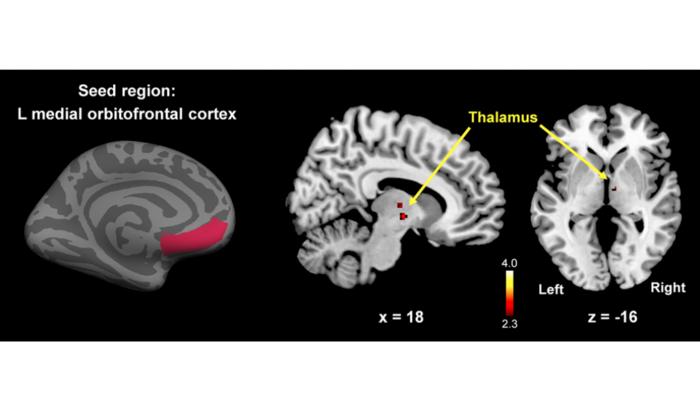
Postmenopausal women showed significantly smaller cortical surface, especially in the left medial orbitofrontal cortex (mOFC), right superior temporal cortex, and right lateral orbitofrontal cortex, compared to premenopausal women (p

“Postmenopausal women showed significantly lower left mOFC, right lOFC, and right STC surface areas, reduced right PuA volume, and decreased left mOFC-right thalamus functional connectivity compared to premenopausal women. If replicated in an independent sample, these findings will be helpful for understanding the effects of menopause on the altered brain volume and functional connectivity in postmenopausal women.”
 

Read the full study: DOI: https://doi.org/10.18632/aging.205662 

Corresponding Author: Gwang-Woo Jeong gwjeong@jnu.ac.kr 

Keywords: brain morphology, functional connectivity, sex hormones, thalamic subnuclei

Click here to sign up for free Altmetric alerts about this article.
 

About Aging:

Aging publishes research papers in all fields of aging research including but not limited, aging from yeast to mammals, cellular senescence, age-related diseases such as cancer and Alzheimer’s diseases and their prevention and treatment, anti-aging strategies and drug development and especially the role of signal transduction pathways such as mTOR in aging and potential approaches to modulate these signaling pathways to extend lifespan. The journal aims to promote treatment of age-related diseases by slowing down aging, validation of anti-aging drugs by treating age-related diseases, prevention of cancer by inhibiting aging. Cancer and COVID-19 are age-related diseases.

Aging is indexed by PubMed/Medline (abbreviated as “Aging (Albany NY)”), PubMed Central, Web of Science: Science Citation Index Expanded (abbreviated as “Aging‐US” and listed in the Cell Biology and Geriatrics & Gerontology categories), Scopus (abbreviated as “Aging” and listed in the Cell Biology and Aging categories), Biological Abstracts, BIOSIS Previews, EMBASE, META (Chan Zuckerberg Initiative) (2018-2022), and Dimensions (Digital Science).

Please visit our website at www.Aging-US.com​​ and connect with us:

  • Facebook
  • X, formerly Twitter
  • Instagram
  • YouTube
  • LinkedIn
  • Reddit
  • Pinterest
  • Spotify, and available wherever you listen to podcasts


Click here to subscribe to Aging publication updates.

For media inquiries, please contact media@impactjournals.com.


Aging (Aging-US) Journal Office

6666 E. Quaker Str., Suite 1B

Orchard Park, NY 14127

Phone: 1-800-922-0957, option 1

###


Read More

Continue Reading

Uncategorized

A smaller airport wants to change its name to get more people to fly there

A local official said that it is intended to “improve travelers’ geographic awareness” of the airport.

Published

on

While the city of Oakland has been popularized by musical legends such as Tupac Shakur and MC Hammer, the Bay Area city often lacks recognition as a place that one can fly into.

While it has an airport which serves different parts of the U.S. as well as multiple international destinations, Metropolitan Oakland International Airport (OAK) often gets eclipsed by the much larger San Francisco International Airport (SFO) which sits across the bay and is only a 30-minute drive away. The two airports are also equidistant from downtown San Francisco.

Related: New California Airport Ban Will Completely Change How You Travel

In order to encourage more visitors to consider their airport as an option for flying into San Francisco, officials for the city of Oakland announced that they are mulling over whether to add “San Francisco Bay” into its name — without it, tourists from outside the area might not realize how near it is to the city when searching for their flights and browsing options.

A Spirit Airlines plane prepares to take off from Oakland International Airport in Oakland, California.

Justin Sullivan/Getty Images

New name would ‘improve travelers’ geographic awareness’

“Adding ‘San Francisco Bay’ to the name will improve travelers’ geographic awareness of the airport and help us reach and succeed in new markets,” Barbara Leslie, who heads the Oakland Board of Commissioners, said in a statement to the press.

More Travel:

While considered a secondary airport served primarily by low-cost airlines, OAK has been expanding fast post-pandemic and currently serves 46 destinations. The same officials have also been petitioning for airlines to add more routes from the city in order to bring more economic activity to Oakland. 

According to Leslie, at least one-third of American travelers and even more international ones do not associate the name Oakland with proximity to San Francisco while the two airports are both within a 20-minute drive from the city.

‘Routes have not performed as well as they should…’

As a result, Port of Oakland Commissioners will weigh in on whether adding “San Francisco Bay Area” to the airport’s name makes sense at their monthly meeting on April 11. They will then be able to proceed with any “formal renaming, including working with air carriers, other airports and local agencies to reflect the modification in airport and airline systems” — while the change needs to be voted in and formally approved, the phrasing sounds like most are onboard and it is more or less a done decision. 

The city also said that this could help protect “over 30,000 good-paying, direct jobs” and bring “$1.6 billion in economic impact on the region” both through airport use itself and the larger number of travelers who become interested in Oakland and decide to spend some time exploring its historic downtown as a result of flying through it.

“Market research and interviews with airline partners have shown that routes have not performed as well as they should have due to the lack of geographic awareness, making air carriers reluctant to sustain and add new routes in Oakland,” Craig Simon, who is the current interim aviation director for the Port of Oakland, said in a further statement. “From July 2008 to March 2024, the Airport added 54 new routes; 39 of these and 6 pre-existing destinations were lost.”

Read More

Continue Reading

Uncategorized

Manufacturing PMIs Mixed On Growth But Both See Prices Soaring

Manufacturing PMIs Mixed On Growth But Both See Prices Soaring

‘Hard’ data has been soaring since the start of the year – as ‘soft’ data collapses…

Published

on

Manufacturing PMIs Mixed On Growth But Both See Prices Soaring

'Hard' data has been soaring since the start of the year - as 'soft' data collapses - so all eyes are on this morning's Manufacturing PMIs (surveys) for an end to that trend.

Source: Bloomberg

But, of course, there is normally something for everyone in this data as last month saw ISM's data tumble while S&P Global's soared. Both were expected to improve marginally in March final data today.

ISM's Manufacturing PMI surprised to the upside, rising from 47.8 to 50.3, better than the 48.4 expected (breaking a 15-month streak below 50).

But, S&P Global's US Manufacturing PMI disappointed, falling from its 'flash' print of 52.5 to 51.9 - also down from the final print of 52.2 in February (with prices .

Source: Bloomberg

However, a common theme from both surveys was that of soaring prices!!

S&P Global noted that higher oil and raw material costs, plus increased transportation rates, reportedly added to cost burdens at the end of the first quarter... and the impact of rising labor costs was mentioned as a factor pushing up selling prices at a number of manufacturers.

Employment remains in contraction for the sixth straight month and Prices Paid surged to its highest since July 2022...

Source: Bloomberg

Chris Williamson, Chief Business Economist at S&P Global Market Intelligence, said:

“The final reading of the S&P Global Manufacturing PMI signaled a further encouraging improvement in business conditions in March, adding to signs that the US economy looks to have expanded at a solid pace again in the first quarter.

“A key development in recent months has been the broadening-out of the upturn from services to manufacturing, with reviving demand for goods driving the fastest increase in factory production since May 2022. Jobs growth has also picked up as firms boost capacity to meet demand. Rising capex spending has likewise buoyed orders for machinery and equipment, in a further sign of firms gaining confidence in the outlook.

But the 'improvement' comes at a cost:

“The upturn is, however, being accompanied by some strengthening of pricing power. Average selling prices charged by producers rose at the fastest rate for 11 months in March as factories passed higher costs on to customers, with the rate of inflation running well above the average recorded prior to the pandemic.

Most notable was an especially steep rise in prices charged for consumer goods, which rose at a pace not seen for 16 months, underscoring the likely bumpy path in bringing inflation down to the Fed's 2% target.”

So slower growth and much faster inflation - that does not sound like a recipe for rate-cuts... in fact quite the opposite.

Tyler Durden Mon, 04/01/2024 - 10:05

Read More

Continue Reading

Trending