Uncategorized
A smaller airport wants to change its name to get more people to fly there
A local official said that it is intended to “improve travelers’ geographic awareness” of the airport.
Share this:


While the city of Oakland has been popularized by musical legends such as Tupac Shakur and MC Hammer, the Bay Area city often lacks recognition as a place that one can fly into.
While it has an airport which serves different parts of the U.S. as well as multiple international destinations, Metropolitan Oakland International Airport (OAK) often gets eclipsed by the much larger San Francisco International Airport (SFO) which sits across the bay and is only a 30-minute drive away. The two airports are also equidistant from downtown San Francisco.
Related: New California Airport Ban Will Completely Change How You Travel
In order to encourage more visitors to consider their airport as an option for flying into San Francisco, officials for the city of Oakland announced that they are mulling over whether to add “San Francisco Bay” into its name — without it, tourists from outside the area might not realize how near it is to the city when searching for their flights and browsing options.
New name would ‘improve travelers’ geographic awareness’
“Adding ‘San Francisco Bay’ to the name will improve travelers’ geographic awareness of the airport and help us reach and succeed in new markets,” Barbara Leslie, who heads the Oakland Board of Commissioners, said in a statement to the press.
More Travel:
- A new travel term is taking over the internet (and reaching airlines and hotels)
- The 10 best airline stocks to buy now
- Airlines see a new kind of traveler at the front of the plane
While considered a secondary airport served primarily by low-cost airlines, OAK has been expanding fast post-pandemic and currently serves 46 destinations. The same officials have also been petitioning for airlines to add more routes from the city in order to bring more economic activity to Oakland.
According to Leslie, at least one-third of American travelers and even more international ones do not associate the name Oakland with proximity to San Francisco while the two airports are both within a 20-minute drive from the city.
‘Routes have not performed as well as they should…’
As a result, Port of Oakland Commissioners will weigh in on whether adding “San Francisco Bay Area” to the airport’s name makes sense at their monthly meeting on April 11. They will then be able to proceed with any “formal renaming, including working with air carriers, other airports and local agencies to reflect the modification in airport and airline systems” — while the change needs to be voted in and formally approved, the phrasing sounds like most are onboard and it is more or less a done decision.
The city also said that this could help protect “over 30,000 good-paying, direct jobs” and bring “$1.6 billion in economic impact on the region” both through airport use itself and the larger number of travelers who become interested in Oakland and decide to spend some time exploring its historic downtown as a result of flying through it.
“Market research and interviews with airline partners have shown that routes have not performed as well as they should have due to the lack of geographic awareness, making air carriers reluctant to sustain and add new routes in Oakland,” Craig Simon, who is the current interim aviation director for the Port of Oakland, said in a further statement. “From July 2008 to March 2024, the Airport added 54 new routes; 39 of these and 6 pre-existing destinations were lost.”
stocks pandemicUncategorized
Manufacturing PMIs Mixed On Growth But Both See Prices Soaring
Manufacturing PMIs Mixed On Growth But Both See Prices Soaring
‘Hard’ data has been soaring since the start of the year – as ‘soft’ data collapses…
Share this:

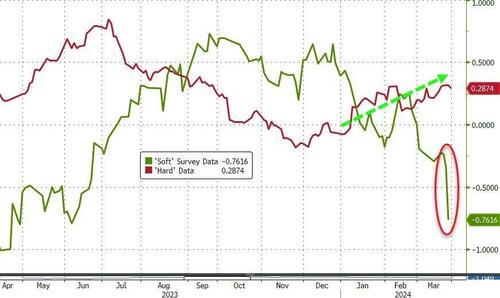
'Hard' data has been soaring since the start of the year - as 'soft' data collapses - so all eyes are on this morning's Manufacturing PMIs (surveys) for an end to that trend.
Source: Bloomberg
But, of course, there is normally something for everyone in this data as last month saw ISM's data tumble while S&P Global's soared. Both were expected to improve marginally in March final data today.
ISM's Manufacturing PMI surprised to the upside, rising from 47.8 to 50.3, better than the 48.4 expected (breaking a 15-month streak below 50).
But, S&P Global's US Manufacturing PMI disappointed, falling from its 'flash' print of 52.5 to 51.9 - also down from the final print of 52.2 in February (with prices .
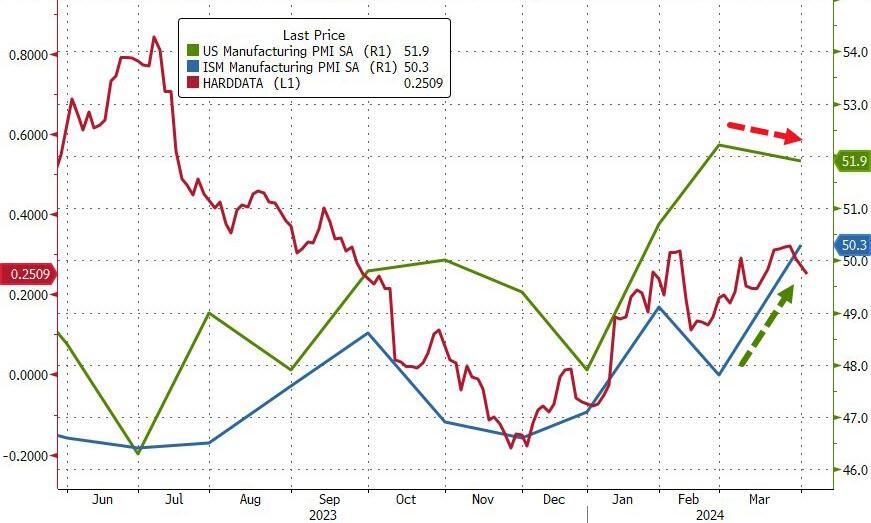
Source: Bloomberg
However, a common theme from both surveys was that of soaring prices!!
S&P Global noted that higher oil and raw material costs, plus increased transportation rates, reportedly added to cost burdens at the end of the first quarter... and the impact of rising labor costs was mentioned as a factor pushing up selling prices at a number of manufacturers.
Employment remains in contraction for the sixth straight month and Prices Paid surged to its highest since July 2022...
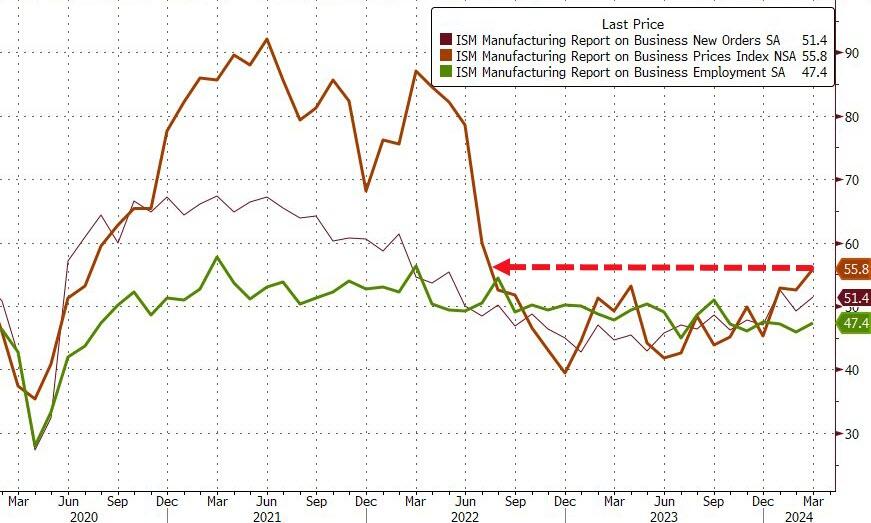
Source: Bloomberg
Chris Williamson, Chief Business Economist at S&P Global Market Intelligence, said:
“The final reading of the S&P Global Manufacturing PMI signaled a further encouraging improvement in business conditions in March, adding to signs that the US economy looks to have expanded at a solid pace again in the first quarter.
“A key development in recent months has been the broadening-out of the upturn from services to manufacturing, with reviving demand for goods driving the fastest increase in factory production since May 2022. Jobs growth has also picked up as firms boost capacity to meet demand. Rising capex spending has likewise buoyed orders for machinery and equipment, in a further sign of firms gaining confidence in the outlook.
But the 'improvement' comes at a cost:
“The upturn is, however, being accompanied by some strengthening of pricing power. Average selling prices charged by producers rose at the fastest rate for 11 months in March as factories passed higher costs on to customers, with the rate of inflation running well above the average recorded prior to the pandemic.
Most notable was an especially steep rise in prices charged for consumer goods, which rose at a pace not seen for 16 months, underscoring the likely bumpy path in bringing inflation down to the Fed's 2% target.”
So slower growth and much faster inflation - that does not sound like a recipe for rate-cuts... in fact quite the opposite.
Uncategorized
Gross Domestic Income Shows America Is In Stagnation
Gross Domestic Income Shows America Is In Stagnation
Authored by Daniel Lacalle,
In a recent CNN poll, 48% of respondents stated that they…
Share this:


In a recent CNN poll, 48% of respondents stated that they believe the economy remains in a downturn, and only 35% said that things in the country today are going well. The disparity between somber economic sentiment and a surprisingly strong headline unemployment rate and Gross Domestic Product (GDP) can be easily explained.
The divergence between headline GDP and Gross Domestic Income (GDI) is staggering. While GDP suggests a strong economy, GDI reveals a stagnant economy. Both measures used to follow a similar pattern, but this changed drastically in 2023. While GDP rose 2.5% in 2023, GDI only bounced 0.5%, effectively signaling economic stagnation.
According to the Bureau of Economic Analysis, real GDI increased only 0.5% in 2023, compared with an increase of 2.1% in 2022. If we use the average of real GDP and real GDI, it increased only 1.5% in 2023, compared with an increase of 2.0% in 2022. Not a recession, but certainly a weak economy.
The unemployment figures show weakness as well. Real wage growth in the past four years has been negligible, at 0.7% per year, four times weaker than the previous four years. Furthermore, the labor force participation rate remains below the pre-pandemic level at 62.5%, the same as the employment-population ratio at 60.1%. Poor real average hourly earnings combined with a decrease of 0.6% in the average workweek resulted in an uninspiring 0.5% increase in real average weekly earnings in the year to February 2024.
There is also a weak trend in profits. In 2023, profits from current production (corporate profits with inventory valuation and capital consumption adjustments) increased $49.3 billion, compared with an increase of $285.9 billion in 2022, according to the BEA. Profits of domestic nonfinancial corporations increased $66.6 billion, compared with an increase of $247.6 billion in 2022. This is a very weak trend.
All these figures indicate that the US economy is performing significantly better than the euro area, but it is still far below expectations.
Keynesianism is working against the potential of the United States economy. The accumulated $6.3 trillion deficit of the past four years had a negative impact on the economy. Rising taxes and persistent inflation are eroding the average American quality of life. More citizens need to hold more than one job to make ends meet, and the number of multiple jobholders has reached a multi-decade record.
Gross Domestic Income proves the economy is stagnant, and if we look at GDP and GDI excluding the accumulation of debt, they show the worst year since the 1930s.
How can an economy be stagnant with 2.5% GDP growth? Here is the failure of Keynesianism in all its glory. Headline aggregated figures are optically strong due to the accumulation of debt, and employment figures are bloated by government jobs, disguising a struggling private sector and a weakening purchasing power of the currency.
Cheap money is very expensive in the long run, and discontent rises as Keynesianism focuses on increasing the public sector while the productive economy suffers higher taxes and more challenges to pay the bills.
Inflation is a consequence of the misguided increase in government spending and debt monetization in the middle of a post-pandemic recovery, leading to an aggregate loss of purchasing power of the currency that is close to 24% in the past four years. The government is taking in inflation what it promises in entitlement spending. The result? You are poorer.
It is dangerous to blame Americans’ discontent on a lack of information.
Americans are suffering a prohibitive tax wedge as well as the hidden tax of inflation just because the government decided to play the oldest trick in the book: promise “free stuff” and print new currency through deficit spending, which makes the allegedly free programs more expensive than ever.
The failure of Keynesianism is evident. Sadly, politicians will promise more Keynesianism and present themselves as the solution to the problem they have created.
Uncategorized
Map Reveals ‘Great Migration’ Population Shift Over Last Three Years
Map Reveals ‘Great Migration’ Population Shift Over Last Three Years
The virus pandemic, the rise of remote and hybrid work, and a surge in…
Share this:

The virus pandemic, the rise of remote and hybrid work, and a surge in violent crime across progressive cities have significantly influenced the migration patterns of Americans over the past several years.
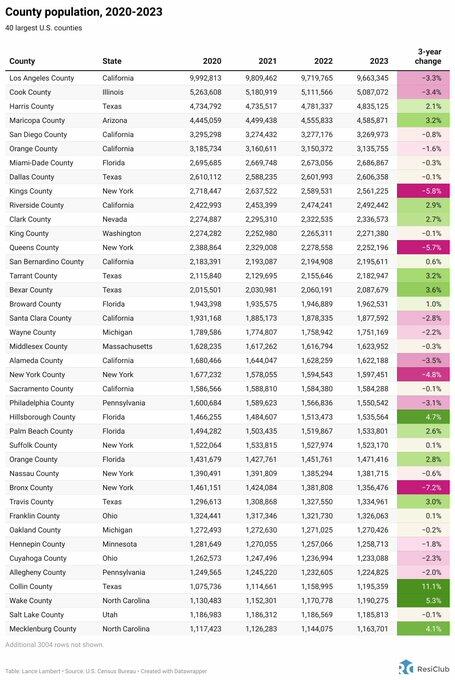
A new report from real estate research firm ResiClub sheds more color on the migration trends, this time on a county-by-county basis. It reveals which counties in the US gained and or lost the most population between April 1, 2020, and July 1, 2023, citing data from the US Census Bureau.
ResiClub founder Lance Lambert wrote on X that the "US Southeast, Mountain West, East/central Texas" had counties with some of the largest population gains over the period. Conversely, the counties based in California, the North and South Great Plains, parts of the Inland Midwest, and the inland Northeast had some of the most significant outflows.
This map shows which counties have gained—and lost—population since 2020
— ResiClub (@ResidentialClub) March 30, 2024
????????
ResiClub PRO | Access to the interactive map + searchable chart for +3,000 counties: https://t.co/BYLDGWN9KW pic.twitter.com/7UjxRdBfWp
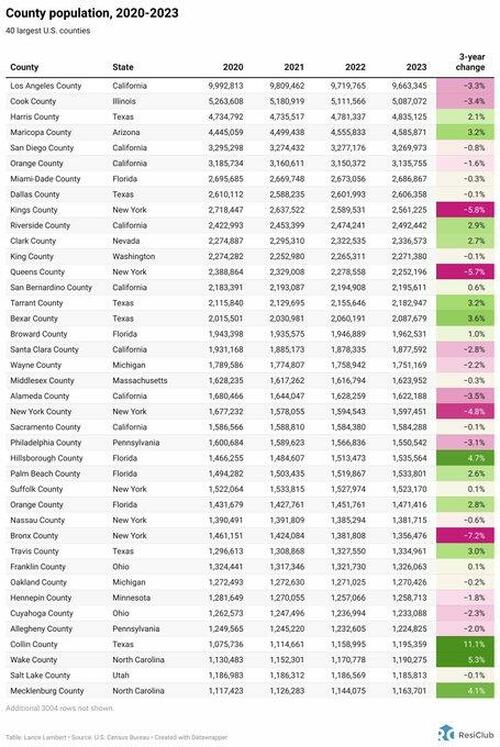
Lambert posted a list of the top 40 counties with the largest population shifts over the period.
Top Three Counties With Largest Population Increase:
- Collin, Texas
- Wake County, North Carolina
- Hillsborough, Florida
Top Three Counties With Largest Population Decrease:
- Bronx County, New York
- Kings County, New York
- Queens County, New York
We assume this data has not captured the illegal migration shifts as millions of illegal aliens invade the US via open southern borders and flood progressive cities.


Gross Domestic Income Shows America Is In Stagnation


Why the S&P 500 is getting 2 new members this week


Manufacturing PMIs Mixed On Growth But Both See Prices Soaring


Costco brings back a food court fan favorite


Map Reveals ‘Great Migration’ Population Shift Over Last Three Years


A smaller airport wants to change its name to get more people to fly there
-

 Spread & Containment3 weeks ago
IFM’s Hat Trick and Reflections On Option-To-Buy M&A
-

 International1 week ago
Parexel CEO to retire; CAR-T maker AffyImmune promotes business leader to chief executive
-

 International3 weeks ago
EyePoint poaches medical chief from Apellis; Sandoz CFO, longtime BioNTech exec to retire
-

 International3 weeks ago
Walmart launches clever answer to Target’s new membership program
-

 Uncategorized4 weeks ago
Evidence And Insights About Gold’s Long-Term Uptrend
-

 Uncategorized1 month ago
A Global, Digital Coup d’État
-

 International1 week ago
Japanese Preprint Calls For mRNA VaccinesTo Be Suspended Over Blood Bank Contamination Concerns
-

 Uncategorized4 weeks ago
When Complex Systems Collide