Uncategorized
Essential retailer files for bankruptcy, stores will close
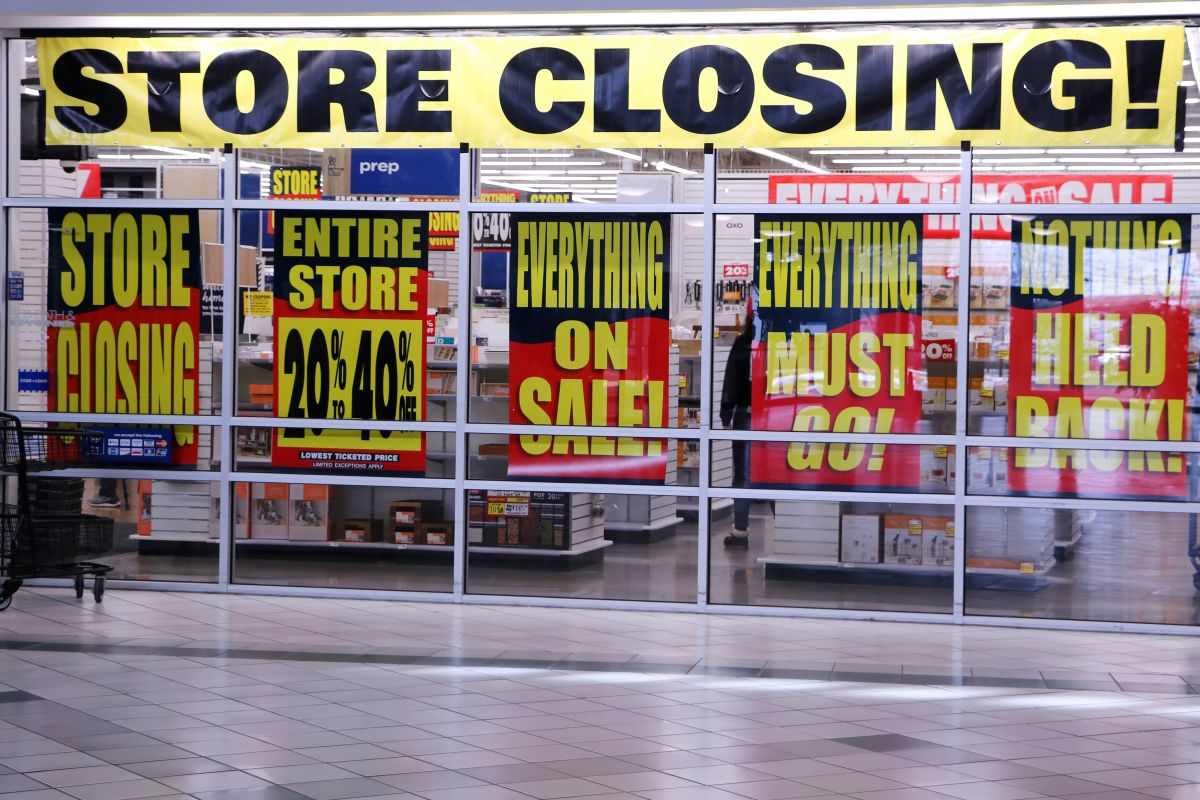
A retail store chain relied on by millions of shoppers will close stores after filing for Chapter 11 bankruptcy.
Share this:

Retail store chains that file for Chapter 11 bankruptcy can suffer from damaged vendor relationships that cause empty shelves, limited access to capital needed to pay landlords and wages, and a damaged reputation that keeps shoppers away. It can also cause store closures, leaving customers in the lurch.
For these reasons, filing for bankruptcy reorganization is a retailer’s last option. Nevertheless, bankruptcy has become increasingly common because of fierce competition from e-commerce stores like Amazon (AMZN) - Get Free Report and big-box retailers like Walmart (WMT) - Get Free Report and Costco Wholesale (COST) - Get Free Report.
Shoppers can usually find the items they buy at those stores when retailers close because of bankruptcy. However, that task is more challenging when the retailer filing for Chapter 11 bankruptcy sells essential items not readily available elsewhere.
Brick-and-mortar retailers face stiff competition.
Sears had 700 stores when it filed for bankruptcy in 2018. Nowadays, it operates fewer than 20 stores after reemerging from Chapter 11 bankruptcy in 2022.
Bed Bath & Beyond had over 1,500 stores in 2018, but less than 300 when it went bankrupt earlier this year.
Related: Bankruptcy could force this popular retailer to close 500 stores
The success of large brick-and-mortar stores like Walmart and Costco and e-commerce alternatives like Amazon are a big reason behind those failures.
Walmart’s annual revenue surged from over $450 billion to $611 billion over the past decade. Costco’s revenue has more than doubled to $242 billion, and Amazon’s sales have increased from $74 billion to over $500 billion.
Those sales have come at the expense of other retailers less able to compete on price and convenience due to impaired balance sheets, buying power, or both.
A mountain of debt takes its toll
Rite Aid (RAD) - Get Free Report is the latest retailer to declare bankruptcy. It has similarly lost sales because of increasing competition from these larger competitors.
Walmart is the fifth largest company, and Costco Wholesale is the 11th largest company ranked by prescription market share. Meanwhile, Amazon is pushing more deeply into pharmacy by offering online prescriptions.
Competition isn't the only reason why Rite Aid sought bankruptcy protection from creditors on Oct 15.
Rite Aid also filed for bankruptcy to insulate itself against a lawsuit that could cost it over one billion dollars to settle.
More bankruptcy:
- Well-liked retailer makes surprise return from bankruptcy
- This alarming statistic suggests a favorite retailer is in trouble
- These two big-name retailers face a huge bankruptcy risk
The Department of Justice filed a civil suit against Rite Aid in March, alleging pharmacists “repeatedly filled prescriptions for controlled substances with obvious red flags" and that it "intentionally deleted internal notes about suspicious prescribers.”
The company was already struggling before the Department of Justice alleged it inappropriately filled opioid prescriptions, contributing to the opioid epidemic.
Revenue at the 2,300-store retail pharmacy chain slumped 6% from one year ago during the June quarter, despite millions of shoppers relying on it to fill prescriptions or buy everyday items, like aspirin, vitamins, and toothpaste, every week.
Slumping sales couldn't have happened at a worse time for the company. Its interest expense on over $3.3 billion in debt has soared 35% to $65 million per quarter because of rising interest rates.
That extra burden, plus higher costs, increased theft, and goodwill write-downs on past acquisitions led to staggering losses exceeding $300 million in the quarter and full-year guidance for losses eclipsing $4.78 per share.
Those losses left Rite Aid with little wiggle room to negotiate a settlement with the Justice Department, given Walgreens Boots (WBA) - Get Free Report and CVS Health (CVS) - Get Free Report settled similar suits for $5.7 billion and $4.9 billion in the past year.
Rite Aid's decision to file for bankruptcy protection is based on restructuring plan negotiated with creditors that includes store closures.
“In connection with the court-supervised process, the Company will continue assessing its footprint and close additional underperforming stores. These efforts will further reduce the Company’s rent expense and are expected to strengthen its overall financial performance,” said Rite Aid in a statement announcing the bankruptcy news.
Rite Aid hasn't said which stores will close yet, but the Wall Street Journal previously reported the company could shutter up to 500 locations.
Stores that don't close will remain in operation via a $3.45 billion debtor-in-possession financing agreement with lenders.
“Rite Aid has received a commitment for $3.45 billion in new financing from certain of its lenders. This financing is expected to provide sufficient liquidity to support the Company throughout this process,” according to the statement.
The bankruptcy filing follows the receipt of a non-compliance letter from the New York Stock Exchange on Oct. 4 due to its shares trading below $1 and its market cap being below $50 million. The company was given a short window of time to get shares back above those thresholds before being delisted, further pressuring management into its decision.
Sign up to find out what stocks we're buying now (Rite Aid isn't one of them!)
bankruptcy stocks interest ratesUncategorized
Mortgage rates fall as labor market normalizes
Jobless claims show an expanding economy. We will only be in a recession once jobless claims exceed 323,000 on a four-week moving average.
Share this:


Everyone was waiting to see if this week’s jobs report would send mortgage rates higher, which is what happened last month. Instead, the 10-year yield had a muted response after the headline number beat estimates, but we have negative job revisions from previous months. The Federal Reserve’s fear of wage growth spiraling out of control hasn’t materialized for over two years now and the unemployment rate ticked up to 3.9%. For now, we can say the labor market isn’t tight anymore, but it’s also not breaking.
The key labor data line in this expansion is the weekly jobless claims report. Jobless claims show an expanding economy that has not lost jobs yet. We will only be in a recession once jobless claims exceed 323,000 on a four-week moving average.
From the Fed: In the week ended March 2, initial claims for unemployment insurance benefits were flat, at 217,000. The four-week moving average declined slightly by 750, to 212,250
Below is an explanation of how we got here with the labor market, which all started during COVID-19.
1. I wrote the COVID-19 recovery model on April 7, 2020, and retired it on Dec. 9, 2020. By that time, the upfront recovery phase was done, and I needed to model out when we would get the jobs lost back.
2. Early in the labor market recovery, when we saw weaker job reports, I doubled and tripled down on my assertion that job openings would get to 10 million in this recovery. Job openings rose as high as to 12 million and are currently over 9 million. Even with the massive miss on a job report in May 2021, I didn’t waver.
Currently, the jobs openings, quit percentage and hires data are below pre-COVID-19 levels, which means the labor market isn’t as tight as it once was, and this is why the employment cost index has been slowing data to move along the quits percentage.

3. I wrote that we should get back all the jobs lost to COVID-19 by September of 2022. At the time this would be a speedy labor market recovery, and it happened on schedule, too
Total employment data
4. This is the key one for right now: If COVID-19 hadn’t happened, we would have between 157 million and 159 million jobs today, which would have been in line with the job growth rate in February 2020. Today, we are at 157,808,000. This is important because job growth should be cooling down now. We are more in line with where the labor market should be when averaging 140K-165K monthly. So for now, the fact that we aren’t trending between 140K-165K means we still have a bit more recovery kick left before we get down to those levels.

From BLS: Total nonfarm payroll employment rose by 275,000 in February, and the unemployment rate increased to 3.9 percent, the U.S. Bureau of Labor Statistics reported today. Job gains occurred in health care, in government, in food services and drinking places, in social assistance, and in transportation and warehousing.
Here are the jobs that were created and lost in the previous month:

In this jobs report, the unemployment rate for education levels looks like this:
- Less than a high school diploma: 6.1%
- High school graduate and no college: 4.2%
- Some college or associate degree: 3.1%
- Bachelor’s degree or higher: 2.2%

Today’s report has continued the trend of the labor data beating my expectations, only because I am looking for the jobs data to slow down to a level of 140K-165K, which hasn’t happened yet. I wouldn’t categorize the labor market as being tight anymore because of the quits ratio and the hires data in the job openings report. This also shows itself in the employment cost index as well. These are key data lines for the Fed and the reason we are going to see three rate cuts this year.
recession unemployment covid-19 fed federal reserve mortgage rates recession recovery unemploymentUncategorized
Inside The Most Ridiculous Jobs Report In History: Record 1.2 Million Immigrant Jobs Added In One Month
Inside The Most Ridiculous Jobs Report In History: Record 1.2 Million Immigrant Jobs Added In One Month
Last month we though that the January…
Share this:


Last month we though that the January jobs report was the "most ridiculous in recent history" but, boy, were we wrong because this morning the Biden department of goalseeked propaganda (aka BLS) published the February jobs report, and holy crap was that something else. Even Goebbels would blush.
What happened? Let's take a closer look.
On the surface, it was (almost) another blockbuster jobs report, certainly one which nobody expected, or rather just one bank out of 76 expected. Starting at the top, the BLS reported that in February the US unexpectedly added 275K jobs, with just one research analyst (from Dai-Ichi Research) expecting a higher number.
Some context: after last month's record 4-sigma beat, today's print was "only" 3 sigma higher than estimates. Needless to say, two multiple sigma beats in a row used to only happen in the USSR... and now in the US, apparently.

Before we go any further, a quick note on what last month we said was "the most ridiculous jobs report in recent history": it appears the BLS read our comments and decided to stop beclowing itself. It did that by slashing last month's ridiculous print by over a third, and revising what was originally reported as a massive 353K beat to just 229K, a 124K revision, which was the biggest one-month negative revision in two years!

Of course, that does not mean that this month's jobs print won't be revised lower: it will be, and not just that month but every other month until the November election because that's the only tool left in the Biden admin's box: pretend the economic and jobs are strong, then revise them sharply lower the next month, something we pointed out first last summer and which has not failed to disappoint once.
In the past month the Biden department of goalseeking stuff higher before revising it lower, has revised the following data sharply lower:
— zerohedge (@zerohedge) August 30, 2023
- Jobs
- JOLTS
- New Home sales
- Housing Starts and Permits
- Industrial Production
- PCE and core PCE
To be fair, not every aspect of the jobs report was stellar (after all, the BLS had to give it some vague credibility). Take the unemployment rate, after flatlining between 3.4% and 3.8% for two years - and thus denying expectations from Sahm's Rule that a recession may have already started - in February the unemployment rate unexpectedly jumped to 3.9%, the highest since February 2022 (with Black unemployment spiking by 0.3% to 5.6%, an indicator which the Biden admin will quickly slam as widespread economic racism or something).

And then there were average hourly earnings, which after surging 0.6% MoM in January (since revised to 0.5%) and spooking markets that wage growth is so hot, the Fed will have no choice but to delay cuts, in February the number tumbled to just 0.1%, the lowest in two years...

... for one simple reason: last month's average wage surge had nothing to do with actual wages, and everything to do with the BLS estimate of hours worked (which is the denominator in the average wage calculation) which last month tumbled to just 34.1 (we were led to believe) the lowest since the covid pandemic...

... but has since been revised higher while the February print rose even more, to 34.3, hence why the latest average wage data was once again a product not of wages going up, but of how long Americans worked in any weekly period, in this case higher from 34.1 to 34.3, an increase which has a major impact on the average calculation.

While the above data points were examples of some latent weakness in the latest report, perhaps meant to give it a sheen of veracity, it was everything else in the report that was a problem starting with the BLS's latest choice of seasonal adjustments (after last month's wholesale revision), which have gone from merely laughable to full clownshow, as the following comparison between the monthly change in BLS and ADP payrolls shows. The trend is clear: the Biden admin numbers are now clearly rising even as the impartial ADP (which directly logs employment numbers at the company level and is far more accurate), shows an accelerating slowdown.

But it's more than just the Biden admin hanging its "success" on seasonal adjustments: when one digs deeper inside the jobs report, all sorts of ugly things emerge... such as the growing unprecedented divergence between the Establishment (payrolls) survey and much more accurate Household (actual employment) survey. To wit, while in January the BLS claims 275K payrolls were added, the Household survey found that the number of actually employed workers dropped for the third straight month (and 4 in the past 5), this time by 184K (from 161.152K to 160.968K).

This means that while the Payrolls series hits new all time highs every month since December 2020 (when according to the BLS the US had its last month of payrolls losses), the level of Employment has not budged in the past year. Worse, as shown in the chart below, such a gaping divergence has opened between the two series in the past 4 years, that the number of Employed workers would need to soar by 9 million (!) to catch up to what Payrolls claims is the employment situation.

There's more: shifting from a quantitative to a qualitative assessment, reveals just how ugly the composition of "new jobs" has been. Consider this: the BLS reports that in February 2024, the US had 132.9 million full-time jobs and 27.9 million part-time jobs. Well, that's great... until you look back one year and find that in February 2023 the US had 133.2 million full-time jobs, or more than it does one year later! And yes, all the job growth since then has been in part-time jobs, which have increased by 921K since February 2023 (from 27.020 million to 27.941 million).

Here is a summary of the labor composition in the past year: all the new jobs have been part-time jobs!

But wait there's even more, because now that the primary season is over and we enter the heart of election season and political talking points will be thrown around left and right, especially in the context of the immigration crisis created intentionally by the Biden administration which is hoping to import millions of new Democratic voters (maybe the US can hold the presidential election in Honduras or Guatemala, after all it is their citizens that will be illegally casting the key votes in November), what we find is that in February, the number of native-born workers tumbled again, sliding by a massive 560K to just 129.807 million. Add to this the December data, and we get a near-record 2.4 million plunge in native-born workers in just the past 3 months (only the covid crash was worse)!

The offset? A record 1.2 million foreign-born (read immigrants, both legal and illegal but mostly illegal) workers added in February!

Said otherwise, not only has all job creation in the past 6 years has been exclusively for foreign-born workers...

... but there has been zero job-creation for native born workers since June 2018!

This is a huge issue - especially at a time of an illegal alien flood at the southwest border...

... and is about to become a huge political scandal, because once the inevitable recession finally hits, there will be millions of furious unemployed Americans demanding a more accurate explanation for what happened - i.e., the illegal immigration floodgates that were opened by the Biden admin.
Which is also why Biden's handlers will do everything in their power to insure there is no official recession before November... and why after the election is over, all economic hell will finally break loose. Until then, however, expect the jobs numbers to get even more ridiculous.
Uncategorized
Economic Earthquake Ahead? The Cracks Are Spreading Fast
Economic Earthquake Ahead? The Cracks Are Spreading Fast
Authored by Brandon Smith via Alt-Market.us,
One of my favorite false narratives…
Share this:


Authored by Brandon Smith via Alt-Market.us,
One of my favorite false narratives floating around corporate media platforms has been the argument that the American people “just don’t seem to understand how good the economy really is right now.” If only they would look at the stats, they would realize that we are in the middle of a financial renaissance, right? It must be that people have been brainwashed by negative press from conservative sources…
I have to laugh at this notion because it’s a very common one throughout history – it’s an assertion made by almost every single political regime right before a major collapse. These people always say the same things, and when you study economics as long as I have you can’t help but throw up your hands and marvel at their dedication to the propaganda.
One example that comes to mind immediately is the delusional optimism of the “roaring” 1920s and the lead up to the Great Depression. At the time around 60% of the U.S. population was living in poverty conditions (according to the metrics of the decade) earning less than $2000 a year. However, in the years after WWI ravaged Europe, America’s economic power was considered unrivaled.
The 1920s was an era of mass production and rampant consumerism but it was all fueled by easy access to debt, a condition which had not really existed before in America. It was this illusion of prosperity created by the unchecked application of credit that eventually led to the massive stock market bubble and the crash of 1929. This implosion, along with the Federal Reserve’s policy of raising interest rates into economic weakness, created a black hole in the U.S. financial system for over a decade.
There are two primary tools that various failing regimes will often use to distort the true conditions of the economy: Debt and inflation. In the case of America today, we are experiencing BOTH problems simultaneously and this has made certain economic indicators appear healthy when they are, in fact, highly unstable. The average American knows this is the case because they see the effects everyday. They see the damage to their wallets, to their buying power, in the jobs market and in their quality of life. This is why public faith in the economy has been stuck in the dregs since 2021.
The establishment can flash out-of-context stats in people’s faces, but they can’t force the populace to see a recovery that simply does not exist. Let’s go through a short list of the most faulty indicators and the real reasons why the fiscal picture is not a rosy as the media would like us to believe…
The “miracle” labor market recovery
In the case of the U.S. labor market, we have a clear example of distortion through inflation. The $8 trillion+ dropped on the economy in the first 18 months of the pandemic response sent the system over the edge into stagflation land. Helicopter money has a habit of doing two things very well: Blowing up a bubble in stock markets and blowing up a bubble in retail. Hence, the massive rush by Americans to go out and buy, followed by the sudden labor shortage and the race to hire (mostly for low wage part-time jobs).
The problem with this “miracle” is that inflation leads to price explosions, which we have already experienced. The average American is spending around 30% more for goods, services and housing compared to what they were spending in 2020. This is what happens when you have too much money chasing too few goods and limited production.
The jobs market looks great on paper, but the majority of jobs generated in the past few years are jobs that returned after the covid lockdowns ended. The rest are jobs created through monetary stimulus and the artificial retail rush. Part time low wage service sector jobs are not going to keep the country rolling for very long in a stagflation environment. The question is, what happens now that the stimulus punch bowl has been removed?
Just as we witnessed in the 1920s, Americans have turned to debt to make up for higher prices and stagnant wages by maxing out their credit cards. With the central bank keeping interest rates high, the credit safety net will soon falter. This condition also goes for businesses; the same businesses that will jump headlong into mass layoffs when they realize the party is over. It happened during the Great Depression and it will happen again today.
Cracks in the foundation
We saw cracks in the narrative of the financial structure in 2023 with the banking crisis, and without the Federal Reserve backstop policy many more small and medium banks would have dropped dead. The weakness of U.S. banks is offset by the relative strength of the U.S. dollar, which lures in foreign investors hoping to protect their wealth using dollar denominated assets.
But something is amiss. Gold and bitcoin have rocketed higher along with economically sensitive assets and the dollar. This is the opposite of what’s supposed to happen. Gold and BTC are supposed to be hedges against a weak dollar and a weak economy, right? If global faith in the dollar and in the U.S. economy is so high, why are investors diving into protective assets like gold?
Again, as noted above, inflation distorts everything.
Tens of trillions of extra dollars printed by the Fed are floating around and it’s no surprise that much of that cash is flooding into the economy which simply pushes higher right along with prices on the shelf. But, gold and bitcoin are telling us a more honest story about what’s really happening.
Right now, the U.S. government is adding around $600 billion per month to the national debt as the Fed holds rates higher to fight inflation. This debt is going to crush America’s financial standing for global investors who will eventually ask HOW the U.S. is going to handle that growing millstone? As I predicted years ago, the Fed has created a perfect Catch-22 scenario in which the U.S. must either return to rampant inflation, or, face a debt crisis. In either case, U.S. dollar-denominated assets will lose their appeal and their prices will plummet.
“Healthy” GDP is a complete farce
GDP is the most common out-of-context stat used by governments to convince the citizenry that all is well. It is yet another stat that is entirely manipulated by inflation. It is also manipulated by the way in which modern governments define “economic activity.”
GDP is primarily driven by spending. Meaning, the higher inflation goes, the higher prices go, and the higher GDP climbs (to a point). Eventually prices go too high, credit cards tap out and spending ceases. But, for a short time inflation makes GDP (as well as retail sales) look good.
Another factor that creates a bubble is the fact that government spending is actually included in the calculation of GDP. That’s right, every dollar of your tax money that the government wastes helps the establishment by propping up GDP numbers. This is why government spending increases will never stop – It’s too valuable for them to spend as a way to make the economy appear healthier than it is.
The REAL economy is eclipsing the fake economy
The bottom line is that Americans used to be able to ignore the warning signs because their bank accounts were not being directly affected. This is over. Now, every person in the country is dealing with a massive decline in buying power and higher prices across the board on everything – from food and fuel to housing and financial assets alike. Even the wealthy are seeing a compression to their profit and many are struggling to keep their businesses in the black.
The unfortunate truth is that the elections of 2024 will probably be the turning point at which the whole edifice comes tumbling down. Even if the public votes for change, the system is already broken and cannot be repaired without a complete overhaul.
We have consistently avoided taking our medicine and our disease has gotten worse and worse.
People have lost faith in the economy because they have not faced this kind of uncertainty since the 1930s. Even the stagflation crisis of the 1970s will likely pale in comparison to what is about to happen. On the bright side, at least a large number of Americans are aware of the threat, as opposed to the 1920s when the vast majority of people were utterly conned by the government, the banks and the media into thinking all was well. Knowing is the first step to preparing.
The second step is securing your own financial future – that’s where physical precious metals can play a role. Diversifying your savings with inflation-resistant, uninflatable assets whose intrinsic value doesn’t rely on a counterparty’s promise to pay adds resilience to your savings. That’s the main reason physical gold and silver have been the safe haven store-of-value assets of choice for centuries (among both the elite and the everyday citizen).
* * *
As the world moves away from dollars and toward Central Bank Digital Currencies (CBDCs), is your 401(k) or IRA really safe? A smart and conservative move is to diversify into a physical gold IRA. That way your savings will be in something solid and enduring. Get your FREE info kit on Gold IRAs from Birch Gold Group. No strings attached, just peace of mind. Click here to secure your future today.


Wendy’s has a new deal for daylight savings time haters


Watch Live: President Biden Reminds Americans Just How Good They’ve Got It Thanks To Him


Watch: President Biden Delivers The “Darkest, Most Un-American Speech Given By A President”


Is the biotech market rally real? Data suggest comeback in private, public markets


Mortgage rates fall as labor market normalizes


People Who Received Ivermectin Were Better Off, Study Finds


These Are The 5 Charts The FDIC Does Not Want You Paying Attention To


Interest rates, the best it gets. It’s time to deploy cash


COVID-19 May Lead To Persistent Cognitive Impairment, Brain Fog, And Lower IQ Scores


Stock Market’s Top Will Outlast Your Disbelief
-

 Uncategorized2 weeks ago
All Of The Elements Are In Place For An Economic Crisis Of Staggering Proportions
-

 Uncategorized1 month ago
Cathie Wood sells a major tech stock (again)
-

 Uncategorized3 weeks ago
California Counties Could Be Forced To Pay $300 Million To Cover COVID-Era Program
-

 Uncategorized2 weeks ago
Apparel Retailer Express Moving Toward Bankruptcy
-

 Uncategorized3 weeks ago
Industrial Production Decreased 0.1% in January
-

 International20 hours ago
Walmart launches clever answer to Target’s new membership program
-

 Uncategorized3 weeks ago
RFK Jr: The Wuhan Cover-Up & The Rise Of The Biowarfare-Industrial Complex
-

 Uncategorized3 weeks ago
GOP Efforts To Shore Up Election Security In Swing States Face Challenges