Government
Brussels Begins To Mobilise Its Mass Censorship Regime For Upcoming EU Elections
Brussels Begins To Mobilise Its Mass Censorship Regime For Upcoming EU Elections
Authored by Nick Corbishley via NakedCapitalism.com,
This…
Share this:


Authored by Nick Corbishley via NakedCapitalism.com,
This is the culmination of a process that began at least a decade ago.
One of the most important (albeit least reported) developments of 2023 was the launch of the European Union’s Digital Services Act (DSA), which came into full effect in late August and which we covered in the article, The EU’s Mass Censorship Regime Is Almost Fully Operational. Will It Go Global? The goal of the DSA is to combat — i.e., suppress — mis- and disinformation online, not just in Europe but potentially across the world and is part of a broader trend of Western governments actively pushing to censor information on the Internet as they gradually lose control over the narrative.
Here’s how it works: so-called Very Large Online Platforms (VLOPs) and Search Engines (VLSEs) — those with more than 45 million active monthly users in the EU — are required to censor content hosted on their platforms deemed to be illegal by removing it, blocking it, or providing certain information to the authorities concerned. Platforms are also required to tackle hate speech, dis- or misinformation if it is deemed to have “actual or foreseeable negative effects on civic discourse and electoral processes, and public security” and/or “actual or foreseeable negative effects in relation to gender-based violence, the protection of public health and minors and serious negative consequences to the person’s physical and mental well-being.”
Besides take-downs and outright suspensions, other familiar tools at the disposal of tech platforms include de-monetisation, content demotion, shadow-banning and account visibility filtering. The European Commission has primary, but not exclusive, regulatory responsibility for VLOPs and VLOSEs. The same requirements now also apply to all other online service providers, though responsibility for execution and enforcement lies not with the Commission but national authorities.
Staying Mum
So far, the platforms, including even Elon Musk’s X, appear to be adhering to the EU’s rules on disinformation. If they weren’t, they could face serious economic consequences, including fines of up to 6% of global turnover, as well as the looming threat of warrantless inspections of company premises. The X platform (formerly known as Twitter) may have left the EU’s voluntary code of practice last summer and in December was hit with a probe over disinformation related to Hamas’s October 7 attack, but its actions — or rather lack of actions — since then suggest it is indeed complying with the rules.
As Robert Kogon reports for Brownstone Institute, (granted, not the most popular source of information on NC, but this is another solid, well researched piece by Kogon on a topic virtually no one else is talking about), “while Musk and the Twitter Files are so verbose about alleged ‘US government censorship,'” they “have remained suitably mum about EU censorship demands”:
[I]t is strictly impossible that Twitter has not had and is not continuing to have contact – indeed extensive and regular contact – with EU officials about censoring content and accounts that the European Commission deems “mis-” or “disinformation.” But we have heard absolutely nothing about this in the “Twitter Files.”
Why? The answer is: because EU censorship really is government censorship, i.e. censorship that Twitter is required to carry out on pain of sanction. This is the difference between the EU censorship and what Elon Musk himself has denounced as “US government censorship.” The latter has amounted to nudges and requests, but was never obligatory and could never be obligatory, thanks to the First Amendment and the fact that there has never been any enforcement mechanism. Any law creating such an enforcement mechanism would be obviously unconstitutional. Hence, Twitter could always simply say no…
Far from any sign of defiance of the Code and the DSA, what we get from Elon Musk is repeated pledges of fealty: like the below tweet that he posted after meeting with EU Internal Market Commissioner Thierry Breton in January. (For an earlier such pledge in the form of a joint video message with Breton, see here.)
Now, the European Commission has its sights set on the EU’s parliamentary elections, to be held in June. “Integrity of election[s] is one of my top priorities for DSA enforcement, as we are entering a period of elections in Europe,” Breton the Enforcer told Politico last September.
Elections in Slovakia in September were supposed to offer a dummy run, but the results were underwhelming, at least as far as the Commission was concerned. The left-wing populist and social conservative party, Direction–Social Democracy (Smer-SD), led by former Prime Minister Robert Fico, took the largest number of votes and was able to form a coalition government with like-minded parties. Fico had promised to cut all aid to Ukraine, which he says is governed by neo-Nazis, as well as block its ascension to NATO.
The Commission is determined to up its game, however. Last week, it published a set of guidelines for Big Tech firms to help Brussels “secure” the upcoming elections from foreign interference and other threats. The guidelines recommend “mitigation measures and best practices to be undertaken by Very Large Online Platforms and Search Engines before, during, and after electoral events,” and are explained as necessary in order to prevent things like fake news, turnout suppression, cyber threats and attacks, and, of course, Russia’s malign influence on European public opinion, particularly regarding Ukraine.
“In the European Union we speak about the Kremlin, which is very successful in creating narratives which can influence the voting preferences of the people,” said EU Vice-President for Values and Transparency, Věra Jourová, in a recent interview with the Atlantic Council, a neocon think tank that knows a thing or two about disinformation having played a leading role in the ProporNot fiasco that baselessly outed hundreds of alternative news websites as Russian propagandists including this one. “And lying, just lies… Disinformation in order to influence elections in a way that the people in Europe will stop to support (sic) Ukraine.”
List of Demands
Here is, word for word, the full list of the EU’s demands for the platforms, interspersed with a few observations and speculations of my own (italicised and in brackets). The platforms are instructed to:
“Reinforce their internal processes, including by setting up internal teams with adequate resources, using available analysis and information on local context-specific risks and on the use of their services by users to search and obtain information before, during and after elections, to improve their mitigation measures.”
(This may sound eerily familiar to the US government’s censorship efforts revealed by the Twitter files, but there is a key difference: the processes in the US were largely covert and informal, with nothing in the way of legal consequences in the case of non-compliance. By contrast, the EU’s DSA ensures that the processes are not just overt and legally authorised, they are backed up with the very real threat of substantial economic sanctions).
“Implement elections-specific risk mitigation measures tailored to each individual electoral period and local context. Among the mitigation measures included in the guidelines, Very Large Online Platforms and Search Engines should promote official information on electoral processes, implement media literacy initiatives, and adapt their recommender systems to empower users and reduce the monetisation and virality of content that threatens the integrity of electoral processes. Moreover, political advertising should be clearly labelled as such, in anticipation of the new regulation on the transparency and targeting of political advertising.”
(The first sentence serves as a reminder that these processes will be applied not only to EU elections. As the Commission’s announcement on X makes clear, it also plans to “protect the integrity” of 17 national or local elections across Europe this year. What about elections in other regions of the world? For example, the US’ general election in November, on which so much rests, including quite possibly the future of NATO. Clearly, the European Commission and the national governments of many EU member states have a vested interest in trying to prevent another Trump triumph).
“Adopt specific mitigation measures linked to generative AI: Very Large Online Platforms and Search Engines whose services could be used to create and/or disseminate generative AI content should assess and mitigate specific risks linked to AI, for example by clearly labelling content generated by AI (such as deepfakes), adapting their terms and conditions accordingly and enforcing them adequately.”
(The EU has just passed its AI Act, one of whose ostensible purposes is to tackle the threat posed by AI-generated videos and other recordings. As high-quality deep fakes are becoming harder to desire, this is a growing challenge. For the moment, the Commission is relying on the DSA to address these risks for the upcoming EU elections).
“Cooperate with EU level and national authorities, independent experts, and civil society organisations to foster an efficient exchange of information before, during and after the election and facilitate the use of adequate mitigation measures, including in the areas of Foreign Information Manipulation and Interference (FIMI), disinformation and cybersecurity.”
(As readers no doubt appreciate, this level of collusion between government and big tech platforms — the ultimate public-private partnership — aimed at controlling the message throughout an election period, is exceedingly dangerous. Even the EFF, which has praised many aspects of the DSA, warns that “Issues with government involvement in content moderation are pervasive and whilst trusted flaggers are not new, the DSA’s system could have a significant negative impact on the rights of users, in particular that of privacy and free speech.”)
“Adopt specific measures, including an incident response mechanism, during an electoral period to reduce the impact of incidents that could have a significant effect on the election outcome or turnout.”
“Assess the effectiveness of the measures through post-election reviews. Very Large Online Platforms and Search Engines should publish a non-confidential version of such post-election review documents, providing opportunity for public feedback on the risk mitigation measures put in place.”
(This last point feels as though it is intended to give this vast entreprise a veneer of respectability through the use of expressions such as “non-confidential” and “public feedback,” presenting the illusion that these processes will all be happening out in the open and with the direct involvement of the public, which couldn’t be further from the truth).
Not everything about the DSA is bad, however. The Electronic Frontier Foundation (EFF), for example, has praised many aspects of the regulation, including the protections it provides on user rights to privacy by prohibiting platforms from undertaking targeted advertising based on sensitive user information, such as sexual orientation or ethnicity. “More broadly, the DSA increases the transparency about the ads users see on their feeds as platforms must place a clear label on every ad, with information about the buyer of the ad and other details.” It also “reins in the powers of Big Tech” by forcing them to “comply with far-reaching obligations and responsibly tackle systemic risks and abuse on their platform.”
But the EFF says it also “gives way too much power to government agencies to flag and remove potentially illegal content and to uncover data about anonymous speakers”:
Democracies are in many ways like the internet. In both cases, it may take a thousand cuts to demolish their foundation, yet each cut contributes significantly to their erosion. One such cut exists in the Digital Services Act (DSA) in the form of drastic and overbroad government enforcement powers.
A Long Time Coming
The DSA is the culmination of a process that began at least a decade ago. Following the 2014 Maidan Square uprising, the US, NATO and the EU began attacking those who denounced it for what it was> a coup d’état. It was not long before the EU’s vast bureaucratic superstate was wheeled into place for a new propaganda war with Moscow.
At the start of 2015, Anne Applebaum (wife of the Polish ex-Minister for Defence, Radosław Sikorski, who famously thanked the US for the sabotage of the Nordstream pipelines), set up a unit within the Washington Center for European Policy Analysis called the Information Warfare Initiative. Its founding mission was to counter Russian information in Central and Eastern Europe.
Months later, the European Council tasked the EU’s then chief diplomat, Federica Mogherini, with preparing a plan of “strategic communication” to denounce the Russian disinformation campaigns relating to Ukraine. The end result was the establishment of the EEAS Strategic Communication Division, whose functions include “leading the work on addressing foreign disinformation, information manipulation and interference” as well as “analys[ing] the information environment in order to enable EU foreign policy implementation and protect its values and interests.” That was in April 2015.
After 2016, the EU took its fight against disinformation to a whole new level following the triumph of Brexit and the election of Donald Trump. In June 2018, the Commission launched its Code of Practice on Disinformation, which was “voluntarily” signed by all of the major online social media platforms and search engines. In June 2022, almost exactly four years later, the Digital Services Act became law. Just over a year after that, on August 25, 2023, the deadline by which all VLOPs and VLSEs had to begin fully complying with the DSA passed. On that date, the EU’s Code of Practice on Disinformation lost its voluntary nature.
According to Jourová, Brussels is only interested in helping to establish the “facts”, not censoring people’s “opinions”:
“We are not censoring anyone’s opinions,” says @VeraJourova at the Atlantic Council about AI regulation in the ???????? EU.
— Atlantic Council (@AtlanticCouncil) March 26, 2024
“We desperately need to increase the resilience of the society against disinformation,” she explains.
Watch more: ➡️ https://t.co/Ixvobwtu77 pic.twitter.com/QWqSE9AVYq
But who gets to decide what actually constitutes mis- or disinformation for the EU’s roughly 450 million citizens (as well as arguably untold millions of citizens far beyond Europe’s borders)?
The European Commission.
That’s right, the EU’s scandal-tarnished, power-hungry executive branch whose top jobs, including that of its current president, Ursula von der Leyen, will be indirectly determined by the upcoming EU elections. It is the 705 Members of the European Parliament chosen by EU citizens this June who will ultimately have the final say on who fills the Commission’s roles.
The performance of the current Commission and Parliament is hardly what you would describe as vote-winning. The current Commission President Von der Leyen is under investigation on multiple fronts, including by the European Public Prosecutor’s Office, for her refusal to disclose the content of her whatsapp conversation with Pfizer CEO Albert Bourla during pre-negotiations for up to 1.8 billion Pfizer-BioNtech COVID-19 vaccines. It was one of the biggest procurement contracts in EU history. VdL has also faced accusations of conflicts of interest over her husband’s role as scientific director at US biotech company Orgenesis, which received hundreds of millions of euros of EU subsidies on two separate occasions.
Von der Leyen now wants the Commission to take a central role coordinating EU weapons procurement. She even cited her office’s success in procuring COVID-19 vaccines as a model to follow. Her Commission has also provided unbridled support to Israel while the IDF commits genocidal war against the people of Gaza. It has sabotaged the EU’s economic future through its endless backfiring sanctions on Russia while consistently putting US interests first. As economic conditions have deteriorated, the response from both the EU Commission and many member governments is almost always the same, as Conor Gallagher reported recently:
More wage suppressions, more market-friendly reforms, more social spending cuts, and more privatization. It was only a few months ago that the New York-based private equity firm KKR, which includes former CIA director David Petraeus as a partner, reached a controversial agreement to buy the fixed-line network of Telecom Italia. Now the Italian daily La Repubblica is declaring that “Italy Is For Sale,” in which it describes plans for 20 billion euros worth of privatizations, including more of the state rail company Ferrovie dello Stato, Poste Italiane, Monte dei Paschi bank and energy giant Eni. The plan is reportedly necessitated by the country’s tax cuts. The roughly 100 billion euros Rome has burned through in order to address the energy crisis surely hasn’t helped either. And this was happening with the suspension of the EU debt brake.
Acceleration of a Long-Term Trend
In a recent op-ed in Berliner Zeitung, a retired German judge described the DSA as a “trojan horse that presents a façade of respecting democratic principles@ while doing the exact opposite. He concludes that the EU’s mass censorship regime poses an “existential threat” to freedom of speech and the freedom of press, which are the corner stones of any genuine liberal democracy.:
The EU Commission sets the standard by which disinformation is judged. However, this means that politically unsavoury opinions, even scientifically argued positions, can be deleted, and not only that: if it is classified as unlawful, there are social consequences.
One inevitable result is that citizens begin self-censoring to align their messages on the platforms with what is currently acceptable within the corridors of power…. The cornerstone of any free society — the perpetual exchange of intellectual and political ideas, even with opposing opinions — will therefore crumble.
This is all happening at the same time that both the Commission and some EU national governments are pushing the bloc toward direct conflict with Russia while calling for the establishment of an EU-wide war economy, all to be paid for no doubt by the EU’s hard-strapped citizens and businesses. All the while, Brussels is fast erecting its digital control system, first through the introduction of a bloc-wide digital identity program — which, like the digital vaccine passport system that preceded it, is being marketed as a purely voluntary scheme — followed some time later by a central bank digital currency.
The escalating war in Ukraine serves as a timely pretext for a brutal clampdown on basic democratic freedoms. But the EU would have probably reached this destination anyway, sooner or later. As a political project, the EU is fundamentally anti-democratic while its myriad failings have served as a convenient scapegoat to blame whenever national governments answerable to people have had to take unpopular decisions.
What Europe is now living through is an acceleration of a long-term trend, though this time the EU’s anti-democratic nature could have repercussions far beyond its own borders. Each crisis of this century has created a new opportunity for the Commission to tighten its grip while Europe itself grows weaker and weaker. As the veteran British journalist Peter Obourne once put it, “By a hideous paradox the European Union, set up as a way of avoiding a return to fascism in the post-war epoch, has since mutated into a way of avoiding democracy itself.”
International
COVID-19 Infections Detected in Dried Blood Spots via At-Home Proteomic Profiling
Scientists from KTH Royal Institute of Technology and other institutions in Sweden have published details of a study that used deep proteome profiling…
Share this:


In the years since the emergence of COVID-19, scientists have learned a lot about how the infection works and some of its long-term effects on various systems in the body. A lot of research so far has focused on the effects of severe cases of the disease. What’s less clear are the long-term physiological effects of infections on people with mild symptoms or who were asymptomatic. Scientists from KTH Royal Institute of Technology and other institutions in Sweden aimed to shed some light on this question by analyzing antibodies in dried blood samples from the general population collected using at-home kits.
In a new paper published in Communications Medicine titled, “Proteome profiling of home-sampled dried blood spots reveals proteins of SARS-CoV-2 infections,” the authors explained how they used deep proteome profiling of home-sampled dried blood spots (DBS) to assess the effects of SARS-CoV-2 in mildly symptomatic or asymptomatic individuals in urban areas in Sweden. “In clinical plasma and serum samples, in-depth proteomic analysis has already delivered valuable insights into the pathology and pathogenesis of COVID-19,” the researchers wrote. “Our DBS study aimed to demonstrate the utility of self-sampling and identify circulating proteins associated with SARS-CoV-2 infections by considering the serological phenotypes.”
While this study focuses on COVID-19, Jochen Schwenk, PhD, a professor of translational proteomics, chair of HUPO’s Human Plasma Proteome Project, and senior author on the paper, noted that the methodology could apply to other conditions that require large population studies to assess the various genetic, phenotypic, and environmental factors involved in diseases development and treatment response.
The kits are developed by Swedish medtech company Capitainer. The company’s qDBS system, which was used for the study, features a capillary system mounted on a card for capturing blood from finger pricks. It includes a smart chip that ensures that patients capture precise volumes of blood—10 microliters—as well as a colored indicator that lets them know that their sample has been successfully captured. Kits also come with instructions for safely and sterilely collecting blood samples. The same kit was used in Harvard University’s VIVID study, which aimed to determine the effects of vitamin D supplementation on COVID-19 disease progression and post-exposure prophylaxis.

According to the paper, the scientists conducted three studies with a subset of the samples they received and patients were assigned to studies based on their serostatus and self-reported information. “We compared seropositive with seronegative subjects (study 1) and donors classified into the early or post-infection phases (study 2) from the first wave of the pandemic,” they wrote. “We also studied seropositive and seronegative subjects from the third wave of the pandemic who were not vaccinated at sampling (study 3).”
Participants in the first two studies came from the first round of tests sent out in spring 2020 while those in the third study came from the second batch of tests. In total, the team looked at data from 228 individuals for the studies.
They tested the samples for over 250 blood proteins associated with cardiovascular disease and metabolism using proximity extension assays developed by Olink Proteomics. Blood samples collected from seropositive and seronegative people early on in the pandemic revealed various proteins involved in immunity, inflammation, coagulation, and stress response, according to the results. The data also showed that blood samples collected later in the pandemic had differing levels of a virus receptor on B cells.
Schwenk and his team will apply lessons learned from this initial study including some of the best practices they picked up for treating samples and data in future studies. They are also optimistic about the feasibility of conducting studies like this one in other disease areas. For example, a similar approach could be used to collect data from patients with seasonal allergies perhaps before and after they have received a particular intervention or treatment or to assess changes in inflammation proteins in response to allergens, he said.
Furthermore, because the infrastructure requirements for this kind of testing are relatively minimal compared to traditional blood testing, a methodology like this could also be applied to study diseases in resource-limited regions or in populations in hard-to-reach geographic locations.
The post COVID-19 Infections Detected in Dried Blood Spots via At-Home Proteomic Profiling appeared first on GEN - Genetic Engineering and Biotechnology News.
treatment testing genetic antibodies pandemic covid-19 swedenSpread & Containment
Analyst who predicted interest rates recent rise unveils new target
A veteran analyst with over 50 years of experience updates his interest rate outlook.
Share this:


The Federal Reserve has increased the federal funds rate by 5.25 percentage points since spring 2022, causing Treasury yields and mortgage rates to jump to levels last seen in the 1990s.
Rising rates have done what the Fed intended, crimp inflation, but they've also contributed to a housing affordability crisis that's frustrating many would-be homebuyers.
Over the winter, homebuyers got some relief when optimism of Fed rate cuts in 2024 helped yields on the 10-year Treasury note yields used by banks to set mortgage rates to dip. However, that break may be short-lived, given yields are climbing again, leaving many wondering what could happen next.
One person unsurprised by recent interest rate volatility is TheStreet Pro's Bruce Kamich, an analyst who has tracked markets for over 50 years.
In 2022, he correctly predicted that 10-year yields would soar, lifting mortgage rates to 8%. Then, he accurately forecast last November that rates would fall. And, in February, he correctly said the "direction of interest rates is up."
Kamich recently updated his interest rate outlook, and given his track record, it may be worth paying attention to what he thinks is next for interest rates.
Image source: Shutterstock/TheStreet
Inflation isn't beat (yet)
The Federal Reserve's decisions on interest rate policy are governed by a dual mandate to support low inflation and unemployment. That's not an easy tightrope to walk, especially since Covid disrupted everything in 2020.
The pandemic forced central banks worldwide to embrace a zero-interest-rate policy to avoid recessions and keep people working. In the U.S., the rock-bottom rates arguably worked too well.
Related: The Fed's stock market influence, like inflation pressure, continues to fade
While they kept the economic lights on, they also provided tinder for inflation to soar in 2022 by providing easy-access to money that fueled speculation. It didn't help matters that the world suffered a supply chain disruption due to War in Ukraine and the Ever Given accident that blocked the Suez Canal.
To quell runaway inflation, Fed chair Jerome Powell had to pivot from "inflation is transitory" to the most hawkish rate policy since Paul Volcker broke the back of inflation in the 1980s.
Inflation has indeed retreated from its peak near 9% in June 2022 to 3.2% in February. Yet, the combination of higher prices and higher loan rates has squeezed corporate and household budgets. As a result, businesses have ratcheted back expansion and hiring plans while consumers have shifted money to necessities from discretionary goods and services.
Those changes slowed the economy in early 2023, evidenced by consecutive quarters of negative GDP growth and lower corporate profits. The economy rebounded in the second half of the year, lifting earnings per share into 2024, but inflation is still a concern.
While the Consumer Price Index headline inflation of 3.2% is much better than what was witnessed in 2022 and early 2023, progress has stalled. For instance, CPI was 3% in June 2023, so inflation is higher than it was last summer.
Interest rates may likely stay higher for longer
The easy-money policies exiting Covid led many to refinance their homes at rates that were below 3%. Those owners aren't giving up those low rates readily, causing available housing inventory to remain tepid and home prices to increase.
According to the National Association of Realtors, in December, existing home sales were down 3% year-over-year in February, and median home prices increased 5.7% from February 2023 to $384,500- the eighth consecutive month of year-over-year price increases.
More Real Estate:
- Analyst revamps homebuilder stock price target before Fed rate call
- Homebuyers must now navigate higher mortgage rates and prices
- Analysts tweak Airbnb stock price targets on bookings report
High prices are thwarting homebuyers, and sadly, rates may not offer much help over the long term.
Bruce Kamich is a technical analyst who tracks interest rate trends rather than interpret Fed speeches for insight into what could happen to rates next.
His technical analysis of the interest rate market is behind his accurate prediction for higher rates in 2022, lower rates since last November, and higher rates since February.
His most recent analysis isn't likely to win him many fans among house shoppers.
"The yield of the 10-Year Treasury (TNX) is testing the 4.40% level Tuesday and is at a new high rate since ending its decline in late December," said Kamich. "In the daily bar chart of the yield on the 10-Year, I can see [rates] have trended higher since late December. The slope of the 50-day moving average line and the slower-to-react 200-day line are positive. The Moving Average Convergence Divergence (MACD) oscillator has been above the zero line since early February."
Moving averages, which smooth data over time, and MACD, a momentum indicator, are used by technical analysts to spot trends. The fact that moving averages are pointing upwards and the MACD is tilted positive suggests higher rates.
How much higher could they go? Anything can happen, but Kamich's point-and-figure chart calculations offer potential interest rate targets.
Using a daily P&F chart, he calculated a 5.35% target for the 10-year yield that would exceed last year's 5% peak yield.
Banks usually add 1.5% to 3% to the 10-year yield to set 30-year mortgage rates, so Kamich's updated target doesn't offer comfort to would be homebuyers.
Related: Veteran fund manager picks favorite stocks for 2024
unemployment pandemic stocks fed federal reserve home sales mortgage rates real estate testing gdp interest rates ukraineGovernment
Can America’s Middle Class Still Afford Homeownership In 2024
Can America’s Middle Class Still Afford Homeownership In 2024
Submitted by Sam Bourgi of CreditNews
The middle class today isn’t what it…
Share this:


Submitted by Sam Bourgi of CreditNews
The middle class today isn’t what it was even as recently as just a few years ago. After the highest inflation breakout in nearly 50 years, many middle-class families have been priced out of the standard of living that most Americans took for granted not that long ago.
The raging effects of inflation aren’t limited to consumer goods and services but to asset prices as well. In recent years, a growing chorus of politicians and pundits appeared to conclude that homeownership—one of the pillars of the American Dream—is no longer within reach for regular Americans.
To put that theory to the test, Creditnews Research studied the relationship between income distribution and housing costs across the 100 most populous metropolitan areas in the United States.
What we discovered reveals the story of two Americas: one where middle-class families can still qualify for an average home and one where they’ve been priced out entirely.
The good news is there are still pockets of affordability across the country. The bad news is that affordable metros are declining rapidly.
Key findings
-
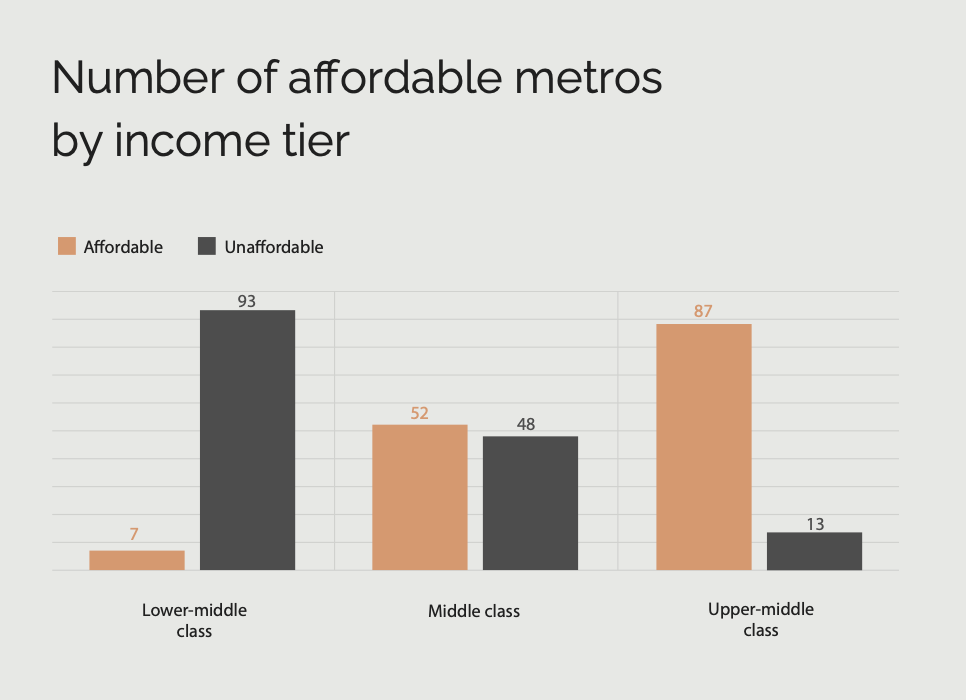
In 2024, the middle class can afford an average home in just 52 of the top 100 metro areas in the United States—a decline from 91 in 2019;
-
Those in the lower-middle class are priced out of 93 of the top 100 metro areas, up from just 33 in 2019;
-
The most affordable metros for middle-class families are mainly located in the Midwest, Rust Belt, and parts of Texas. The most affordable metros in 2024 are Youngstown, OH; Toledo, OH; McAllen, TX; Scranton, PA; and Wichita, KS;
-
The most unaffordable metros for the middle class are mainly concentrated in California and the Tri-State Area—they are San Jose, CA; San Francisco, CA; Los Angeles, CA; San Diego, CA; and Honolulu, HI;
-
The top five metros that, since Covid, have seen the largest increase in housing costs are all in California; they include San Jose, CA; San Diego, CA; Los Angeles, CA; San Francisco, CA; and Oxnard, CA.
-
Metros that are affordable for middle-class families are in rapid decline. 39 of the 100 most populous metros became unaffordable since Covid alone.
Housing affordability by income tier
There’s no single definition of the middle class, but one of the most go-to benchmarks is Pew Research’s household income percentile ranges for economic classes, which go as follows:
-
Lower-middle class: 20th - 40th percentile
-
Middle class: 40th - 60th percentile
-
Upper-middle class: 60th - 80th percentile
Based on these percentile ranges, America’s “middle class” households fall into three main income tiers:
-
Lower-middle class: $30,001—$58,020
-
Middle class: $58,021—$94,000
-
Upper-middle class: $94,001—$153,000
Affordability is another variable that carries many assumptions and could be approached in multiple ways.
For this particular study, Creditnews Research assessed affordability by calculating the minimum annual income households need to qualify for a mortgage on a typical home in each metro. A home is considered affordable if the monthly mortgage and housing payment doesn’t exceed 28% of a household’s gross income.
Although a middle-class income is essential to broadening one’s access to home financing, it’s not enough to close the gap in the country’s largest markets.
Based on the above criteria, middle-class households can afford an average home in just 52 out of the 100 top metros in 2024.
These 52 metros represent a diverse cross-section of America but are mainly located in the Midwest, Rust Belt, Appalachia, and parts of Texas.
For the lower-middle class, there are only seven affordable housing metros in the top 100—while the upper-middle class can afford homeownership in 87 of the top 100 metros.
As one might expect, the qualifying income and monthly housing costs vary dramatically by city.
In the most affordable cities across the Midwest and Rust Belt, a household income of below $70,000 is more than enough to qualify for a home. But that’s nowhere near enough along the Pacific Coast, Northeast, the Tri-State Area, and even parts of Florida.
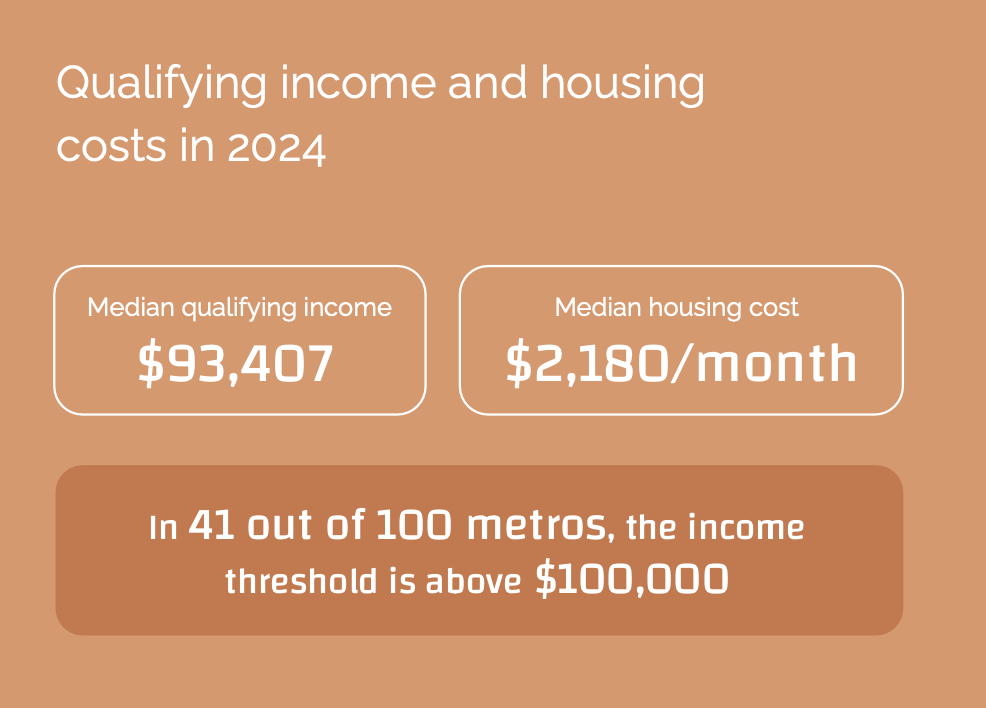
In total, 41 out of the 100 metros in the study require a gross annual income of at least $100,000 to qualify for an average home. Most of these areas are accessible to the upper-middle class. But not all. Thirteen metros require a household income of more than $155,000.
The average monthly housing cost across the 100 metros amounts to $2,180, but again, there’s a huge variance between the lower and upper end of the range.
In the most affordable city, homebuyers can expect to pay a mere $942 a month for their mortgage and related costs. On the flip side, the most expensive metro could set you back an eye-popping $9,931.
Two Americas
Today’s housing market is really a tale of two Americas.
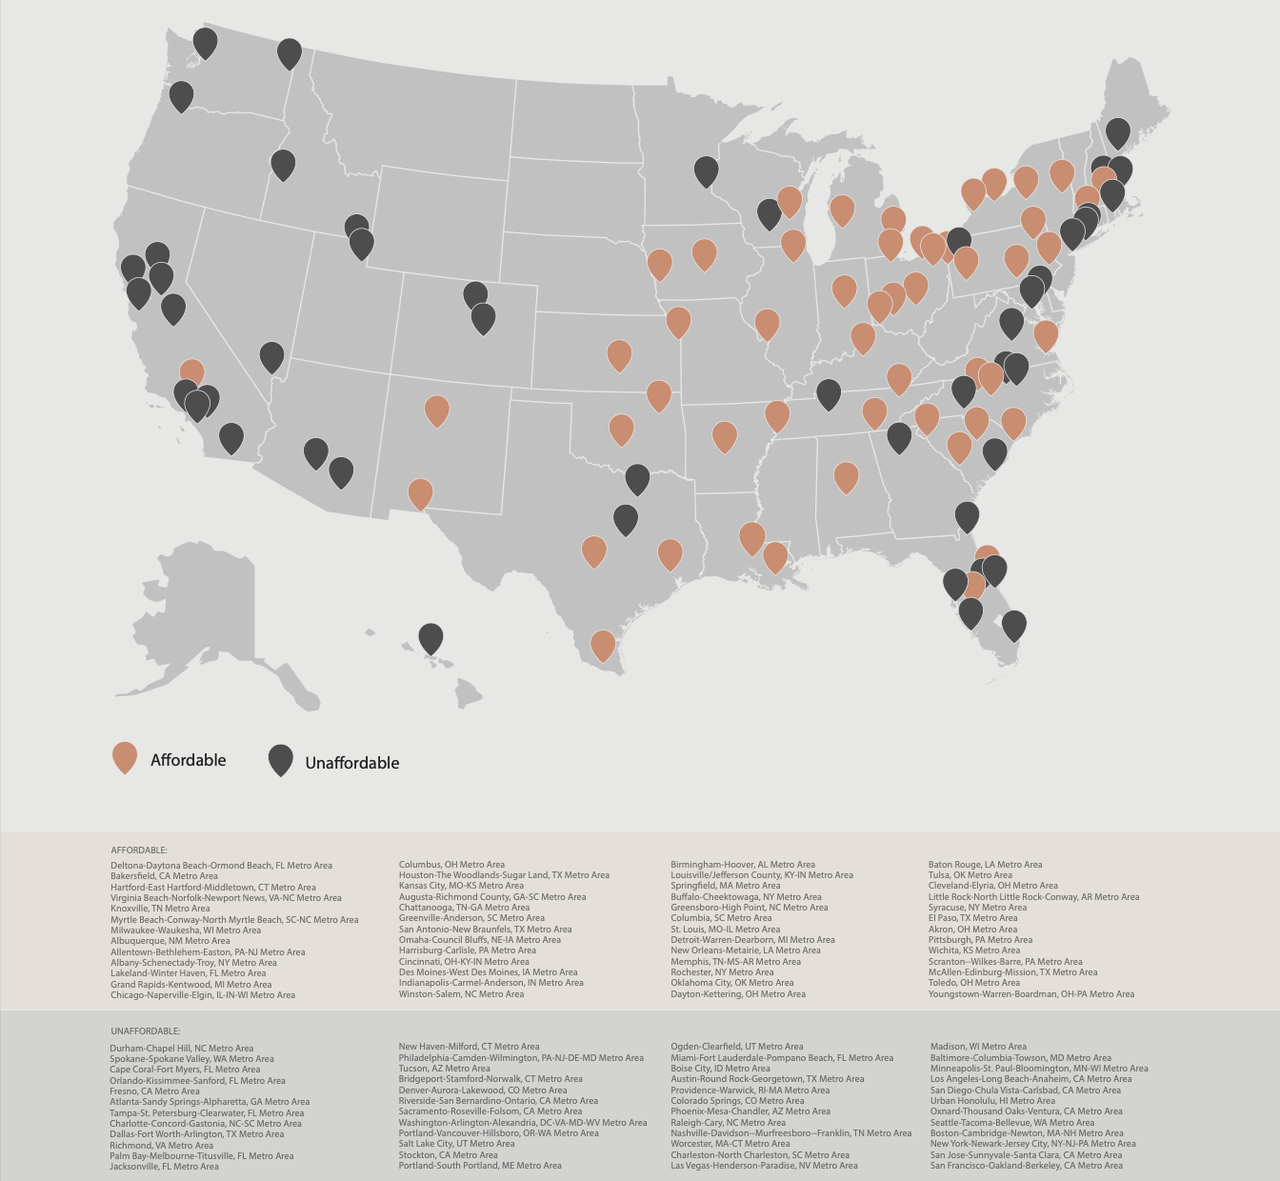
The Midwest and parts of the South continue to offer affordable options even for middle class households, whereas the ultra-desirable coastal cities are out of reach even for affluent buyers.
The root cause of this divide is rather straightforward: in large coastal cities, the supply of housing hasn’t kept up with demand as more people flock to those places for work or lifestyle.
In recent years, Americans have been stymied by the largest housing supply shortage in history—a well-documented contributor to record home prices.
That’s on top of a generational spike in mortgage rates, which has priced many average Americans out of the threshold.
Overall, middle-class households have 52 metros in the top 100 to choose from if they are looking for a home priced within their means. The question is whether they’re prepared to move or put down roots in those regions.
Many Americans bemoan the idea of living in the Midwest or smaller southern cities and would prefer the bright lights of San Francisco, Los Angeles, New York, or Boston.
Unfortunately, these metros are the last places middle-class Americans should be going to buy a home. In fact, the same is even becoming true for the upper-middle class.
As Creditnews Research found, a total of 11 metros have become unaffordable even for upper middle-class households since Covid. Six of those metros are located on the Pacific Coast and three on the East Coast.
The most affordable metro areas
With few exceptions, the majority of middle-class households (including lower-middle-class families) can decidedly qualify for a home in America’s 10 most affordable metro areas.
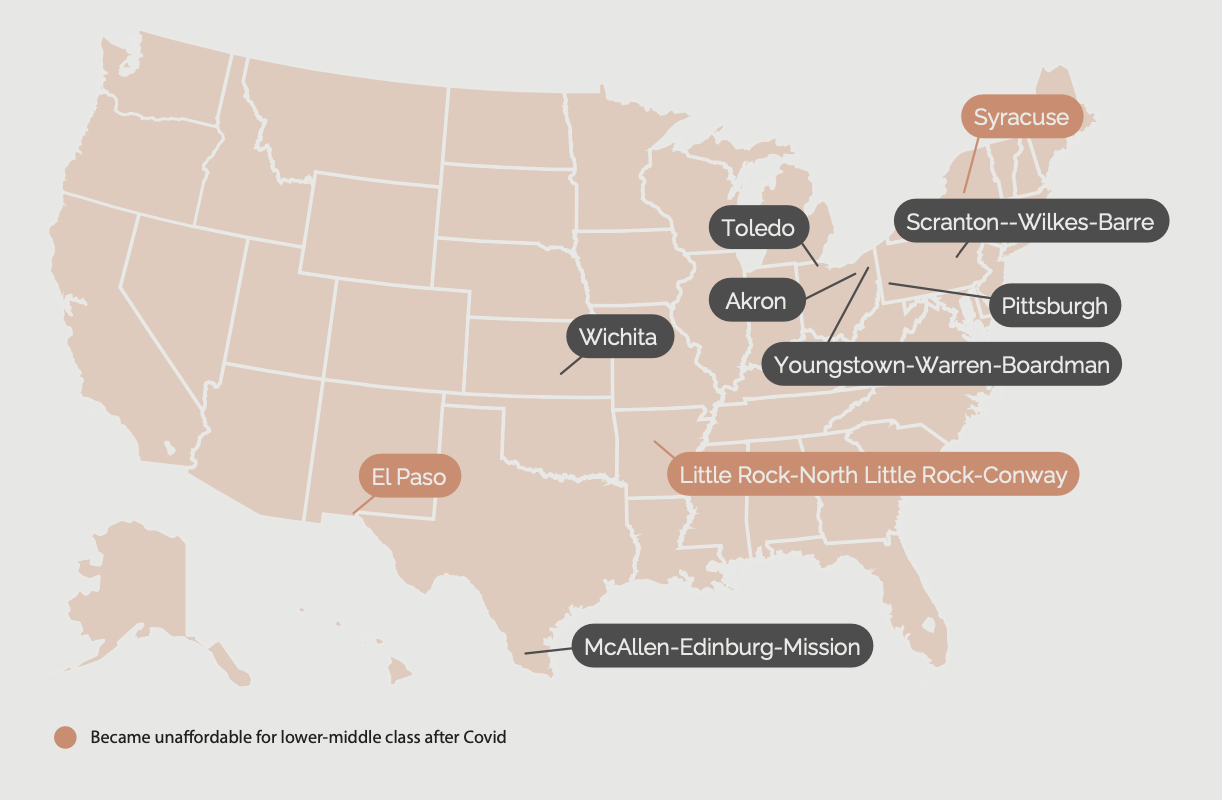
Apart from El Paso, Syracuse, and Little Rock—which became out of reach for the lower-middle class—the following metros have held their own on affordability over the past half-decade.
One state that makes several appearances on our most affordable list is Ohio.
This is due in part to the state’s generous homeowner subsidies in the form of grants and tax credits, coupled with ongoing investments in home construction and affordable housing.
Another catalyst has been the low down payment threshold throughout the Buckeye State, which, at $35,250, is outdone only by Iowa and Mississippi.
Gary Painter, Ph.D, real estate professor at Carl H. Lindner College of Business, stated: “Given the relatively robust economy, a young household’s ability to afford a down payment in Cincinnati and other Ohio cities is quite high relative to regions of similar size across the United States.”
The following cities represent the 10 most affordable metros in America, starting on the low end.
- Youngstown-Warren-Boardman, OH-PA: Youngstown shows up first in our rankings, with a monthly payment below $1,000 ($942) in 2024. To qualify for a typical home, buyers need an income of just over $40,000—well within the range of lower-middle-class and middle-class households. Youngstown’s population has fallen in recent decades but appears to have stabilized; the drop hasn’t been as drastic as peer cities Flint, Michigan, and Gary, Indiana. Housing prices are rising, but poverty in this city surpasses that of the state of Ohio.
- Toledo, OH: Ohio reappears in our rankings with the Toledo metro claiming the No. 2 spot. With an average monthly payment of $1,130, Toledo’s qualifying income for an average home jumps 20% from Youngstown to roughly $48,500. Average monthly housing costs in this metro soared 78% from pre-Covid (2019) levels of $635 to $1,130 in 2024. Even so, all segments of the middle class should be able to afford a house in this area. Catalysts driving Toledo’s real estate market include reasonable prices and a wide range of job opportunities across manufacturing, healthcare, education, and the public sector.
- McAllen-Edinburg-Mission, TX: Rounding out the three most affordable metros is McAllen, where residents must earn just below $50,000 in income to qualify for an average home without stressing their budgets. Qualifying income has roughly doubled since 2019 when it was below $25,000. So has the average monthly payment, hitting $1,156 in that stretch. McAllen’s close proximity to the Gulf of Mexico makes it a less expensive alternative for families who prefer to live by the water. McAllen has come a long way from its beginnings as a private ranch in the late 1800s to a standout economy in the Rio Grande Valley. In a speech given in McAllen in 2023, Texas Governor Greg Abbott touted the state’s massive property tax cuts, which have helped to propel economic development in the region.
- Scranton-Wilkes-Barre, PA: Scranton takes the fourth spot in our rankings, representing Pennsylvania’s debut on our list. Households must earn a qualifying income of just over $52,000 to afford an average home in this metro and keep costs at 28% of earnings. Monthly housing expenses in 2024 hover at $1,215, a massive 80% jump versus 2019 when they were below $700. But the entire middle class should still be able to afford a house in this metro. Scranton’s housing market has become more competitive of late, with home prices climbing 4% in Q1 2023. Scranton’s population currently hovers at approximately 376,000 but is projected to reach nearly 400,000 by 2031 despite rising property taxes. Scranton is considered among the top metros in the country for economic development in its comp set and has gained a reputation as one of the best places in the U.S. to retire, owing in part to housing options.
- Wichita, KS: Kansas enters the most affordable housing fray thanks to Wichita, which claims the No. 5 spot. Given Wichita’s qualifying income of $55,243, middle-class households can afford this metro without breaking the bank with monthly payments of roughly $1,300 in 2024. But it’s a far cry from 2019’s qualifying income of below $23,000 and monthly housing costs of only $532. Wichita hasn’t been able to escape the real estate market headwinds of late, which has weighed on deal activity, but economic activity in the state has been growing hand over fist. In Q3 2023, Kansas’s GDP grew by nearly 10%, fueled by a booming farming community.
- Pittsburgh, PA: The northeast revisits our rankings with Pittsburgh in the No. 6 spot. Pittsburgh’s qualifying income of $55,457 for an average home places it in the same ballpark as the Wichita metro. With a monthly payment of slightly below $1,300, the entire middle class should be able to afford a home in this area. But that doesn’t mean affordability hasn’t deteriorated over the years. Monthly housing costs have soared 66% since 2019 when they were below $800. With approximately 303,000 residents, Pittsburgh’s population is about half of where it was in the 1950s, the collapse of which is aligned with the decline of the country’s steel industry. Home sales in Allegheny County, where Pittsburgh is located, sank 25% between 2021 and 2023 to an all-time low amid the high interest rate and low inventory environments.
- Akron, OH: Demonstrating its prominence among the most affordable cities, Ohio is back with Akron—the Rubber Capital of the World—snagging the No. 7 spot. Households must earn a qualifying income of $56,743 to afford an average home in this metro, a 44% jump compared with 2019 levels. But with an average monthly payment of just over $1,300, the middle class wouldn’t feel cash strapped owning a home in this area. Akron’s housing demand remained strong even throughout the latest industry downturn, buoyed by an emerging tech hub that makes the city an attractive destination for jobs.
- El Paso, TX: El Paso lassoed the No. 8 spot in our rankings, strengthening the Southwest’s grip among the most affordable metros. As the first metro in our rankings to exclude the lower-middle class, El Paso’s affordability has been slipping away since Covid. The city’s qualifying income and monthly housing costs have roughly doubled to $58,114 and $1,356, respectively, since the pandemic, making it increasingly difficult to afford. El Paso’s per capita income has been on the rise, a trend that is expected to persist into 2025, with a housing market that’s been fueled of late by out-of-state buyers hunting a bargain of late.
- Syracuse, NY: As the first metro to represent New York, Syracuse claims the No. 9 spot in our rankings. Syracuse joins El Paso as the second metro where the lower-middle class was priced out since Covid, with the qualifying income soaring from $30,228 to $58,157 in that period. Similarly, the average monthly payment has nearly doubled from about $700 to $1,357 since 2019. But Syracuse’s days among the most affordable metros are probably limited as the housing market continues to draw comparisons to Manhattan and San Francisco. The city has become a hotbed for tech startups and jobs, including the rise of Micron Technology’s semiconductor plant in nearby Clay, NY that’s projected to create 50,000 jobs.
- Little Rock-North Little Rock-Conway, AR: Rounding out the top 10 most affordable metros is Little Rock, where once again the middle class is getting squeezed. Residents must earn a qualifying income of $58,286 to comfortably afford a home in this area, a whopping 41% increase compared with 2019. Monthly costs have jumped a steeper 69% to $1,360. Even with that sharp rise, Little Rock is affordable enough to make it into the top 10. While affordability has been waning in this metro, the economy is buzzing with job growth as of Q4 2023 exceeding pre-pandemic levels.
The least affordable metro areas
America’s least affordable metro areas won’t come as too much of a shock, with luxurious Pacific Coast metros dominating the rankings.
Half of the metros in this category are located in the state of California. Not to be outdone, Hawaii also makes an appearance, along with a trio of metros on the Eastern seaboard.
America’s middle class is priced completely out of each of these metro areas, including the upper end of the income range at $153,000.
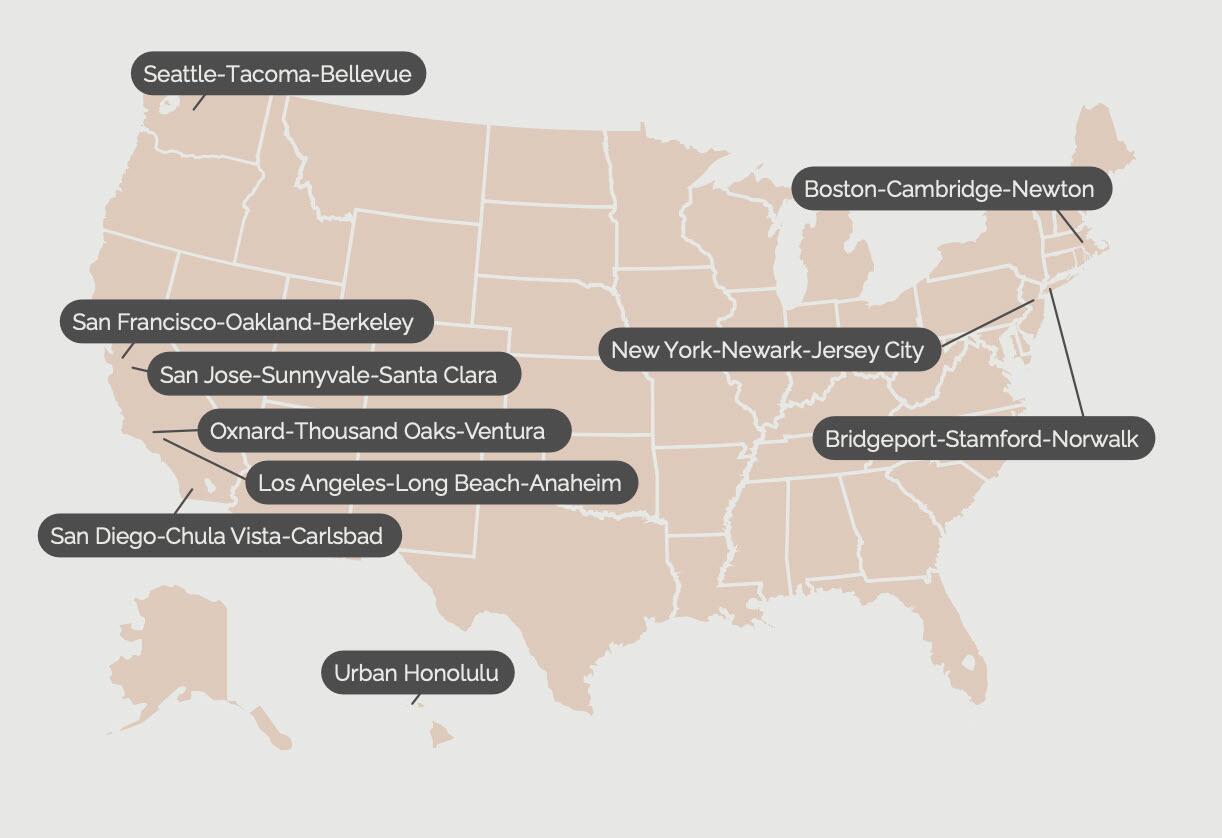
- San Jose-Sunnyvale-Santa Clara, CA: San Jose takes first place with a qualifying income of $425,614 just to afford an average home. With an average home price of $1.5 million, the San Jose metro could see some relief from dwindling land on which to build. Surrounded by Silicon Valley, this metro area has been hit by a slow return to offices at tech companies like Zoom, PayPal, and X Corp, threatening to trigger a wave of out-migration and create what’s known as a “donut city” where residents and businesses relocate to the suburbs.
- San Francisco-Oakland-Berkeley, CA: It comes as no surprise that the tech capital of California is the country’s second least affordable metro for the middle class. With an average home price of $1.1 million, average monthly payments are just over $7,200, up from $4,679 five years ago. As part of California’s Bay Area, San Francisco has a reputation as one of the country’s most expensive real estate markets. Billions of dollars in investment continue to pour into this high-tech region, making it unlikely that housing prices will retreat anytime soon.
- Los Angeles-Long Beach-Anaheim, CA: Continuing with the California trend, Los Angeles rounds up to the top three least affordable metros. LA is the first city on our list to become unaffordable to the upper-middle class since Covid, with a $112,329 increase in qualifying income to $256,286. LA’s average home price hovers at $935,800, resulting in monthly housing costs of nearly $6,000. LA’s financial district is transforming into high-end apartments due to waning demand for offices.
- San Diego-Chula Vista-Carlsbad, CA: With an average home price of $924,365, San Diego is out of reach for every segment of the middle class, including the upper-middle class. Monthly payments for an average home are more than $5,900. Market dynamics don’t appear to be improving. San Diego led the nearly two-dozen cities tracked in the latest Case Shiller rankings, owing to an 11.2% increase in housing prices in the 12-month period ending in January 2024. Despite having a vibrant economy and a pristine climate, the vast majority of families couldn’t make it here.
- Urban Honolulu, HI: Honolulu rounds out the top five, joining the list of cities that have become too pricey for the upper-middle class. With an average home price of approximately $860,000, very few households outside of the wealthy can afford property here. A one-two punch of a tourism slowdown and recent wildfires have contributed to slower economic growth in Hawaii. But that hasn’t kept real estate values from rising amid strong demand for Honolulu’s beaches, rainforests, and spectacular views.
- Oxnard-Thousand Oaks-Ventura, CA: Located in California’s Ventura County, Oxnard takes the No. 6 spot in our rankings. With an average home price of nearly $850,000, monthly payments have soared 77% since 2019 to $5,425. Ventura County has strict land-use rules, pressuring inventory and resulting in a shrinking population, including Oxnard’s middle class, a trend that’s forecast to persist in the coming years.
- Seattle-Tacoma-Bellevue, WA: Representing Puget Sound in the Pacific Northwest, Seattle claims the No. 7 spot in our rankings. This metro’s qualifying income has more than doubled over the past decade and is no longer affordable to the upper-middle class. For everyone else in the middle class, Seattle is simply too rich for household budgets. With an average home price of $719,217, monthly payments are almost $4,600. New residents have been flocking to Seattle—the location of e-commerce giant Amazon’s corporate headquarters—for employment opportunities and income growth.
- Boston-Cambridge-Newton, MA-NH: The Northeastern city of Boston ranks eighth on our list. Boston’s qualifying income of $181,971 reflects an increase of nearly $80,000 since the pandemic, reserving this metro for high-income households. With an average property price of $664,491, monthly housing costs are now about $4,246, up 77% since 2019. The Boston metro, which extends to Massachusetts cities Cambridge and Newton, plus the neighboring state of New Hampshire, boasts one of the highest in-migration rates among Gen Zers in the country.
- New York-Newark-Jersey City, NY-NJ-PA: The New York, New Jersey, and Pennsylvania metros make the cut as the least affordable areas. With a qualifying income of $173,786, New York became out of reach for even the upper-middle class after the pandemic. With an average home price of $634,651, monthly housing costs have climbed 65% higher since 2019 to $4,055. New York Mayor Eric Adams has made affordable housing a priority in the city, increasing financing for new construction and the preservation of affordable homes by 80% in 2023 year-over-year.
- Bridgeport-Stamford-Norwalk, CT: Rounding out our top 10 least affordable metros is Bridgeport, CT. This metro, which also extends to Stamford and Norwalk, has a qualifying income of $163,371. With an average home price of almost $600,000, monthly housing costs hover at $3,812. Connecticut has been on the receiving end of an in-migration trend, adding 81,000 residents in 2022. With Connecticut Governor Ned Lamont implementing the biggest income tax deduction that the state has ever seen and lifting a tax credit for low-income workers, the trend is unlikely to reverse anytime soon.
Housing affordability: Pre-Covid vs. 2024
The fact that housing became more expensive after Covid is hardly breaking news. The question is, by how much?
Our analysis shows that average Americans have to earn almost twice as much today compared to pre-Covid to qualify for an average home.
Thanks to the doubling of qualifying income thresholds, 39 out of 100 of America’s most populous metros dropped out of middle-class affordability.
Taking into account lower-middle-class families, that figure balloons to a staggering 60 metro areas.
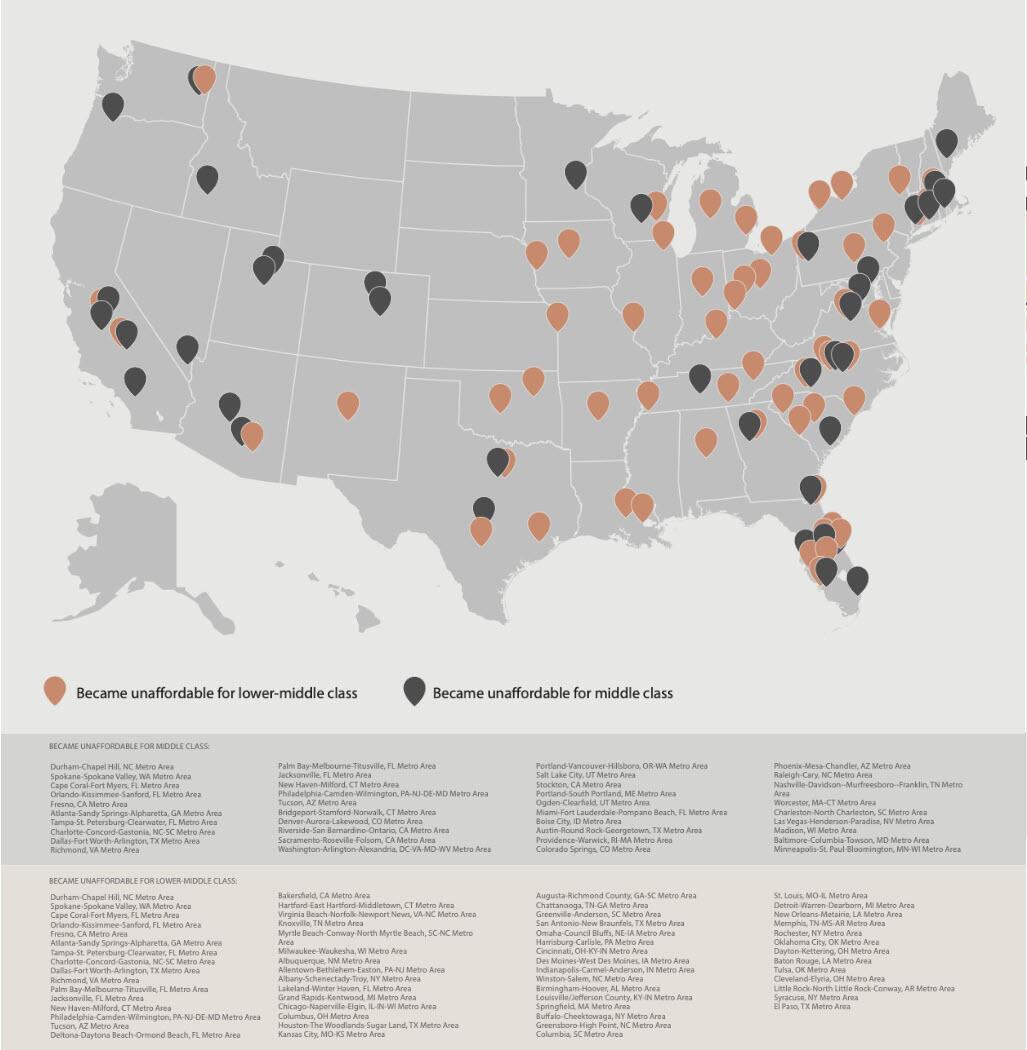
Perhaps predictably, the metropolitan areas witnessing the sharpest increases in income thresholds and housing expenses since Covid eerily match the 10 most unaffordable metros in 2024.
- San Jose-Sunnyvale-Santa Clara, CA: In addition to being the most unaffordable metro in the country for the middle class, San Jose real estate has seen the largest increase since pre-Covid times. Home prices are up a whopping 73% versus 2019 levels. Average monthly payments in this metro are unnervingly close to $10,000 compared with pre-Covid levels of $5,716.
- San Diego-Chula Vista-Carlsbad, CA: Not only does San Diego make the top four least affordable metro areas, but it’s also seen one of the biggest spikes since the pandemic. San Diego has experienced a 95% increase in qualifying income since 2019 to $253,157.
- Los Angeles-Long Beach-Anaheim, CA: While Los Angeles was never really affordable for the middle class, since Covid, housing affordability has gone off the deep end. Between 2019 and 2024, housing costs in LA have soared by $112,329. Over that period, average monthly payments have increased by a staggering 78%.
- San Francisco-Oakland-Berkeley, CA: San Francisco joins the other major California metros with a massive spike in qualifying income standards since Covid, rising $109,492 since 2019 to $310,000 in 2024. But although residents here command a high income, even the upper-middle class doesn’t make enough to afford the average home.
- Oxnard-Thousand Oaks-Ventura, CA: Oxnard is one of several California metros that have become out of reach for even the upper-middle class after Covid. Since the pandemic, qualifying income in this metro has soared almost $101,200, making it unaffordable even for those earning above $150,000.
- Urban Honolulu, HI: This Hawaii metro experienced a 64% jump in qualifying income since 2019 to $235,543. Over the past half-decade, Honolulu real estate has priced out even the upper-middle class with monthly payments nearing $5,500.
- Seattle-Tacoma-Bellevue, WA: Since the pandemic, this metro’s qualifying income has increased by $88,253 to $196,971, pricing America’s entire middle class out of the Seattle market.
- Boston-Cambridge-Newton, MA-NH: Known for its red-hot housing market, this New England city has become unaffordable for the middle-class homebuyer. In fact, even the upper-middle class has been priced out since Covid. Since the pandemic, Boston’s qualifying income has increased by $88,253 to $196,971.
- Bridgeport-Stamford-Norwalk, CT: Bridgeport doesn’t have the name recognition as other major metros on the list, but its affordability crisis has worsened since Covid. The qualifying income for an average home has increased by more than $77,400 since 2019. Monthly housing costs are up a massive 90% from pre-Covid levels.
- Riverside-San Bernardino-Ontario, CA: Due to large population growth and close proximity to LA, Riverside’s housing market has soared over the past half-decade. Since 2019, buyers need to earn $75,114 more to qualify for an average home in this metro.
Can homeownership become more attainable?
This study serves as yet another piece of evidence that America’s middle class isn’t what it once was—certainly from a homeownership point of view.
In previous generations, being able to own a home was almost taken for granted. Not anymore. And considering the steep drop in affordability since Covid alone, housing is unlikely to become more attainable anytime soon.
The good news is that the housing affordability crisis hasn’t gone unnoticed.
The issue is top of mind at the White House, with the Biden administration proposing tax credits and other home buying initiatives to make it easier for the middle class to enter the market.
Some builders are also set to convert empty office space into residential units—a promising, albeit limited, plan to improve housing access.
In the meantime, a growing number of metro areas are becoming out of reach for middle-class homeowners—thanks to elevated mortgage rates, sky-high house prices, and scarce inventory.
When, or if, housing could become more attainable is yet to be seen.


“They Will Surely Try To Run The ‘Disease X’ Ruse” Ahead Of 2024 Elections


Two Weeks To Flatten Became Eight Months To Change The Election


‘Fake news’ legislation risks doing more harm than good amid a record number of elections in 2024


Food delivery service closes, bankruptcy filing likely


No Fooling: Gov. Newsom’s $20 Minimum Wage Hits April 1


COVID-19 Infections Detected in Dried Blood Spots via At-Home Proteomic Profiling


Eating The Rich Won’t Feed The Beast


Key Events This Week: Payrolls, Powell, ISM And Fed Speakers Galore


Disinflation Narrative Dies As Manufacturing PMIs Show Prices Soaring Most In 20 Months


Tennessee Lawmakers Pass Bill Targeting mRNA Vaccines In Food
-

 International2 weeks ago
Parexel CEO to retire; CAR-T maker AffyImmune promotes business leader to chief executive
-

 Spread & Containment3 weeks ago
IFM’s Hat Trick and Reflections On Option-To-Buy M&A
-

 International4 weeks ago
EyePoint poaches medical chief from Apellis; Sandoz CFO, longtime BioNTech exec to retire
-

 International4 weeks ago
Walmart launches clever answer to Target’s new membership program
-

 Uncategorized1 month ago
Evidence And Insights About Gold’s Long-Term Uptrend
-

 Uncategorized1 month ago
A Global, Digital Coup d’État
-

 Spread & Containment1 week ago
Japanese Preprint Calls For mRNA VaccinesTo Be Suspended Over Blood Bank Contamination Concerns
-
International1 day ago
“They Will Surely Try To Run The ‘Disease X’ Ruse” Ahead Of 2024 Elections