Uncategorized
Boyz to Men — Step Back to Small Caps & Growth Stocks
We started this year looking at the monthly charts and the 2 moving averages that depict business cycles.Back in February, we wrote:All in all, the key…
Share this:

We started this year looking at the monthly charts and the 2 moving averages that depict business cycles.
Back in February, we wrote:
All in all, the key sectors (retail, transportation) have more to prove, especially by clearing the 23-month moving average or 2-year business cycle. This is a significant level, as these sectors proved recession was held off when they both held the 80-month moving average or their 6-7 year business cycle low. So, after 2021 was a huge up year and 2022 was a huge down year, 2023, if it clears a 2 year cycle, that looks way better for the economy and market.
Subsequently, Retail (XRT) never cleared the 23-month MA, while Transportation (IYT) did.
That prevented us from feeling too confident in a sustaining rally with retail weak. However, as you can see, the picture has changed.

Retail (XRT) threatens the 80-month moving average once again. Transportation (IYT) has failed the 23-month in September. That gives us two reliable indicators for moving ahead.
Can Retail hold the 80-month MA? If not, here comes recession.
Or can IYT return over the 23-month, engendering more confidence?
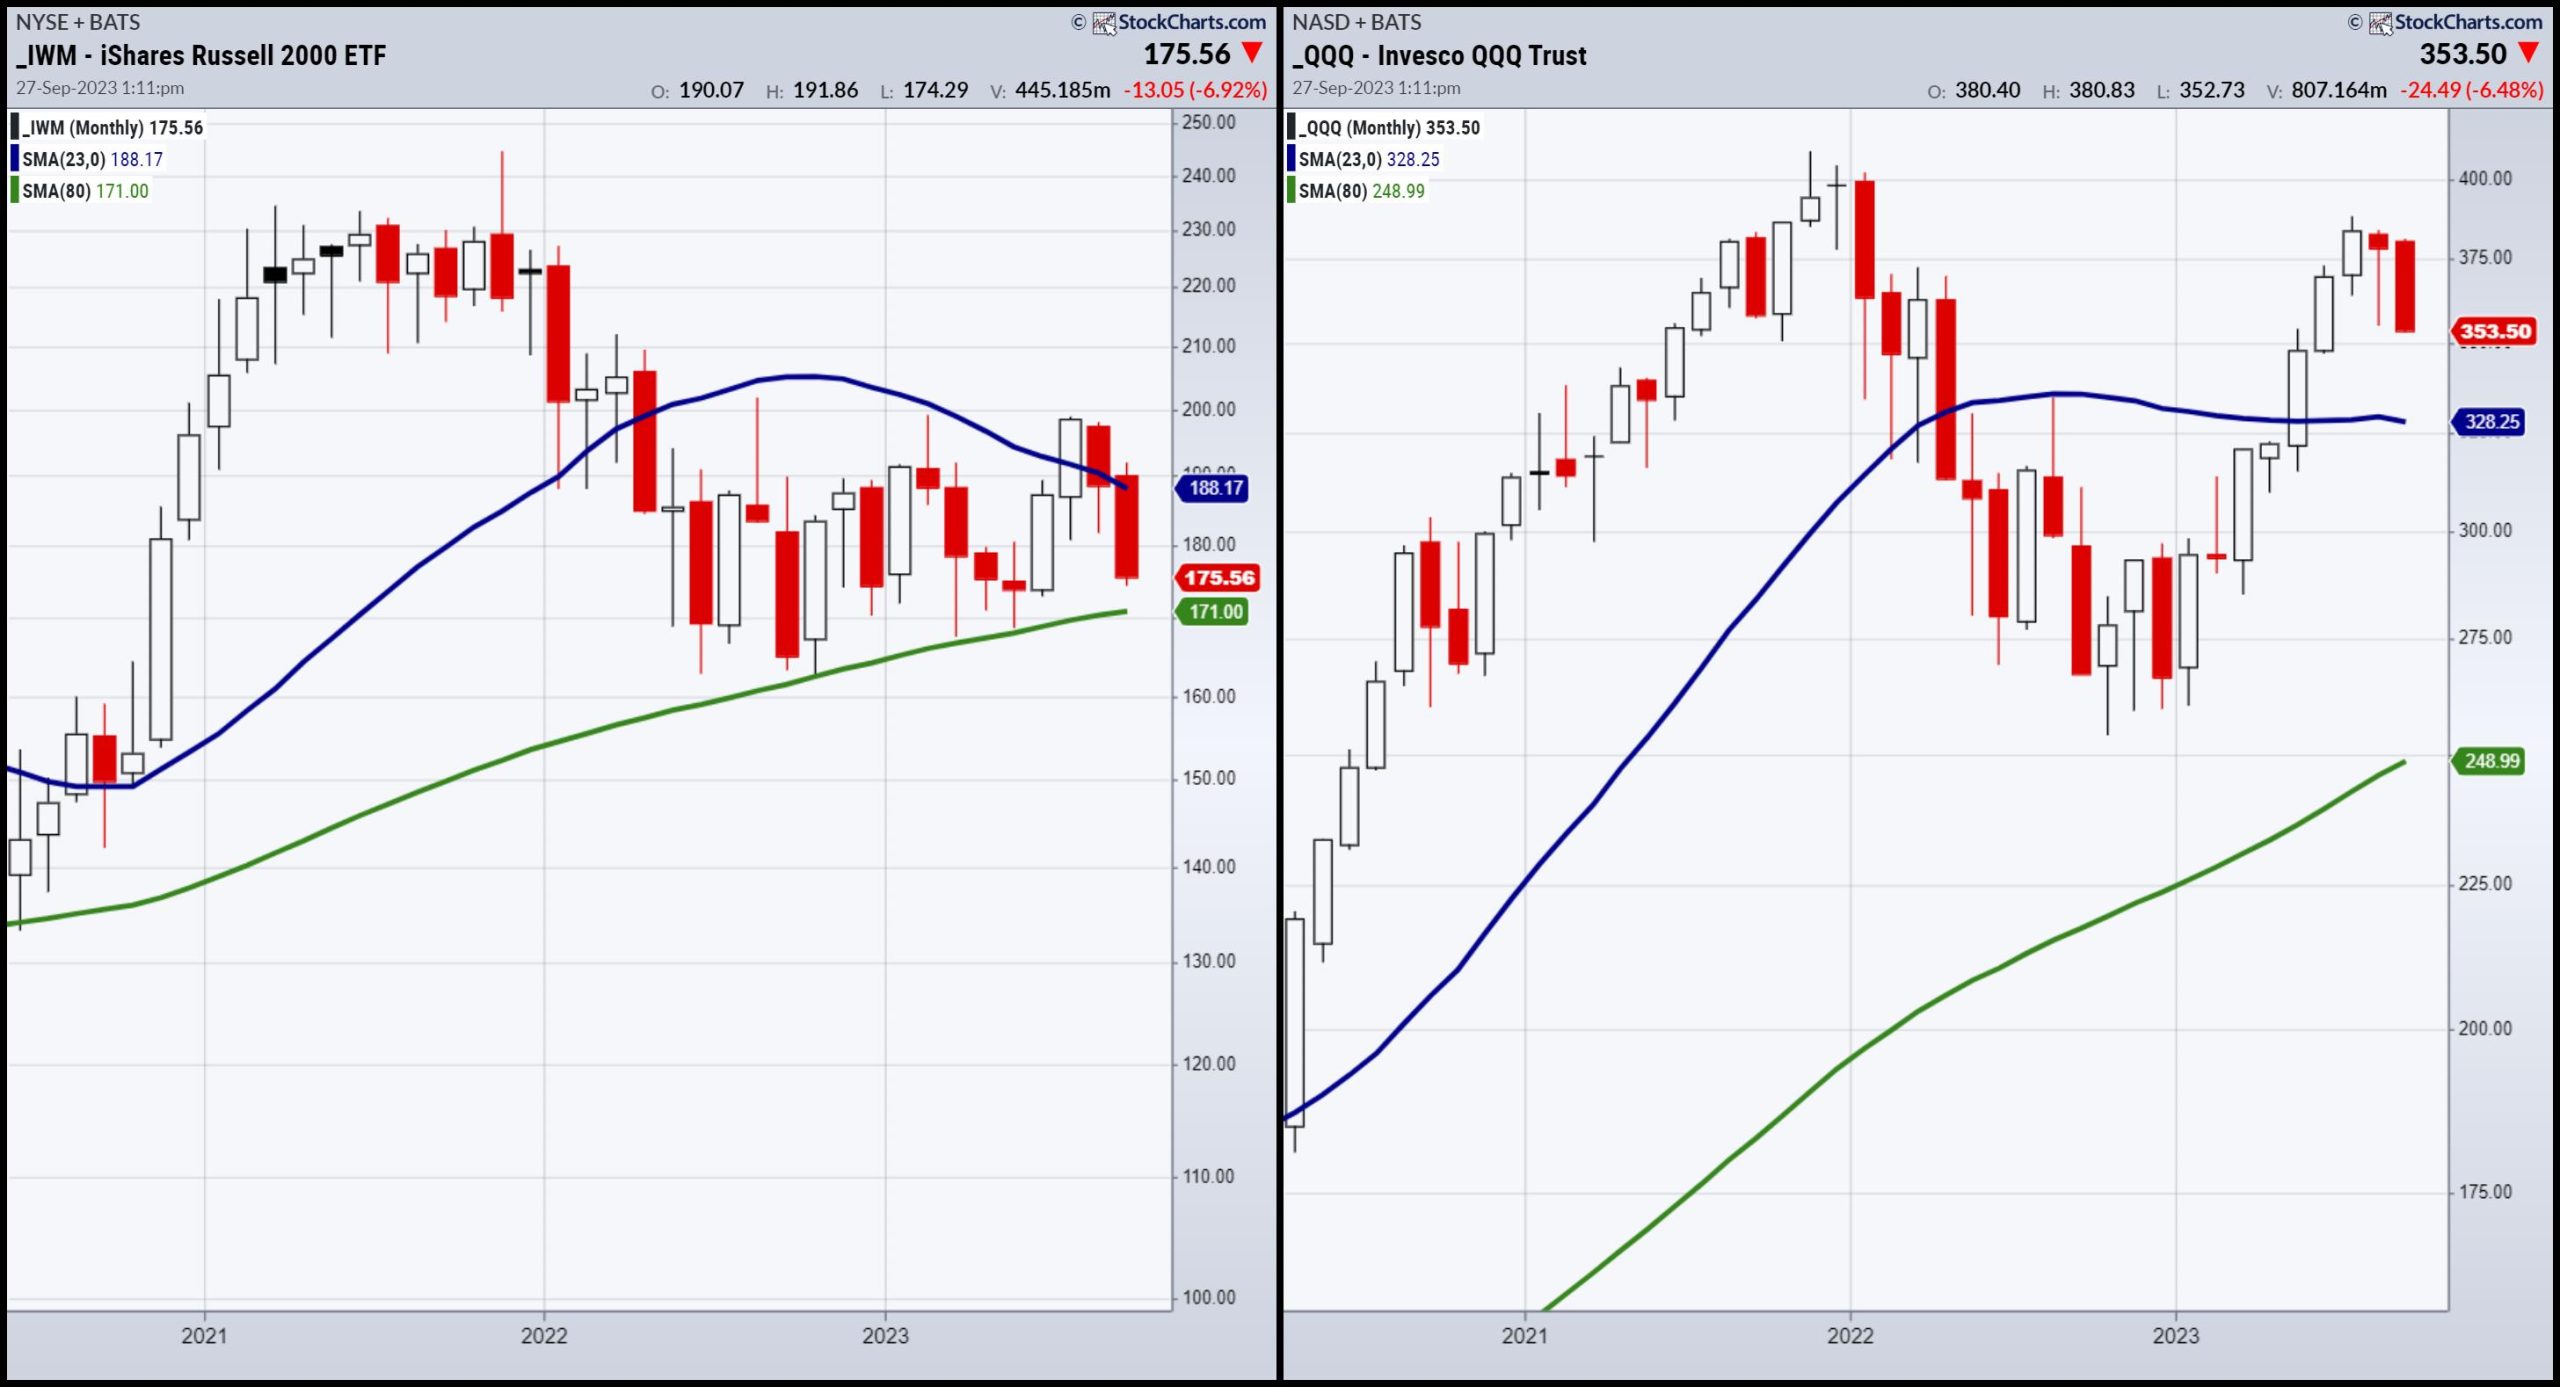
Perhaps the small caps and NASDAQ index can shed more light. Small-caps (IWM) fell below the 23-month MA after spending only one month above it. The failure in August to hold above the blue line or 2-year business cycles is a pretty clear sign the higher rates are having an impact on the Granddaddy of the US economy.
Conversely, NASDAQ QQQ broke above the 2-year business cycle high in May 2023. Price ran from $328 to $388 in 3 months as AI and growth have been the winners for a long time. This move lower can see a retracement in QQQ back to 328. After that, so much depends on what happens with IWM, XRT, and IYT.
Nonetheless, one thing is safe to presume. If XRT keeps recession at bay and IYT can rebound back into some expansion, growth will continue to outperform. And if XRT indicates a recession is coming, and IYT plus IWM fail their 80-month MAs, QQQ may still outperform. But we would wait for a move down to 275 as the better buy opportunity in that index.
This is for educational purposes only. Trading comes with risk.
For more detailed trading information about our blended models, tools and trader education courses, contact Rob Quinn, our Chief Strategy Consultant, to learn more.
If you find it difficult to execute the MarketGauge strategies or would like to explore how we can do it for you, please email Ben Scheibe at Benny@MGAMLLC.com.

"I grew my money tree and so can you!" - Mish Schneider
Get your copy of Plant Your Money Tree: A Guide to Growing Your Wealth and a special bonus here.
Follow Mish on Twitter @marketminute for stock picks and more. Follow Mish on Instagram (mishschneider) for daily morning videos. To see updated media clips, click here.
Mish in the Media
See Mish argus investors could jump into mega-tech over value and explain why she is keeping an eye on WTI prices on BNN Bloomberg's Opening Bell.
Even as markets crumble, there are yet market opportunities to be found, as Mish discusses on Business First AM here.
Mish explains how she's preparing for the next move in Equities and Commodities in this video with Benzinga's team.
Mish talks about the head-and-shoulders top pattern for the S&P 500 in The Final Bar.
Mish covers sectors from the Economic Family, oil, and risk in this Yahoo! Finance video.
Mish shares why the most important ETFs to watch are Retailers (XRT) and Small Caps (IWM) in this appearance on the Thursday, September 20 edition of StockCharts TV's The Final Bar with David Keller, and also explains MarketGauge's latest plugin on the StockCharts ACP platform. Mish's interview begins at 19:53.
Mish covers 7 stocks that are ripe for the picking on the Wednesday, September 20 edition of StockCharts TV's Your Daily Five, and she gives you actionable levels to watch.
Take a look at this analysis of StockCharts.com's Charting Forward from Jayanthi Gopalkrishnan, which breaks down Mish's conversation with three other charting experts about the state of the market in Q3 and beyond.
Mish was interviewed by Kitco News for the article "Oil Prices Hit Nearly One-Year High as it Marches Towards $100", available to read here.
Mish covers short term trading in DAX, OIL, NASDAQ, GOLD, and GAS in this second part of her appearance on CMC Markets.
Mish talks Coinbase in this video from Business First AM!
Mish looks at some sectors from the economic family, oil, and risk in this appearance on Yahoo Finance!
Mish covers oil, gold, gas and the dollar in this CMC Markets video.
In this appearance on Business First AM, Mish explains why she's recommending TEVA, an Israeli pharmaceutical company outperforming the market-action plan.
As the stock market tries to shake off a slow summer, Mish joins Investing with IBD to explain how she avoids analysis paralysis using the six market phases and the economic modern family. This edition of the podcast takes a look at the warnings, the pockets of strength, and how to see the bigger picture.
Mish was the special guest in this edition of Traders Edge, hosted by Jim Iuorio and Bobby Iaccino!
In this Q3 edition of StockCharts TV's Charting Forward 2023, Mish joins a panel run by David Keller and featuring Julius de Kempenaer (RRG Research & StockCharts.com) and Tom Bowley (EarningsBeats). In this unstructured conversation, the group shares notes and charts to highlight what they see as important considerations in today's market environment.
Coming Up:
September 29: Live Coaching
October 2: Schwab, The Watch List
October 4: Jim Puplava, Financial Sense
October 5: Yahoo! Finance
October 12: Dale Pinkert, F.A.C.E.
October 26: Schwab at the NYSE
October 27: Live in-studio with Charles Payne, Fox Business
October 29-31: The Money Show
Weekly: Business First AM, CMC Markets
ETF Summary
- S&P 500 (SPY): There are multiple timeframe support levels round 420-415.
- Russell 2000 (IWM): 170 huge.
- Dow (DIA): 334 pivotal.
- Nasdaq (QQQ): 330 possible if can't get back above 365.
- Regional Banks (KRE): 39.80 the July calendar range low.
- Semiconductors (SMH): 133 the 200-DMA with 147 pivotal resistance .
- Transportation (IYT): 225 next support.
- Biotechnology (IBB): 125; if clears, impressive.
- Retail (XRT): 57 key support.
Mish Schneider
MarketGauge.com
Director of Trading Research and Education
recession sp 500 nasdaq equities stocks etf recession small caps commodities gold oilUncategorized
Economic Earthquake Ahead? The Cracks Are Spreading Fast
Economic Earthquake Ahead? The Cracks Are Spreading Fast
Authored by Brandon Smith via Alt-Market.us,
One of my favorite false narratives…
Share this:


Authored by Brandon Smith via Alt-Market.us,
One of my favorite false narratives floating around corporate media platforms has been the argument that the American people “just don’t seem to understand how good the economy really is right now.” If only they would look at the stats, they would realize that we are in the middle of a financial renaissance, right? It must be that people have been brainwashed by negative press from conservative sources…
I have to laugh at this notion because it’s a very common one throughout history – it’s an assertion made by almost every single political regime right before a major collapse. These people always say the same things, and when you study economics as long as I have you can’t help but throw up your hands and marvel at their dedication to the propaganda.
One example that comes to mind immediately is the delusional optimism of the “roaring” 1920s and the lead up to the Great Depression. At the time around 60% of the U.S. population was living in poverty conditions (according to the metrics of the decade) earning less than $2000 a year. However, in the years after WWI ravaged Europe, America’s economic power was considered unrivaled.
The 1920s was an era of mass production and rampant consumerism but it was all fueled by easy access to debt, a condition which had not really existed before in America. It was this illusion of prosperity created by the unchecked application of credit that eventually led to the massive stock market bubble and the crash of 1929. This implosion, along with the Federal Reserve’s policy of raising interest rates into economic weakness, created a black hole in the U.S. financial system for over a decade.
There are two primary tools that various failing regimes will often use to distort the true conditions of the economy: Debt and inflation. In the case of America today, we are experiencing BOTH problems simultaneously and this has made certain economic indicators appear healthy when they are, in fact, highly unstable. The average American knows this is the case because they see the effects everyday. They see the damage to their wallets, to their buying power, in the jobs market and in their quality of life. This is why public faith in the economy has been stuck in the dregs since 2021.
The establishment can flash out-of-context stats in people’s faces, but they can’t force the populace to see a recovery that simply does not exist. Let’s go through a short list of the most faulty indicators and the real reasons why the fiscal picture is not a rosy as the media would like us to believe…
The “miracle” labor market recovery
In the case of the U.S. labor market, we have a clear example of distortion through inflation. The $8 trillion+ dropped on the economy in the first 18 months of the pandemic response sent the system over the edge into stagflation land. Helicopter money has a habit of doing two things very well: Blowing up a bubble in stock markets and blowing up a bubble in retail. Hence, the massive rush by Americans to go out and buy, followed by the sudden labor shortage and the race to hire (mostly for low wage part-time jobs).
The problem with this “miracle” is that inflation leads to price explosions, which we have already experienced. The average American is spending around 30% more for goods, services and housing compared to what they were spending in 2020. This is what happens when you have too much money chasing too few goods and limited production.
The jobs market looks great on paper, but the majority of jobs generated in the past few years are jobs that returned after the covid lockdowns ended. The rest are jobs created through monetary stimulus and the artificial retail rush. Part time low wage service sector jobs are not going to keep the country rolling for very long in a stagflation environment. The question is, what happens now that the stimulus punch bowl has been removed?
Just as we witnessed in the 1920s, Americans have turned to debt to make up for higher prices and stagnant wages by maxing out their credit cards. With the central bank keeping interest rates high, the credit safety net will soon falter. This condition also goes for businesses; the same businesses that will jump headlong into mass layoffs when they realize the party is over. It happened during the Great Depression and it will happen again today.
Cracks in the foundation
We saw cracks in the narrative of the financial structure in 2023 with the banking crisis, and without the Federal Reserve backstop policy many more small and medium banks would have dropped dead. The weakness of U.S. banks is offset by the relative strength of the U.S. dollar, which lures in foreign investors hoping to protect their wealth using dollar denominated assets.
But something is amiss. Gold and bitcoin have rocketed higher along with economically sensitive assets and the dollar. This is the opposite of what’s supposed to happen. Gold and BTC are supposed to be hedges against a weak dollar and a weak economy, right? If global faith in the dollar and in the U.S. economy is so high, why are investors diving into protective assets like gold?
Again, as noted above, inflation distorts everything.
Tens of trillions of extra dollars printed by the Fed are floating around and it’s no surprise that much of that cash is flooding into the economy which simply pushes higher right along with prices on the shelf. But, gold and bitcoin are telling us a more honest story about what’s really happening.
Right now, the U.S. government is adding around $600 billion per month to the national debt as the Fed holds rates higher to fight inflation. This debt is going to crush America’s financial standing for global investors who will eventually ask HOW the U.S. is going to handle that growing millstone? As I predicted years ago, the Fed has created a perfect Catch-22 scenario in which the U.S. must either return to rampant inflation, or, face a debt crisis. In either case, U.S. dollar-denominated assets will lose their appeal and their prices will plummet.
“Healthy” GDP is a complete farce
GDP is the most common out-of-context stat used by governments to convince the citizenry that all is well. It is yet another stat that is entirely manipulated by inflation. It is also manipulated by the way in which modern governments define “economic activity.”
GDP is primarily driven by spending. Meaning, the higher inflation goes, the higher prices go, and the higher GDP climbs (to a point). Eventually prices go too high, credit cards tap out and spending ceases. But, for a short time inflation makes GDP (as well as retail sales) look good.
Another factor that creates a bubble is the fact that government spending is actually included in the calculation of GDP. That’s right, every dollar of your tax money that the government wastes helps the establishment by propping up GDP numbers. This is why government spending increases will never stop – It’s too valuable for them to spend as a way to make the economy appear healthier than it is.
The REAL economy is eclipsing the fake economy
The bottom line is that Americans used to be able to ignore the warning signs because their bank accounts were not being directly affected. This is over. Now, every person in the country is dealing with a massive decline in buying power and higher prices across the board on everything – from food and fuel to housing and financial assets alike. Even the wealthy are seeing a compression to their profit and many are struggling to keep their businesses in the black.
The unfortunate truth is that the elections of 2024 will probably be the turning point at which the whole edifice comes tumbling down. Even if the public votes for change, the system is already broken and cannot be repaired without a complete overhaul.
We have consistently avoided taking our medicine and our disease has gotten worse and worse.
People have lost faith in the economy because they have not faced this kind of uncertainty since the 1930s. Even the stagflation crisis of the 1970s will likely pale in comparison to what is about to happen. On the bright side, at least a large number of Americans are aware of the threat, as opposed to the 1920s when the vast majority of people were utterly conned by the government, the banks and the media into thinking all was well. Knowing is the first step to preparing.
The second step is securing your own financial future – that’s where physical precious metals can play a role. Diversifying your savings with inflation-resistant, uninflatable assets whose intrinsic value doesn’t rely on a counterparty’s promise to pay adds resilience to your savings. That’s the main reason physical gold and silver have been the safe haven store-of-value assets of choice for centuries (among both the elite and the everyday citizen).
* * *
As the world moves away from dollars and toward Central Bank Digital Currencies (CBDCs), is your 401(k) or IRA really safe? A smart and conservative move is to diversify into a physical gold IRA. That way your savings will be in something solid and enduring. Get your FREE info kit on Gold IRAs from Birch Gold Group. No strings attached, just peace of mind. Click here to secure your future today.
Uncategorized
Wendy’s teases new $3 offer for upcoming holiday
The Daylight Savings Time promotion slashes prices on breakfast.
Share this:


Daylight Savings Time, or the practice of advancing clocks an hour in the spring to maximize natural daylight, is a controversial practice because of the way it leaves many feeling off-sync and tired on the second Sunday in March when the change is made and one has one less hour to sleep in.
Despite annual "Abolish Daylight Savings Time" think pieces and online arguments that crop up with unwavering regularity, Daylight Savings in North America begins on March 10 this year.
Related: Coca-Cola has a new soda for Diet Coke fans
Tapping into some people's very vocal dislike of Daylight Savings Time, fast-food chain Wendy's (WEN) is launching a daylight savings promotion that is jokingly designed to make losing an hour of sleep less painful and encourage fans to order breakfast anyway.
Image source: Wendy's.
Promotion wants you to compensate for lost sleep with cheaper breakfast
As it is also meant to drive traffic to the Wendy's app, the promotion allows anyone who makes a purchase of $3 or more through the platform to get a free hot coffee, cold coffee or Frosty Cream Cold Brew.
More Food + Dining:
- Taco Bell menu tries new take on an American classic
- McDonald's menu goes big, brings back fan favorites (with a catch)
- The 10 best food stocks to buy now
Available during the Wendy's breakfast hours of 6 a.m. and 10:30 a.m. (which, naturally, will feel even earlier due to Daylight Savings), the deal also allows customers to buy any of its breakfast sandwiches for $3. Items like the Sausage, Egg and Cheese Biscuit, Breakfast Baconator and Maple Bacon Chicken Croissant normally range in price between $4.50 and $7.
The choice of the latter is quite wide since, in the years following the pandemic, Wendy's has made a concerted effort to expand its breakfast menu with a range of new sandwiches with egg in them and sweet items such as the French Toast Sticks. The goal was both to stand out from competitors with a wider breakfast menu and increase traffic to its stores during early-morning hours.
Wendy's deal comes after controversy over 'dynamic pricing'
But last month, the chain known for the square shape of its burger patties ignited controversy after saying that it wanted to introduce "dynamic pricing" in which the cost of many of the items on its menu will vary depending on the time of day. In an earnings call, chief executive Kirk Tanner said that electronic billboards would allow restaurants to display various deals and promotions during slower times in the early morning and late at night.
Outcry was swift and Wendy's ended up walking back its plans with words that they were "misconstrued" as an intent to surge prices during its most popular periods.
While the company issued a statement saying that any changes were meant as "discounts and value offers" during quiet periods rather than raised prices during busy ones, the reputational damage was already done since many saw the clarification as another way to obfuscate its pricing model.
"We said these menuboards would give us more flexibility to change the display of featured items," Wendy's said in its statement. "This was misconstrued in some media reports as an intent to raise prices when demand is highest at our restaurants."
The Daylight Savings Time promotion, in turn, is also a way to demonstrate the kinds of deals Wendy's wants to promote in its stores without putting up full-sized advertising or posters for what is only relevant for a few days.
Related: Veteran fund manager picks favorite stocks for 2024
stocks pandemicUncategorized
Inside The Most Ridiculous Jobs Report In Recent History: Record 1.2 Million Immigrant Jobs Added In One Month
Inside The Most Ridiculous Jobs Report In Recent History: Record 1.2 Million Immigrant Jobs Added In One Month
Last month we though that the…
Share this:


Last month we though that the January jobs report was the "most ridiculous in recent history" but, boy, were we wrong because this morning the Biden department of goalseeked propaganda (aka BLS) published the February jobs report, and holy crap was that something else. Even Goebbels would blush.
What happened? Let's take a closer look.
On the surface, it was (almost) another blockbuster jobs report, certainly one which nobody expected, or rather just one bank out of 76 expected. Starting at the top, the BLS reported that in February the US unexpectedly added 275K jobs, with just one research analyst (from Dai-Ichi Research) expecting a higher number.
Some context: after last month's record 4-sigma beat, today's print was "only" 3 sigma higher than estimates. Needless to say, two multiple sigma beats in a row used to only happen in the USSR... and now in the US, apparently.

Before we go any further, a quick note on what last month we said was "the most ridiculous jobs report in recent history": it appears the BLS read our comments and decided to stop beclowing itself. It did that by slashing last month's ridiculous print by over a third, and revising what was originally reported as a massive 353K beat to just 229K, a 124K revision, which was the biggest one-month negative revision in two years!

Of course, that does not mean that this month's jobs print won't be revised lower: it will be, and not just that month but every other month until the November election because that's the only tool left in the Biden admin's box: pretend the economic and jobs are strong, then revise them sharply lower the next month, something we pointed out first last summer and which has not failed to disappoint once.
In the past month the Biden department of goalseeking stuff higher before revising it lower, has revised the following data sharply lower:
— zerohedge (@zerohedge) August 30, 2023
- Jobs
- JOLTS
- New Home sales
- Housing Starts and Permits
- Industrial Production
- PCE and core PCE
To be fair, not every aspect of the jobs report was stellar (after all, the BLS had to give it some vague credibility). Take the unemployment rate, after flatlining between 3.4% and 3.8% for two years - and thus denying expectations from Sahm's Rule that a recession may have already started - in February the unemployment rate unexpectedly jumped to 3.9%, the highest since February 2022 (with Black unemployment spiking by 0.3% to 5.6%, an indicator which the Biden admin will quickly slam as widespread economic racism or something).

And then there were average hourly earnings, which after surging 0.6% MoM in January (since revised to 0.5%) and spooking markets that wage growth is so hot, the Fed will have no choice but to delay cuts, in February the number tumbled to just 0.1%, the lowest in two years...

... for one simple reason: last month's average wage surge had nothing to do with actual wages, and everything to do with the BLS estimate of hours worked (which is the denominator in the average wage calculation) which last month tumbled to just 34.1 (we were led to believe) the lowest since the covid pandemic...

... but has since been revised higher while the February print rose even more, to 34.3, hence why the latest average wage data was once again a product not of wages going up, but of how long Americans worked in any weekly period, in this case higher from 34.1 to 34.3, an increase which has a major impact on the average calculation.

While the above data points were examples of some latent weakness in the latest report, perhaps meant to give it a sheen of veracity, it was everything else in the report that was a problem starting with the BLS's latest choice of seasonal adjustments (after last month's wholesale revision), which have gone from merely laughable to full clownshow, as the following comparison between the monthly change in BLS and ADP payrolls shows. The trend is clear: the Biden admin numbers are now clearly rising even as the impartial ADP (which directly logs employment numbers at the company level and is far more accurate), shows an accelerating slowdown.

But it's more than just the Biden admin hanging its "success" on seasonal adjustments: when one digs deeper inside the jobs report, all sorts of ugly things emerge... such as the growing unprecedented divergence between the Establishment (payrolls) survey and much more accurate Household (actual employment) survey. To wit, while in January the BLS claims 275K payrolls were added, the Household survey found that the number of actually employed workers dropped for the third straight month (and 4 in the past 5), this time by 184K (from 161.152K to 160.968K).

This means that while the Payrolls series hits new all time highs every month since December 2020 (when according to the BLS the US had its last month of payrolls losses), the level of Employment has not budged in the past year. Worse, as shown in the chart below, such a gaping divergence has opened between the two series in the past 4 years, that the number of Employed workers would need to soar by 9 million (!) to catch up to what Payrolls claims is the employment situation.

There's more: shifting from a quantitative to a qualitative assessment, reveals just how ugly the composition of "new jobs" has been. Consider this: the BLS reports that in February 2024, the US had 132.9 million full-time jobs and 27.9 million part-time jobs. Well, that's great... until you look back one year and find that in February 2023 the US had 133.2 million full-time jobs, or more than it does one year later! And yes, all the job growth since then has been in part-time jobs, which have increased by 921K since February 2023 (from 27.020 million to 27.941 million).

Here is a summary of the labor composition in the past year: all the new jobs have been part-time jobs!

But wait there's even more, because now that the primary season is over and we enter the heart of election season and political talking points will be thrown around left and right, especially in the context of the immigration crisis created intentionally by the Biden administration which is hoping to import millions of new Democratic voters (maybe the US can hold the presidential election in Honduras or Guatemala, after all it is their citizens that will be illegally casting the key votes in November), what we find is that in February, the number of native-born workers tumbled again, sliding by a massive 560K to just 129.807 million. Add to this the December data, and we get a near-record 2.4 million plunge in native-born workers in just the past 3 months (only the covid crash was worse)!

The offset? A record 1.2 million foreign-born (read immigrants, both legal and illegal but mostly illegal) workers added in February!

Said otherwise, not only has all job creation in the past 6 years has been exclusively for foreign-born workers...

... but there has been zero job-creation for native born workers since June 2018!

This is a huge issue - especially at a time of an illegal alien flood at the southwest border...

... and is about to become a huge political scandal, because once the inevitable recession finally hits, there will be millions of furious unemployed Americans demanding a more accurate explanation for what happened - i.e., the illegal immigration floodgates that were opened by the Biden admin.
Which is also why Biden's handlers will do everything in their power to insure there is no official recession before November... and why after the election is over, all economic hell will finally break loose. Until then, however, expect the jobs numbers to get even more ridiculous.


Wendy’s has a new deal for daylight savings time haters


Watch Live: President Biden Reminds Americans Just How Good They’ve Got It Thanks To Him


Watch: President Biden Delivers The “Darkest, Most Un-American Speech Given By A President”


These Are The 5 Charts The FDIC Does Not Want You Paying Attention To


Interest rates, the best it gets. It’s time to deploy cash


Is the biotech market rally real? Data suggest comeback in private, public markets


People Who Received Ivermectin Were Better Off, Study Finds


COVID-19 May Lead To Persistent Cognitive Impairment, Brain Fog, And Lower IQ Scores


Stock Market’s Top Will Outlast Your Disbelief


COVID-19 Lockdowns Had High Health, Economic Costs: Swedish Study
-

 Uncategorized2 weeks ago
All Of The Elements Are In Place For An Economic Crisis Of Staggering Proportions
-

 Uncategorized1 month ago
Cathie Wood sells a major tech stock (again)
-

 Uncategorized3 weeks ago
California Counties Could Be Forced To Pay $300 Million To Cover COVID-Era Program
-

 Uncategorized2 weeks ago
Apparel Retailer Express Moving Toward Bankruptcy
-

 Uncategorized3 weeks ago
Industrial Production Decreased 0.1% in January
-

 International7 hours ago
Walmart launches clever answer to Target’s new membership program
-

 International1 month ago
War Delirium
-

 Uncategorized3 weeks ago
RFK Jr: The Wuhan Cover-Up & The Rise Of The Biowarfare-Industrial Complex