Bitcoin And The Death Of The US Dollar
The long-awaited demise of the most destructive fiat currency in history looms on the horizon.
Share this:

The long-awaited demise of the most destructive fiat currency in history looms on the horizon.
There’s been lots of talks about the U.S. dollar losing its status as the world’s reserve currency. While most people still wonder when this is going to happen, I’m here to bring you the shocking truth: It’s already happening right in front of us. But most people fail to realize this because they don’t understand the signs. So, let me break it down for you so you know exactly how this is unfolding and, most importantly, how to protect yourself.
Since the 1700s, we’ve seen 750 different currencies in the world and only 20% of those remain. All have been devalued. This means they buy less today than they did originally, and the U.S. dollar is no exception.
Why Do Currencies Die?
According to Ray Dalio, founder of the world’s largest hedge fund, Bridgewater Associates, currencies die when a country racks up too much debt. The country ends up with four different options:
- Austerity (spending less)
- Debt defaults and restructurings (e.g., bankruptcy)
- Wealth redistribution (e.g. raise taxes)
- Printing money and devaluing it
Of all these options, governments always choose to print money because that’s the “easy” route. They don’t have to cut down on spending, piss off creditors or hurt the rich. But that’s how things start to go south for a currency. Let me clarify this for you with historical examples.
How The U.S. Dollar Became The World’s Reserve Currency
In 1914, when WWI broke out, many European countries abandoned the gold standard so that they could pay for military expenses with paper money instead of gold. The United States became the lender of choice for several countries and, as a result, the USD unofficially replaced the British pound as the world’s new leading currency by 1919.
During WWII, the United States found itself in a privileged position to profit from the war. Before joining the conflict, we sold ammo, weapons and other supplies to the Allies in exchange for gold. As a result, we ended up amassing two-thirds of all the world’s gold.
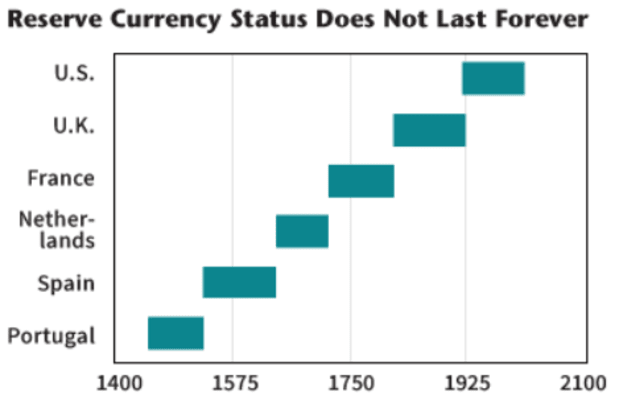
When countries came together at the Bretton Woods Agreement, they realized it was time to have a worldwide currency system that was linked to gold. Since the United States owned most of the world’s reserves, and the U.S. dollar was also backed by it, USD officially claimed its world’s reserve currency position.
While most people think that the transition from British pound to U.S. dollar happened when the agreement was signed, it was actually a 30-year transition that started way back in 1914 when countries started to borrow dollars from the United States.
So when people ask me when the next transition is going to happen, I say, “We’re in the middle of it.” The world is already de-dollarizing and the signs are clear; you just need to know which ones to look at.
The Downfall Of The Dollar
According to the International Monetary Fund (IMF), USD dominance is already declining. In 2017, the dollar composed 64% of the world’s reserves. Today, it’s down to about 59%.

Another obvious sign is in the U.S. Dollar Index (DXY), which is down 10% this year alone.

Of course, the pandemic plays a role in all this and the mainstream media is taking notice.


But here’s the big problem: The metrics above only tell you part of the story because you’re comparing USD with a basket of other currencies. In other words, you’re only looking at fiat currencies.
Instead, we should be looking at what money is used for: purchasing goods and services. That means we need to look at the dollar’s purchasing power. Here’s what I mean: If you compare gold to the dollar over time, you can see it cost $20 to buy an ounce of gold in the early 1900s. It jumped to $35/oz in 1933, then it went haywire after 1971.
Today, an ounce of gold costs over $1,800. Does this sound like the USD is holding its purchasing power? I don’t think so.

What about real estate? How has the USD held its purchasing power when compared to real estate? You might think home prices are going up, hitting all-time highs. But is real estate really going up or is the dollar simply losing its value?
The index below highlights the loss of USD’s purchasing power compared to real estate. The truth is home prices aren’t just going up; it just takes more dollars to buy them.

We can also take a look at oil. It’s been going up similarly to gold, so is it increasing in value or is it just another sign of the dollar losing its purchasing power?

Of course, I couldn’t leave out one of the hottest assets today — bitcoin. This is the price of BTC compared to USD. Do you see any resemblance with the other assets I just showed you?

Is History Doomed To Repeat Itself?
Now, let’s bring it all together and compare our current situation with a historic example. Before we proceed, let me warn you: This will give you a “zoomed out” perspective and most likely flip your mindset entirely.
This is the case of the Weimar Republic (Germany) in the early 1900s.
In 1922, Germany defaulted on debt to repay WWI reparations. In order to recoup their funds, France and Belgium invaded the Ruhr Valley — the German industrial epicenter.
As a response to the invasion, the German government ordered all workers to stay at home and not work — this is called “passive resistance.” Here’s where the Weimar Republic’s death spiral starts.
The country was already crippled by debt, but they still had to find a way to come up with cash to pay its workers. So what did they do? They started to print money (the fourth option we talked about earlier).
Now, take a look at what happened to their Consumer Price Index (CPI). The CPI measures the average change in prices that consumers pay for goods and services (aka inflation).

How did this affect the population? A good example is a loaf of bread, which cost $0.13 in 1914. That same loaf of bread cost $0.19 two years later in 1916. By 1919, the price had doubled to $0.26, then $1.20 in 1920 and $3.50 in 1922.
Once they started to print money in 1922, that same loaf of bread went from $3.50 to $100,000,000,000 ($100 billion!) by December 1923. That’s when the German mark collapsed.
During that period, you literally needed wheelbarrows to move your cash around. Eventually, the currency was worth less than wood, so they burned cash to heat their homes.


It’s important to note that, at the beginning, the loaf of bread went up very slowly. At that time, most people didn’t realize what was happening until it was too late. Like the boiling frog fable.
The Parallels Between The U.S. And The Weimar Republic
We can't go back in time and change the past. But we can look at historical examples and compare them to our current reality, so we don’t repeat the same mistakes.
The first parallel between the United States and the Weimar Republic is money printing. Take a look at the United States’ M1 and M2, which are measurements of the amount of dollars in circulation: M2 is also a key economic indicator used to forecast inflation.


It goes without saying, the resemblance between these indicators and the German CPI is astonishing.
The third parallel we can draw from the Weimar Republic is our crippling debt. Defaulting on debt was the first “domino piece” that led to other events unfolding. In 2021, the United States grew to a record budget deficit of $1.7 trillion in the first half of the fiscal year. It means we’re spending more than we’re bringing in — exponentially more than in previous years.

It’s All A Matter Of Perspective
The reason I bring you all these data is so you can zoom out and see things from a better perspective. In the book, “When Money Dies” by Adam Fergusson, he says most Germans couldn’t see what was really happening. A lot of them literally thought they were getting rich because they thought their assets were going up in value.
But now you know that was not the case, it was actually the German mark losing purchasing power. So they started banking their cash, selling their assets and trading them for currency. At the end of the day, they ended up with a literal pile of worthless paper.
Now, if you were in the Weimar Republic at that time, what would you have done?

The chart above shows the price of gold from 1915 to 1935. If you’d bought gold around 1920 and held on to it until 1935 that would’ve been the trade of the decade for you. But here’s the biggest takeaway: It’s easy to see the upward trend from this perspective, but it wasn’t a clear, straight line for people living at that time. It was a very volatile period.
So let me ask you: What are you doing with your money now? Some people are cashing out, trading their assets like real estate, gold, bitcoin or even stocks for dollars because they’re at all-time highs. The same way the Germans did.
If we continue to increase debt and print money, the USD will continue to lose its value and its position as the world’s reserve currency. The loaf of bread is going up and you don’t want to end up with a pile of worthless cash.
My advice to you is to find inflation hedges, assets that are going up with the rate of inflation. Most importantly, start now before it’s too late. Don’t wait for the “next Bretton Woods Agreement,” the transition is already happening — and it’s happening right in front of you.
This is a guest post by Mark Moss. Opinions expressed are entirely their own and do not necessarily reflect those of BTC, Inc. or Bitcoin Magazine.
stocks pandemic bitcoin btc real estate currencies pound us dollar gold oilGovernment
Low Iron Levels In Blood Could Trigger Long COVID: Study
Low Iron Levels In Blood Could Trigger Long COVID: Study
Authored by Amie Dahnke via The Epoch Times (emphasis ours),
People with inadequate…
Share this:


Authored by Amie Dahnke via The Epoch Times (emphasis ours),
People with inadequate iron levels in their blood due to a COVID-19 infection could be at greater risk of long COVID.
A new study indicates that problems with iron levels in the bloodstream likely trigger chronic inflammation and other conditions associated with the post-COVID phenomenon. The findings, published on March 1 in Nature Immunology, could offer new ways to treat or prevent the condition.
Long COVID Patients Have Low Iron Levels
Researchers at the University of Cambridge pinpointed low iron as a potential link to long-COVID symptoms thanks to a study they initiated shortly after the start of the pandemic. They recruited people who tested positive for the virus to provide blood samples for analysis over a year, which allowed the researchers to look for post-infection changes in the blood. The researchers looked at 214 samples and found that 45 percent of patients reported symptoms of long COVID that lasted between three and 10 months.
In analyzing the blood samples, the research team noticed that people experiencing long COVID had low iron levels, contributing to anemia and low red blood cell production, just two weeks after they were diagnosed with COVID-19. This was true for patients regardless of age, sex, or the initial severity of their infection.
According to one of the study co-authors, the removal of iron from the bloodstream is a natural process and defense mechanism of the body.
But it can jeopardize a person’s recovery.
“When the body has an infection, it responds by removing iron from the bloodstream. This protects us from potentially lethal bacteria that capture the iron in the bloodstream and grow rapidly. It’s an evolutionary response that redistributes iron in the body, and the blood plasma becomes an iron desert,” University of Oxford professor Hal Drakesmith said in a press release. “However, if this goes on for a long time, there is less iron for red blood cells, so oxygen is transported less efficiently affecting metabolism and energy production, and for white blood cells, which need iron to work properly. The protective mechanism ends up becoming a problem.”
The research team believes that consistently low iron levels could explain why individuals with long COVID continue to experience fatigue and difficulty exercising. As such, the researchers suggested iron supplementation to help regulate and prevent the often debilitating symptoms associated with long COVID.
“It isn’t necessarily the case that individuals don’t have enough iron in their body, it’s just that it’s trapped in the wrong place,” Aimee Hanson, a postdoctoral researcher at the University of Cambridge who worked on the study, said in the press release. “What we need is a way to remobilize the iron and pull it back into the bloodstream, where it becomes more useful to the red blood cells.”
The research team pointed out that iron supplementation isn’t always straightforward. Achieving the right level of iron varies from person to person. Too much iron can cause stomach issues, ranging from constipation, nausea, and abdominal pain to gastritis and gastric lesions.
1 in 5 Still Affected by Long COVID
COVID-19 has affected nearly 40 percent of Americans, with one in five of those still suffering from symptoms of long COVID, according to the U.S. Centers for Disease Control and Prevention (CDC). Long COVID is marked by health issues that continue at least four weeks after an individual was initially diagnosed with COVID-19. Symptoms can last for days, weeks, months, or years and may include fatigue, cough or chest pain, headache, brain fog, depression or anxiety, digestive issues, and joint or muscle pain.
Uncategorized
February Employment Situation
By Paul Gomme and Peter Rupert The establishment data from the BLS showed a 275,000 increase in payroll employment for February, outpacing the 230,000…
Share this:


By Paul Gomme and Peter Rupert
The establishment data from the BLS showed a 275,000 increase in payroll employment for February, outpacing the 230,000 average over the previous 12 months. The payroll data for January and December were revised down by a total of 167,000. The private sector added 223,000 new jobs, the largest gain since May of last year.

Temporary help services employment continues a steep decline after a sharp post-pandemic rise.


Average hours of work increased from 34.2 to 34.3. The increase, along with the 223,000 private employment increase led to a hefty increase in total hours of 5.6% at an annualized rate, also the largest increase since May of last year.

The establishment report, once again, beat “expectations;” the WSJ survey of economists was 198,000. Other than the downward revisions, mentioned above, another bit of negative news was a smallish increase in wage growth, from $34.52 to $34.57.

The household survey shows that the labor force increased 150,000, a drop in employment of 184,000 and an increase in the number of unemployed persons of 334,000. The labor force participation rate held steady at 62.5, the employment to population ratio decreased from 60.2 to 60.1 and the unemployment rate increased from 3.66 to 3.86. Remember that the unemployment rate is the number of unemployed relative to the labor force (the number employed plus the number unemployed). Consequently, the unemployment rate can go up if the number of unemployed rises holding fixed the labor force, or if the labor force shrinks holding the number unemployed unchanged. An increase in the unemployment rate is not necessarily a bad thing: it may reflect a strong labor market drawing “marginally attached” individuals from outside the labor force. Indeed, there was a 96,000 decline in those workers.


Earlier in the week, the BLS announced JOLTS (Job Openings and Labor Turnover Survey) data for January. There isn’t much to report here as the job openings changed little at 8.9 million, the number of hires and total separations were little changed at 5.7 million and 5.3 million, respectively.

As has been the case for the last couple of years, the number of job openings remains higher than the number of unemployed persons.

Also earlier in the week the BLS announced that productivity increased 3.2% in the 4th quarter with output rising 3.5% and hours of work rising 0.3%.

The bottom line is that the labor market continues its surprisingly (to some) strong performance, once again proving stronger than many had expected. This strength makes it difficult to justify any interest rate cuts soon, particularly given the recent inflation spike.
unemployment pandemic unemploymentSpread & Containment
Another beloved brewery files Chapter 11 bankruptcy
The beer industry has been devastated by covid, changing tastes, and maybe fallout from the Bud Light scandal.
Share this:


Before the covid pandemic, craft beer was having a moment. Most cities had multiple breweries and taprooms with some having so many that people put together the brewery version of a pub crawl.
It was a period where beer snobbery ruled the day and it was not uncommon to hear bar patrons discuss the makeup of the beer the beer they were drinking. This boom period always seemed destined for failure, or at least a retraction as many markets seemed to have more craft breweries than they could support.
Related: Fast-food chain closes more stores after Chapter 11 bankruptcy
The pandemic, however, hastened that downfall. Many of these local and regional craft breweries counted on in-person sales to drive their business.
And while many had local and regional distribution, selling through a third party comes with much lower margins. Direct sales drove their business and the pandemic forced many breweries to shut down their taprooms during the period where social distancing rules were in effect.
During those months the breweries still had rent and employees to pay while little money was coming in. That led to a number of popular beermakers including San Francisco's nationally-known Anchor Brewing as well as many regional favorites including Chicago’s Metropolitan Brewing, New Jersey’s Flying Fish, Denver’s Joyride Brewing, Tampa’s Zydeco Brew Werks, and Cleveland’s Terrestrial Brewing filing bankruptcy.
Some of these brands hope to survive, but others, including Anchor Brewing, fell into Chapter 7 liquidation. Now, another domino has fallen as a popular regional brewery has filed for Chapter 11 bankruptcy protection.
Image source: Shutterstock
Covid is not the only reason for brewery bankruptcies
While covid deserves some of the blame for brewery failures, it's not the only reason why so many have filed for bankruptcy protection. Overall beer sales have fallen driven by younger people embracing non-alcoholic cocktails, and the rise in popularity of non-beer alcoholic offerings,
Beer sales have fallen to their lowest levels since 1999 and some industry analysts
"Sales declined by more than 5% in the first nine months of the year, dragged down not only by the backlash and boycotts against Anheuser-Busch-owned Bud Light but the changing habits of younger drinkers," according to data from Beer Marketer’s Insights published by the New York Post.
Bud Light parent Anheuser Busch InBev (BUD) faced massive boycotts after it partnered with transgender social media influencer Dylan Mulvaney. It was a very small partnership but it led to a right-wing backlash spurred on by Kid Rock, who posted a video on social media where he chastised the company before shooting up cases of Bud Light with an automatic weapon.
Another brewery files Chapter 11 bankruptcy
Gizmo Brew Works, which does business under the name Roth Brewing Company LLC, filed for Chapter 11 bankruptcy protection on March 8. In its filing, the company checked the box that indicates that its debts are less than $7.5 million and it chooses to proceed under Subchapter V of Chapter 11.
"Both small business and subchapter V cases are treated differently than a traditional chapter 11 case primarily due to accelerated deadlines and the speed with which the plan is confirmed," USCourts.gov explained.
Roth Brewing/Gizmo Brew Works shared that it has 50-99 creditors and assets $100,000 and $500,000. The filing noted that the company does expect to have funds available for unsecured creditors.
The popular brewery operates three taprooms and sells its beer to go at those locations.
"Join us at Gizmo Brew Works Craft Brewery and Taprooms located in Raleigh, Durham, and Chapel Hill, North Carolina. Find us for entertainment, live music, food trucks, beer specials, and most importantly, great-tasting craft beer by Gizmo Brew Works," the company shared on its website.
The company estimates that it has between $1 and $10 million in liabilities (a broad range as the bankruptcy form does not provide a space to be more specific).
Gizmo Brew Works/Roth Brewing did not share a reorganization or funding plan in its bankruptcy filing. An email request for comment sent through the company's contact page was not immediately returned.
bankruptcy pandemic social distancing


Walmart launches clever answer to Target’s new membership program


EyePoint poaches medical chief from Apellis; Sandoz CFO, longtime BioNTech exec to retire


Wendy’s has a new deal for daylight savings time haters


Watch Live: President Biden Reminds Americans Just How Good They’ve Got It Thanks To Him


Catastrophic Risk: Investing and Business Implications


When Military Rule Supplants Democracy


Racial and Ethnic Wealth Inequality in the Post‑Pandemic Era


Redefining Poverty: Towards a Transpartisan Approach


The Digest #187


Dropping Like a Stone: ON RRP Take‑up in the Second Half of 2023
-

 Uncategorized2 weeks ago
All Of The Elements Are In Place For An Economic Crisis Of Staggering Proportions
-

 Uncategorized1 month ago
Cathie Wood sells a major tech stock (again)
-

 Uncategorized3 weeks ago
California Counties Could Be Forced To Pay $300 Million To Cover COVID-Era Program
-

 Uncategorized2 weeks ago
Apparel Retailer Express Moving Toward Bankruptcy
-

 Uncategorized3 weeks ago
Industrial Production Decreased 0.1% in January
-
International1 day ago
Walmart launches clever answer to Target’s new membership program
-

 Uncategorized3 weeks ago
RFK Jr: The Wuhan Cover-Up & The Rise Of The Biowarfare-Industrial Complex
-

 Uncategorized3 weeks ago
GOP Efforts To Shore Up Election Security In Swing States Face Challenges