Uncategorized
Why Do Tech Stocks Go Down When Interest Rates Rise?
Key Points The year 2022 was a brutal one for companies in the tech sector. When tech stocks crash, investors … Read more
Share this:


Key Points
- The Federal Reserve sets interest rates in order to facilitate certain economic conditions.
- When rates rise, cash-hungry companies tend to suffer, like tech stocks.
- The correlation between interest rates and tech stocks doesn’t always play out as expected though.
- 5 stocks we like better than Alphabet
The year 2022 was a brutal one for companies in the tech sector. When tech stocks crash, investors perk up and look for reasons why. In this case, one cause sticks out above the rest — rising interest rates. Why do tech stocks go down when interest rates rise?
Rising interest rates can harm any stock, but tech companies tend to feel the burn more than others.
Overview of Rising Rates
In March 2023, the Federal Reserve raised the federal funds rate by 25 basis points, bringing the benchmark interest rate to 4.5%. The federal funds rate is known as the benchmark because it sets the standard for which banks lend to each other, and this benchmark rate heavily influences most other interest rates (i.e., mortgage rates).
Why does the Federal Reserve raise (and lower) interest rates? Because the Fed has what’s known as a dual mandate: keep prices stable and encourage maximum sustainable employment. Price stability means keeping inflation at a moderate level, and the Fed’s primary tool for dealing with inflation is setting interest rates.
Inflation is a tricky beast, and the Fed aims for a 2% core inflation rate — low enough to keep the economy from overheating but high enough to encourage investment and prevent deflation.
Since the end of the Great Recession into the beginning of the COVID-19 pandemic, inflation has been at or below this 2% target. And with inflation low, the stock market benefitted, especially growth-focused tech stocks that feasted on easy money.
But the pandemic created a massive supply and demand imbalance as prices skyrocketed. In response, the Federal Reserve began raising rates in a hurry to cool demand and bring inflation back to a moderate level. And what cohort of stocks was hurt most by this action? Tech stocks, of course!

Overview of Tech Stocks
So why do interest rates affect tech stocks? Companies in the tech sector are innovators, but innovation doesn’t often come cheap.
While some tech stocks could be considered value stocks, most companies in the tech sector (especially those covered in financial media) are growth stocks. Companies looking for growth tend to spend lots of money to bring their products and services into the mainstream.
Tech stocks vary from small-cap startups to some of the world’s largest and most successful companies. You’ve probably heard of some of the big ones like Apple Inc. (NASDAQ:AAPL), Microsoft Corp. (NASDAQ:MSFT) and Google, now Alphabet Inc. (NASDAQ:GOOG).

We still haven’t answered the question, “why do tech stocks fall when interest rates rise?”. While plenty of tech firms are large conglomerates, many more are small to mid-cap firms without endless access to cheap capital.
Tech stocks focus heavily on research and development, so they often reinvest excess profits back into the firm and don’t keep a lot of cash on hand (well, except Apple). Even large-cap companies launching new products or services must borrow money to finance their ventures.
When interest rates rise, the cost of borrowing capital also increases, which isn’t felt evenly throughout the different sectors of the market. Banks like JPMorgan Chase and Co. (NYSE: JPM) or utility providers like Duke Energy Co. (NYSE:DUK) usually don’t suffer as much when rates are rising since they don’t need capital infusions the way tech stocks do.

Look at the two charts above; Google slumped as rates rose, but JPMorgan Chase was far less affected. Now these are just two examples in a market filled with thousands of different stocks, but tech stocks and rising rates have often been a sour mix.
Rising Rates and Tech Stocks
While tech stocks and high-interest rates don’t usually get along, it’s not a slam-dunk investment to buy tech when rates fall or sell tech when rates rise. The question of why interest rates affect tech stocks gets murkier when compared on a chart. Here’s the Technology Select Sector SDPR Fund (NYSE: XLK), a broad-based tech ETF, compared to the S&P 500 over the last 20 years.

Rates plummeted following the dot-com bust in 2000, but it wasn’t enough to save tech stocks from falling harder than the rest of the market. The federal funds rate stayed around 1% until 2004, then steadily rose to 5% in 2007 before the Great Recession.
Despite rising rates, the tech sector didn’t materially underperform the S&P 500 during that time frame. Following the Great Recession, rates stayed near zero until 2016. From 2016 to 2019, rates jumped over 2% from zero, but tech outperformed the S&P 500 during these three years.
When rates dropped to near zero during the COVID-19 pandemic, tech rapidly outperformed the overall market and stayed ahead of the pack until 2021. Even though the Federal Reserve signaled that rate hikes were coming, the tech bear market began when rates were still effectively zero. In 2022, tech stocks languished as rates rose rapidly but recovered in 2023 when the rate hikes began to slow.
The lesson here? If someone asks why tech stocks are down, the answer isn’t automatically high rates. Based on yesterday’s strategies, the market enjoys taking advantage of folks to invest, and the relationship between rates and tech stocks can be complicated. Theoretically, it’s easy to understand why tech stocks are sensitive to interest rates, but results vary in practice.
Prospects for Tech Stocks in 2023
Despite the rough 2022, the start of 2023 has been promising for the tech sector. The highs of 2021 are still a ways off, but the Invesco QQQ Trust (NASDAQ:QQQ), the large-cap tech ETF, has gained nearly 20% in the first four months of 2023.

With inflation numbers dropping in line with expectations, the rate hike pace has slowed. Unlike 2022, few market prognosticators expect 75 basis point rate hikes in 2023. However, even if the Federal Reserve stops hiking rates this year, they’ve indicated that 4% to 5% rates will likely be here for some time.
As shown in the examples above, (relatively) elevated interest rates are only sometimes a hindrance to tech stocks, but there are better environments for the cash-hungry sector.
Factors Influencing Technology Stocks
Interest rates aren’t the only thing weighing on tech stocks. Here are three more factors to consider with tech stock investing.
Economic Uncertainty
Not only do recessions and bear markets hurt the tech sector, but so can macroeconomic and geopolitical events. For instance, the COVID-19 pandemic hampered many different supply chains, including the microprocessors and digital components needed by tech startups.
Inflation
Inflation can hurt any company without the power to raise prices, but tech stocks can be affected even more since inflation is usually followed by periods of rising interest rates. Additionally, smaller tech companies without meaningful profits may be unable to absorb price increases from their suppliers.
Corporate Earnings
Tech investors are looking for companies well positioned for growth, meaning earnings must keep pace with expectations. Tech stocks are often more about potential than profit initially, but eventually, investors will want to see the company grow sales as well as hype.
Future of Investing in Tech Stocks
Investing in tech has always been an exciting proposition. Not only do many of the market’s biggest winners, like Apple and Microsoft reside in the sector, but these companies have produced some of the most game-changing innovations of the last 50 years.
Think of products and services we depend on today that didn’t even exist 20 years ago — smartphones, rideshare, streaming services and wearing medical devices. However, tech is a volatile sector, and many innovations will fail. Never invest in a tech stock without researching the company and ensuring you agree with its mission.
High Rates and Tech Stocks Are a Mixed Bag
High rates have rarely been well-received by the tech sector, but the performance of the stocks shows varied results, especially over the last 20 years. Declining rates didn’t help the tech sector following the dot-com bubble, but the low rate environment following the Great Recession led to tech outperforming the S&P 500.
While rising rate environments should hurt tech, you can’t use simple heuristics to make investment decisions since markets rarely play out as the crowd predicts.
FAQs
Will tech stocks bounce back? Here are a few common questions about rates and the tech sector.
Do higher interest rates hurt tech stocks?
Higher interest rates often hurt tech since those companies have high borrowing needs, but stock performance doesn’t always match rate hikes.
Why do tech stocks fall with higher interest rates?
Tech companies need more frequent capital infusions, and capital gets expensive to acquire when rates are high.
Why does inflation cause tech stocks to drop?
Inflation can hurt tech stocks by increasing the costs of necessary products or services and bringing in higher rates. When inflation is high, the Federal Reserve seeks to limit the money supply through high rates to bring economic forces back into balance.
Should you invest $1,000 in Alphabet right now?
Before you consider Alphabet, you’ll want to hear this.
MarketBeat keeps track of Wall Street’s top-rated and best performing research analysts and the stocks they recommend to their clients on a daily basis. MarketBeat has identified the five stocks that top analysts are quietly whispering to their clients to buy now before the broader market catches on… and Alphabet wasn’t on the list.
While Alphabet currently has a “Moderate Buy” rating among analysts, top-rated analysts believe these five stocks are better buys.
The post Why Do Tech Stocks Go Down When Interest Rates Rise? appeared first on MarketBeat.
recession pandemic covid-19 sp 500 nasdaq stocks fed federal reserve mortgage rates etf small-cap recession interest ratesUncategorized
Tight inventory and frustrated buyers challenge agents in Virginia
With inventory a little more than half of what it was pre-pandemic, agents are struggling to find homes for clients in Virginia.
Share this:

No matter where you are in the state, real estate agents in Virginia are facing low inventory conditions that are creating frustrating scenarios for their buyers.
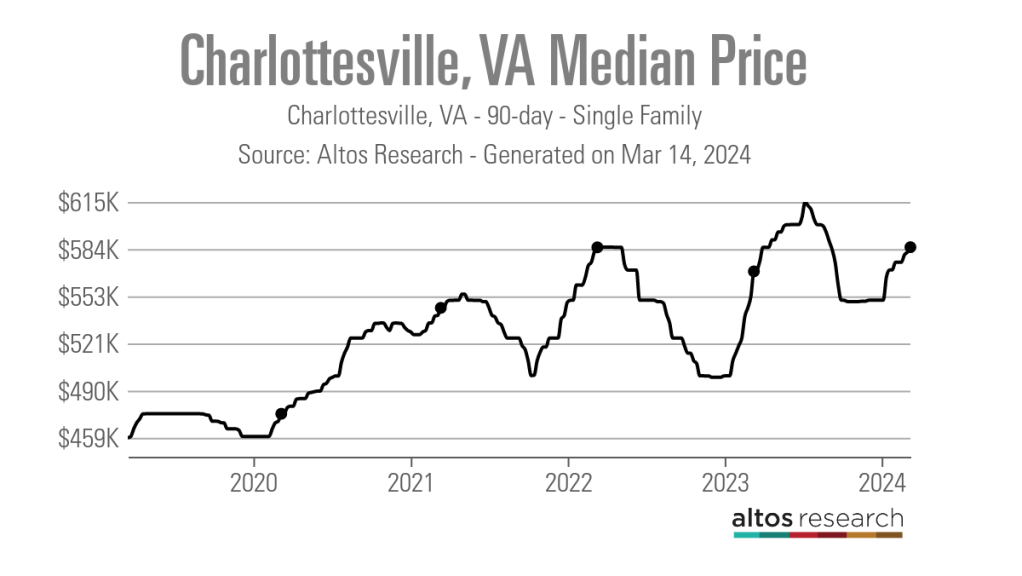
“I think people are getting used to the interest rates where they are now, but there is just a huge lack of inventory,” said Chelsea Newcomb, a RE/MAX Realty Specialists agent based in Charlottesville. “I have buyers that are looking, but to find a house that you love enough to pay a high price for — and to be at over a 6.5% interest rate — it’s just a little bit harder to find something.”
Newcomb said that interest rates and higher prices, which have risen by more than $100,000 since March 2020, according to data from Altos Research, have caused her clients to be pickier when selecting a home.
“When rates and prices were lower, people were more willing to compromise,” Newcomb said.
Out in Wise, Virginia, near the westernmost tip of the state, RE/MAX Cavaliers agent Brett Tiller and his clients are also struggling to find suitable properties.
“The thing that really stands out, especially compared to two years ago, is the lack of quality listings,” Tiller said. “The slightly more upscale single-family listings for move-up buyers with children looking for their forever home just aren’t coming on the market right now, and demand is still very high.”
Statewide, Virginia had a 90-day average of 8,068 active single-family listings as of March 8, 2024, down from 14,471 single-family listings in early March 2020 at the onset of the COVID-19 pandemic, according to Altos Research. That represents a decrease of 44%.

In Newcomb’s base metro area of Charlottesville, there were an average of only 277 active single-family listings during the same recent 90-day period, compared to 892 at the onset of the pandemic. In Wise County, there were only 56 listings.
Due to the demand from move-up buyers in Tiller’s area, the average days on market for homes with a median price of roughly $190,000 was just 17 days as of early March 2024.
“For the right home, which is rare to find right now, we are still seeing multiple offers,” Tiller said. “The demand is the same right now as it was during the heart of the pandemic.”
According to Tiller, the tight inventory has caused homebuyers to spend up to six months searching for their new property, roughly double the time it took prior to the pandemic.
For Matt Salway in the Virginia Beach metro area, the tight inventory conditions are creating a rather hot market.
“Depending on where you are in the area, your listing could have 15 offers in two days,” the agent for Iron Valley Real Estate Hampton Roads | Virginia Beach said. “It has been crazy competition for most of Virginia Beach, and Norfolk is pretty hot too, especially for anything under $400,000.”
According to Altos Research, the Virginia Beach-Norfolk-Newport News housing market had a seven-day average Market Action Index score of 52.44 as of March 14, making it the seventh hottest housing market in the country. Altos considers any Market Action Index score above 30 to be indicative of a seller’s market.

Further up the coastline on the vacation destination of Chincoteague Island, Long & Foster agent Meghan O. Clarkson is also seeing a decent amount of competition despite higher prices and interest rates.
“People are taking their time to actually come see things now instead of buying site unseen, and occasionally we see some seller concessions, but the traffic and the demand is still there; you might just work a little longer with people because we don’t have anything for sale,” Clarkson said.
“I’m busy and constantly have appointments, but the underlying frenzy from the height of the pandemic has gone away, but I think it is because we have just gotten used to it.”
While much of the demand that Clarkson’s market faces is for vacation homes and from retirees looking for a scenic spot to retire, a large portion of the demand in Salway’s market comes from military personnel and civilians working under government contracts.
“We have over a dozen military bases here, plus a bunch of shipyards, so the closer you get to all of those bases, the easier it is to sell a home and the faster the sale happens,” Salway said.
Due to this, Salway said that existing-home inventory typically does not come on the market unless an employment contract ends or the owner is reassigned to a different base, which is currently contributing to the tight inventory situation in his market.
Things are a bit different for Tiller and Newcomb, who are seeing a decent number of buyers from other, more expensive parts of the state.
“One of the crazy things about Louisa and Goochland, which are kind of like suburbs on the western side of Richmond, is that they are growing like crazy,” Newcomb said. “A lot of people are coming in from Northern Virginia because they can work remotely now.”
With a Market Action Index score of 50, it is easy to see why people are leaving the Washington-Arlington-Alexandria market for the Charlottesville market, which has an index score of 41.
In addition, the 90-day average median list price in Charlottesville is $585,000 compared to $729,900 in the D.C. area, which Newcomb said is also luring many Virginia homebuyers to move further south.

“They are very accustomed to higher prices, so they are super impressed with the prices we offer here in the central Virginia area,” Newcomb said.
For local buyers, Newcomb said this means they are frequently being outbid or outpriced.
“A couple who is local to the area and has been here their whole life, they are just now starting to get their mind wrapped around the fact that you can’t get a house for $200,000 anymore,” Newcomb said.
As the year heads closer to spring, triggering the start of the prime homebuying season, agents in Virginia feel optimistic about the market.
“We are seeing seasonal trends like we did up through 2019,” Clarkson said. “The market kind of soft launched around President’s Day and it is still building, but I expect it to pick right back up and be in full swing by Easter like it always used to.”
But while they are confident in demand, questions still remain about whether there will be enough inventory to support even more homebuyers entering the market.
“I have a lot of buyers starting to come off the sidelines, but in my office, I also have a lot of people who are going to list their house in the next two to three weeks now that the weather is starting to break,” Newcomb said. “I think we are going to have a good spring and summer.”
real estate housing market pandemic covid-19 interest ratesUncategorized
These Cities Have The Highest (And Lowest) Share Of Unaffordable Neighborhoods In 2024
These Cities Have The Highest (And Lowest) Share Of Unaffordable Neighborhoods In 2024
Authored by Sam Bourgi via CreditNews.com,
Homeownership…
Share this:


Authored by Sam Bourgi via CreditNews.com,
Homeownership is one of the key pillars of the American dream. But for many families, the idyllic fantasy of a picket fence and backyard barbecues remains just that—a fantasy.
Thanks to elevated mortgage rates, sky-high house prices, and scarce inventory, millions of American families have been locked out of the opportunity to buy a home in many cities.
To shed light on America’s housing affordability crisis, Creditnews Research ranked the 50 most populous cities by the percentage of neighborhoods within reach for the typical married-couple household to buy a home in.
The study reveals a stark reality, with many cities completely out of reach for the most affluent household type. Not only that, the unaffordability has radically worsened in recent years.
Comparing how affordability has changed since Covid, Creditnews Research discovered an alarming pattern—indicating consistently more unaffordable housing in all but three cities.
Fortunately, there’s still hope for households seeking to put down roots in more affordable cities—especially for those looking beyond Los Angeles, New York, Boston, San Jone, and Miami.
The typical American family has a hard time putting down roots in many parts of the country. In 11 of the top 50 cities, at least 50% of neighborhoods are out of reach for the average married-couple household. The affordability gap has widened significantly since Covid; in fact, no major city has reported an improvement in affordability post-pandemic.
Sam Bourgi, Senior Analyst at Creditnews
Key findings
-
The most unaffordable cities are Los Angeles, Boston, St. Louis, and San Jose; in each city, 100% of neighborhoods are out of reach for for married-couple households earning a median income;
-
The most affordable cities are Cleveland, Hartford, and Memphis—in these cities, the typical family can afford all neighborhoods;
-
None of the top 50 cities by population saw an improvement in affordable neighborhoods post-pandemic;
-
California recorded the biggest spike in unaffordable neighborhoods since pre-Covid;
-
The share of unaffordable neighborhoods has increased the most since pre-Covid in San Jose (70 percentage points), San Diego (from 57.8 percentage points), and Riverside-San Bernardino (51.9 percentage points);
-
Only three cities have seen no change in housing affordability since pre-Covid: Cleveland, Memphis, and Hartford. They’re also the only cities that had 0% of unaffordable neighborhoods before Covid.
Cities with the highest share of unaffordable neighborhoods
With few exceptions, the most unaffordable cities for married-couple households tend to be located in some of the nation’s most expensive housing markets.
Four cities in the ranking have an unaffordability percentage of 100%—indicating that the median married-couple household couldn’t qualify for an average home in any neighborhood.
The following are the cities ranked from the least affordable to the most:
-
Los Angeles, CA: Housing affordability in Los Angeles has deteriorated over the last five years, as average incomes have failed to keep pace with rising property values and elevated mortgage rates. The median household income of married-couple families in LA is $117,056, but even at that rate, 100% of the city’s neighborhoods are unaffordable.
-
St. Louis, MO: It may be surprising to see St. Louis ranking among the most unaffordable housing markets for married-couple households. But a closer look reveals that the Mound City was unaffordable even before Covid. In 2019, 98% of the city’s neighborhoods were unaffordable—way worse than Los Angeles, Boston, or San Jose.
-
Boston, MA: Boston’s housing affordability challenges began long before Covid but accelerated after the pandemic. Before Covid, married couples earning a median income were priced out of 90.7% of Boston’s neighborhoods. But that figure has since jumped to 100%, despite a comfortable median household income of $172,223.
-
San Jose, CA: Nestled in Silicon Valley, San Jose has long been one of the most expensive cities for housing in America. But things have gotten far worse since Covid, as 100% of its neighborhoods are now out of reach for the average family. Perhaps the most shocking part is that the median household income for married-couple families is $188,403—much higher than the national average.
-
San Diego, CA: Another California city, San Diego, is among the most unaffordable places in the country. Despite boasting a median married-couple household income of $136,297, 95.6% of the city’s neighborhoods are unaffordable.
-
San Francisco, CA: San Francisco is another California city with a high married-couple median income ($211,585) but low affordability. The percentage of unaffordable neighborhoods for these homebuyers stands at 89.2%.
-
New York, NY: As one of the most expensive cities in America, New York is a difficult housing market for married couples with dual income. New York City’s share of unaffordable neighborhoods is 85.9%, marking a 33.4% rise from pre-Covid times.
-
Miami, FL: Partly due to a population boom post-Covid, Miami is now one of the most unaffordable cities for homebuyers. Roughly four out of five (79.4%) of Miami’s neighborhoods are out of reach price-wise for married-couple families. That’s a 34.7% increase from 2019.
-
Nashville, TN: With Nashville’s population growth rebounding to pre-pandemic levels, the city has also seen greater affordability challenges. In the Music City, 73.7% of neighborhoods are considered unaffordable for married-couple households—an increase of 11.9% from pre-Covid levels.
-
Richmond, VA: Rounding out the bottom 10 is Richmond, where 55.9% of the city’s 161 neighborhoods are unaffordable for married-couple households. That’s an 11.9% increase from pre-Covid levels.
Cities with the lowest share of unaffordable neighborhoods
All the cities in our top-10 ranking have less than 10% unaffordable neighborhoods—meaning the average family can qualify for a home in at least 90% of the city.
Interestingly, these cities are also outside the top 15 cities by population, and eight are in the bottom half.
The following are the cities ranked from the most affordable to the least:
-
Hartford, CT: Hartford ranks first with the percentage of unaffordable neighborhoods at 0%, unchanged since pre-Covid times. Married couples earning a median income of $135,612 can afford to live in any of the city’s 16 neighborhoods. Interestingly, Hartford is the smallest city to rank in the top 10.
-
Memphis, TN: Like Hartford, Memphis has 0% unaffordable neighborhoods, meaning any married couple earning a median income of $101,734 can afford an average homes in any of the city’s 12 neighborhoods. The percentage of unaffordable neighborhoods also stood at 0% before Covid.
-
Cleveland, OH: The Midwestern city of Cleveland is also tied for first, with the percentage of unaffordable neighborhoods at 0%. That means households with a median-couple income of $89,066 can qualify for an average home in all of the city’s neighborhoods. Cleveland is also among the three cities that have seen no change in unaffordability compared to 2019.
-
Minneapolis, MN: The largest city in the top 10, Minneapolis’ share of unaffordable neighborhoods stood at 2.41%, up slightly from 2019. Married couples earning the median income ($149,214) have access to the vast majority of the city’s 83 neighborhoods.
-
Baltimore, MD: Married-couple households in Baltimore earn a median income of $141,634. At that rate, they can afford to live in 97.3% of the city’s 222 neighborhoods, making only 2.7% of neighborhoods unaffordable. That’s up from 0% pre-Covid.
-
Louisville, KY: Louisville is a highly competitive market for married households. For married-couple households earning a median wage, only 3.6% of neighborhoods are unaffordable, up 11.9% from pre-Covid times.
-
Cincinnati, OH: The second Ohio city in the top 10 ranks close to Cleveland in population but has a much higher median married-couple household income of $129,324. Only 3.6% of the city’s neighborhoods are unaffordable, up slightly from pre-pandemic levels.
-
Indianapolis, IN: Another competitive Midwestern market, only 4.4% of Indianapolis is unaffordable, making the vast majority of the city’s 92 neighborhoods accessible to the average married couple. Still, the percentage of unaffordable neighborhoods before Covid was less than 1%.
-
Oklahoma City, OK: Before Covid, Oklahoma City had 0% neighborhoods unaffordable for married-couple households earning the median wage. It has since increased to 4.69%, which is still tiny compared to the national average.
-
Kansas City, MO: Kansas City has one of the largest numbers of neighborhoods in the top 50 cities. Its married-couple residents can afford to live in nearly 95% of them, making only 5.6% of neighborhoods out of reach. Like Indiana, Kansas City’s share of unaffordable neighborhoods was less than 1% before Covid.
The biggest COVID losers
What's particularly astonishing about the current housing market is just how quickly affordability has declined since Covid.
Even factoring in the market correction after the 2022 peak, the price of existing homes is still nearly one-third higher than before Covid. Mortgage rates have also more than doubled since early 2022.
Combined, the rising home prices and interest rates led to the worst mortgage affordability in more than 40 years.
Against this backdrop, it’s hardly surprising that unaffordability increased in 47 of the 50 cities studied and remained flat in the other three. No city reported improved affordability in 2024 compared to 2019.
The biggest increases are led by San Jose (70 percentage points), San Diego (57.8 percentage points), Riverside-San Bernardino (51.9 percentage points), Sacramento (43 percentage points), Orlando (37.4 percentage points), Miami (34.7 percentage points), and New York City (33.4 percentage points).
The following cities in our study are ranked by the largest percentage point change in unaffordable neighborhoods since pre-Covid:
Uncategorized
Your financial plan may be riskier without bitcoin
It might actually be riskier to not have bitcoin in your portfolio than it is to have a small allocation.
Share this:


This article originally appeared in the Sound Advisory blog. Sound Advisory provide financial advisory services and are specialize in educating and guiding clients to thrive financially in a bitcoin-powered world. Click here to learn more.
“Belief is a wise wager. Granted that faith cannot be proved, what harm will come to you if you gamble on its truth and it proves false? If you gain, you gain all; if you lose, you lose nothing. Wager, then, without hesitation, that He exists.”
- Blaise Pascal
Blaise Pascal only lived to age 39 but became world-famous for many contributions in the fields of mathematics, physics, and theology. The above quote encapsulates Pascal’s wager—a philosophical argument for the Christian belief in the existence of God.
The argument's conclusion states that a rational person should live as though God exists. Even if the probability is low, the reward is worth the risk.
Pascal’s wager as a justification for bitcoin? Yes, I’m aware of the fallacies: false dichotomy, appeal to emotion, begging the question, etc. That is not the point. The point is that binary outcomes instigate extreme results, and the game theory of money suggests that it’s a winner-take-all game.
The Pascalian investor: A rational approach to bitcoin
Humanity’s adoption of “the best money over time” mimics a series of binary outcomes—A/B tests.
Throughout history, inferior forms of money have faded as better alternatives emerged (see India’s failed transition to a gold standard). And if bitcoin is trying to be the premier money of the future, it will either succeed or it won’t.
“If you ain’t first, you’re last.” -Ricky Bobby, Talladega Nights, on which monies succeed over time.
So, we can look at bitcoin success similarly to Pascal’s wager—let’s call it Satoshi’s wager. The translated points would go something like this:
- If you own bitcoin early and it becomes a globally valuable money, you gain immensely. ????
- If you own bitcoin and it fails, you’ve lost that value. ????
- If you don’t own bitcoin and it goes to zero, no pain and no gain. ????
- If you don’t own bitcoin and it succeeds, you will have missed out on the significant financial revolution of our lifetimes and fall comparatively behind. ????
If bitcoin is successful, it will be worth far more than it is today and have a massive impact on your financial future. If it fails, the losses are only limited to your exposure. The most that you could lose is the money that you invested.
It is hypothetically possible that bitcoin could be worth 100x more than it is today, but it can only possibly lose 1x its value as it goes to zero. The concept we’re discussing here is asymmetric upside - significant gains with relatively limited downside. In other words, the potential rewards of the investment outweigh the potential risks.
Bitcoin offers an asymmetric upside that makes it a wise investment for most portfolios. Even a small allocation provides potential protection against extreme currency debasement.
Salt, gasoline, and insurance

“Don’t over salt your steak, pour too much gas on the fire, or buy too much insurance.”
A little bit goes a long way, and you can easily overdo it. The same applies when looking at bitcoin in the context of a financial plan.
Bitcoin’s asymmetric upside gives it “insurance-like” qualities, and that insurance pays off very well in times of money printing. This was exemplified in 2020 when bitcoin's value increased over 300% in response to pandemic money printing, far outpacing stocks, gold, and bonds.
Bitcoin offers a similar asymmetric upside today. Bitcoin's supply is capped at 21 million coins, making it resistant to inflationary debasement. In contrast, the dollar's purchasing power consistently declines through unrestrained money printing. History has shown that societies prefer money that is hard to inflate.
If recent rampant inflation is uncontainable and the dollar system falters, bitcoin is well-positioned as a successor. This global monetary A/B test is still early, but given their respective sizes, a little bitcoin can go a long way. If it succeeds, early adopters will benefit enormously compared to latecomers. Of course, there are no guarantees, but the potential reward justifies reasonable exposure despite the risks.
Let’s imagine Nervous Nancy, an extremely conservative investor. She wants to invest but also take the least risk possible. She invests 100% of her money in short-term cash equivalents (short-term treasuries, money markets, CDs, maybe some cash in the coffee can). With this investment allocation, she’s nearly certain to get her initial investment back and receive a modest amount of interest as a gain. However, she has no guarantees that the investment returned to her will purchase the same amount as it used to. Inflation and money printing cause each dollar to be able to purchase less and less over time. Depending on the severity of the inflation, it might not buy anything at all. In other words, she didn’t lose any dollars, but the dollar lost purchasing power.
Now, let’s salt her portfolio with bitcoin.
99% short-term treasuries. 1% bitcoin.
With a 1% allocation, if bitcoin goes to zero overnight, she’ll have only lost a penny on the dollar, and her treasury interest will quickly fill the gap. Not at all catastrophic to her financial future.
However, if the hypothetical hyperinflationary scenario from above plays out and bitcoin grows 100x in purchasing power, she’s saved everything. Metaphorically, her entire dollar house burned down, and “bitcoin insurance” made her whole. Powerful. A little bitcoin salt goes a long way.
(When protecting against the existing system, it’s important to remember that you need to get your bitcoin out of the system. Keeping bitcoin on an exchange or with a counterparty will do you no good if that entity fails. If you view bitcoin as insurance, it’s essential to keep your bitcoin in cold storage and hold your keys. Otherwise, it’s someone else’s insurance.)
When all you have a hammer, everything looks like a…

A construction joke:
There are only three rules to construction: 1.) Always use the right tool for the job! 2.) A hammer is always the right tool! 3.) Anything can be a hammer!
Yeah. That’s what I thought, too. Slightly funny and mostly useless.
But if you spend enough time swinging a hammer, you’ll eventually realize it can be more than it first appears. Not everything is a nail. A hammer can tear down walls, break concrete, tap objects into place, and wiggle other things out. A hammer can create and destroy; it builds tall towers and humbles novice fingers. The use cases expand with the skill of the carpenter.
Like hammers, bitcoin is a monetary tool. And a 1-5% allocator to the asset typically sees a “speculative insurance” use case - valid. Bitcoin is speculative insurance, but it is not only speculative insurance. People invest and save in bitcoin for many different reasons.
I’ve seen people use bitcoin to pursue all of the following use cases:
- Hedging against a financial collapse (speculative insurance)
- Saving for family and future (long-term general savings and safety net)
- Growing a downpayment for a house (medium-term specific savings)
- Shooting for the moon in a manner equivalent to winning the lottery (gambling)
- Opting out of government-run, bank-controlled financial systems (financial optionality)
- Making a quick buck (short-term trading)
- Escaping a hostile country (wealth evacuation)
- Locking away wealth that can’t be confiscated (wealth preservation)
- As a means to influence opinions and gain followers (social status)
- Fix the money and fix the world (mission and purpose)
Keep this in mind when taking other people’s financial advice. They are often playing a different game than you. They have different goals, upbringings, worldviews, family dynamics, and circumstances. Even though they might use the same hammer as you, it could be for a completely different job.
Wrapping Up
A massive allocation to bitcoin may seem crazy to some people, yet perfectly reasonable to others. The same goes for having a 1% allocation.
But, given today’s macroeconomic environment and bitcoin’s trajectory, I find very few use cases where 0% bitcoin makes sense. By not owning bitcoin, you implicitly say that you are 100% certain it will fail and go to zero. Given its 14-year history so far, I’d recommend reducing your confidence. Nobody is 100% right forever. A little salt goes a long way. Your financial plan may be riskier without bitcoin. Diversify accordingly.
“We must learn our limits. We are all something, but none of us are everything.” - Blaise Pascal.
bonds pandemic stocks bitcoin link goldContact
Office: (208)-254-0142
Ste. 205
Eagle, ID 83616
Check the background of your financial professional on FINRA's BrokerCheck.The content is developed from sources believed to be providing accurate information. The information in this material is not intended as tax or legal advice. Please consult legal or tax professionals for specific information regarding your individual situation. Some of this material was developed and produced by FMG Suite to provide information on a topic that may be of interest. FMG Suite is not affiliated with the named representative, broker - dealer, state - or SEC - registered investment advisory firm. The opinions expressed and material provided are for general information, and should not be considered a solicitation for the purchase or sale of any security.
We take protecting your data and privacy very seriously. As of January 1, 2020 the California Consumer Privacy Act (CCPA) suggests the following link as an extra measure to safeguard your data: Do not sell my personal information.
Copyright 2024 FMG Suite.
Sound Advisory, LLC (“SA”) is a registered investment advisor offering advisory services in the State of Idaho and in other jurisdictions where exempt. Registration does not imply a certain level of skill or training. The information on this site is not intended as tax, accounting, or legal advice, as an offer or solicitation of an offer to buy or sell, or as an endorsement of any company, security, fund, or other securities or non-securities offering. This information should not be relied upon as the sole factor in an investment-making decision. Past performance is no indication of future results. Investment in securities involves significant risk and has the potential for partial or complete loss of funds invested. It should not be assumed that any recommendations made will be profitable or equal any performance noted on this site.
The information on this site is provided “AS IS” and without warranties of any kind, either express or implied. To the fullest extent permissible pursuant to applicable laws, Sound Advisory LLC disclaims all warranties, express or implied, including, but not limited to, implied warranties of merchantability, non-infringement, and suitability for a particular purpose.
SA does not warrant that the information on this site will be free from error. Your use of the information is at your sole risk. Under no circumstances shall SA be liable for any direct, indirect, special or consequential damages that result from the use of, or the inability to use, the information provided on this site, even if SA or an SA authorized representative has been advised of the possibility of such damages. Information contained on this site should not be considered a solicitation to buy, an offer to sell, or a recommendation of any security in any jurisdiction where such offer, solicitation, or recommendation would be unlawful or unauthorized.


Q4 Update: Delinquencies, Foreclosures and REO


Pharma industry reputation remains steady at a ‘new normal’ after Covid, Harris Poll finds


These Cities Have The Highest (And Lowest) Share Of Unaffordable Neighborhoods In 2024


The Question You Should Ask Whenever You’re Wrong


Part 1: Current State of the Housing Market; Overview for mid-March 2024


Tight inventory and frustrated buyers challenge agents in Virginia


Walmart and Target make key self-checkout changes to fight theft


Your financial plan may be riskier without bitcoin


The best real estate coaching programs for 2024


Futures Rise To New Record High Ahead Of Data Deluge
-

 Uncategorized3 weeks ago
All Of The Elements Are In Place For An Economic Crisis Of Staggering Proportions
-

 International7 days ago
EyePoint poaches medical chief from Apellis; Sandoz CFO, longtime BioNTech exec to retire
-

 Uncategorized4 weeks ago
California Counties Could Be Forced To Pay $300 Million To Cover COVID-Era Program
-

 Uncategorized3 weeks ago
Apparel Retailer Express Moving Toward Bankruptcy
-

 Uncategorized4 weeks ago
Industrial Production Decreased 0.1% in January
-

 International6 days ago
Walmart launches clever answer to Target’s new membership program
-

 Uncategorized4 weeks ago
RFK Jr: The Wuhan Cover-Up & The Rise Of The Biowarfare-Industrial Complex
-

 Uncategorized3 weeks ago
GOP Efforts To Shore Up Election Security In Swing States Face Challenges