International
Weekly Market Pulse: The More Things Change…
I stopped in a local antique shop over the weekend. The owner is retiring and trying to clear out as much as she can before they close the doors so I paid…
Share this:


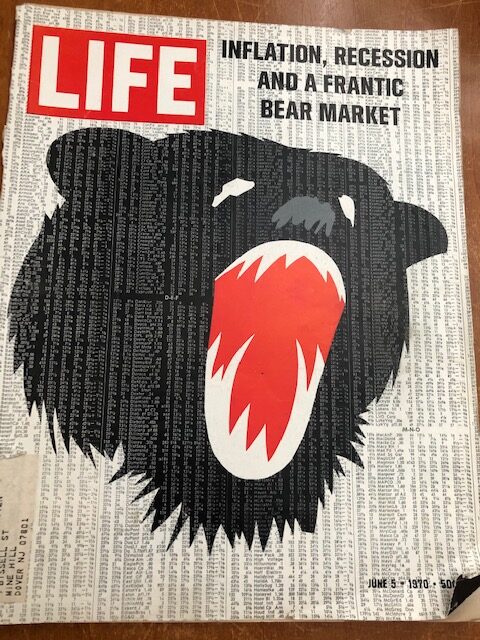
I stopped in a local antique shop over the weekend. The owner is retiring and trying to clear out as much as she can before they close the doors so I paid a mere $3 for the Life magazine above. I think it might be worth many multiples of that price for investors who think our situation today is somehow uniquely bad. The cover headline could just as easily be describing today as 1970.
The year 1970 was a tough one for America. Inflation averaged around 6% that year, although it had already peaked by the time of this Life issue. The stock market had peaked in December of 1968 and was already down 15% by the start of 1970. It would go on to lose a total of 34.9% by the time it made its low on May 26th, just before this issue was published.
We had political turmoil at home with 4 college kids killed at Kent State and we also heard the verdict for the Chicago 7 in February, where Jerry Rubin, Tom Hayden and Abby Hoffman were all acquitted of conspiracy but convicted of inciting a riot (all of which were overturned on appeal). Back in ’67 Hoffman had led the so called Yippies on Wall Street protest, throwing dollar bills from the balcony of the NYSE to protest capitalist greed. Occupy Wall Street wasn’t new.
We had geo-political intrigue abroad as Nixon widened the Vietnam war to Cambodia. And we had financial problems as well with the bankruptcy of Penn Central in the same month as this Life cover. Penn Central was the 6th largest company in the country and its bankruptcy was the biggest in American history to that time.
Unemployment rose throughout the year, starting at 3.5% and ending at 6.1%. Jobless claims rose from 202k in December of 1969 to 374k in April of ’70. The Fed funds rate peaked at 9.5% in late ’69 and the Fed was cutting rates for the entire year, proving once again that the Fed has no ability to stop a bear market with rate cuts. GDP growth was positive for the year but that hardly tells the story. GDP fell at a nearly 2% annualized rate in Q4 ’69, fell further in Q1 (-0.6%), rose in Q2 (+0.6%) and rebounded big in Q3 (+3.7%). Q4 was a disaster at -4.3%.
Short term Treasury rates peaked early in the year with the 1 year Treasury yield topping at 8.4% right at the end of ’69. Long term rates were more stubborn with the 10 year topping out the same day the stock market bottomed on May 26th. The peak 10 year rate that year was 8.2%. The yield curve (10 year/Fed Funds) inverted in August of the previous year at a max inversion of -3.9%. Yes, you read that right. Modern pundits fretting about an inversion of 40 basis points have no sense of history.
The S&P 500 bottomed that year on May 26th at 71.17 and rose by 30% through year end to 92.79 despite that awful Q4 GDP reading. Most of those gains came between August and year end. It would rally further to a peak in early 1973 at 121.74, a move of over 71% from trough to peak.
What do we learn from this history lesson? Well, most obvious is that our current situation isn’t unique at all. Markets have dealt with high inflation and an aggressive Fed before. It also highlights how hard it is sometimes to figure out where the economy is in real time. The 1969/70 recession wasn’t called a recession by the NBER until early 1971, after the recession had already ended. There was a lot of discussion at the time about whether it even was a recession. Sound familiar?
Another lesson is that stocks, like all markets, anticipate. The market bottomed in May when interest rates peaked even with the most negative quarter of the recession still ahead. And stocks don’t have to get “cheap” before finding a bottom. The S&P traded around 17 times earnings that year, down from around 22 before the bear market started.
We think today of meme stocks as something unique but the 60s were called the go-go 60s for a reason. The Nifty Fifty, the glamour stocks, the concept stocks, the conglomerates and the “gunslinger” fund managers who touted them were rock stars. George Tsai was the Cathie Wood of the day. When the Nifty Fifty finally expired in the early 70s, they had P/Es that rival anything seen today with Xerox at 49 times, Avon at 65 and Polaroid at 90.
2022 will not be a replica of 1970 because there are differences between the two periods, mainly that the conditions back then were, if anything, worse than today. But there are some things that don’t change. It isn’t coincidence that the rally off the June lows this year started when interest rates peaked just as it did in 1970. Interest rates are important for their role in how we value stocks but why they move up and down is less important than the fact that they do.
There is truly nothing new under the sun or in markets. There are no new eras if you know history. Markets have been here before even if today’s participants haven’t. And that is always true too; there were traders in 1970 who had never been through a bad bear market. The last bear market in 1966 only lasted 8 months and stocks fell just 22%, barely even qualifying for the bear label. The last bear market with a drawdown more than 30% had been way back in 1942.
This bear market, like all others before it, will come to an end. It may be soon or it may have more to run but markets and investors have survived much worse conditions than what we face today.
Economy
The economic data released last week continued to show a modest improvement in the economy since July. The Dallas Fed Manufacturing survey improved in August although it was still slightly negative. Home price appreciation moderated, the Case-Shiller index up 0.4% from May and 18.6% yoy. I can’t imagine that the rate of change hasn’t continued to moderate since then.
JOLTS was much better than expected with job openings steady above 11 million although the quits rate was down a little. Conference Board consumer confidence improved much more than expected to 103.2 from 95.3 in July. Present situation and expectations readings were also up strongly. Purchasing intentions increased while vacation intentions reached an 8 month high.
Jobless claims fell for the 3rd week in a row. The peak in July was 261 and we’re back down to 232 now.
The ISM manufacturing survey improved in just about every way possible (see my comments here).
The employment report was about as expected with a solid rise in employment, a rise in the participation rate, an increase in the labor force which pushed up the unemployment rate slightly and average hourly earnings that grew less than expected.
The only real negative report for the week was Factory orders which fell 1% but that was a July reading. We’ll see in the next report whether it improved like most everything else in August.
Overall, the economy does not appear to be in recession or on the verge of it.
Environment
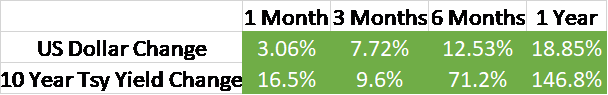
I’ve said it repeatedly, but one more time. The trend on rates and the dollar are both up and that has been true now for months. The dollar made its final low in the summer of last year and while there have been some pullbacks along the way, the trend is up and obvious.
The 10 year Treasury yield has been rising since the summer of 2020 although there was a pullback in rates that lasted from April to August of last year. Rates moved up strongly at the beginning of this year but have been stalled since early May. Are we near a top in rates? Maybe. Upside momentum actually peaked with the May peak in rates; the rise into the June high was not confirmed by momentum readings.

In our tactical framework we classify the environment based on economic growth and the dollar. In these weekly commentaries I generally refer to interest rates and the dollar. I do that because it takes the emotion out of classifying the economy as growth rising or growth falling. The nominal 10 year Treasury note yield is highly correlated with nominal growth and so when it is rising it means nominal growth expectations are improving, i.e. growth rising.
Of course, nominal growth isn’t the whole story. To get to real growth expectations we also have to look at real rates and inflation expectations. Today, real rates are also rising and because they are rising faster than nominal rates, inflation expectations are falling. Combined with the rise in nominal rates, it is hard to see how that could be classified as anything but a rising growth environment. But that isn’t the only way we can look at growth expectations, the yield curve provides information too. Unfortunately, that reading points to falling growth although the curve has been steepening some – in a good way – lately.
I get asked all the time, “what quadrant are we in” and my answer is that it is rarely clear cut and today is no exception. In a rising growth, rising dollar environment the investments that tend to work well, such as growth stocks, are not. If you insist we are in a falling growth, rising dollar environment, some of the investments that tend to do well in that environment, such as long term bonds, also aren’t doing so great.
The investing matrix we use is based on history but it only identifies tendencies. The fact that none of the quadrants exactly matches current markets should not be surprising since we are in a unique and rare situation – recovering from a pandemic. We do expect that when the COVID distortions are finally over, whenever that is, we will see historical tendencies return. In the interim, we think investors need to remain very flexible and open-minded.
Markets
It was another week of nowhere to hide. It looked like stocks might end the week on a positive note but the news late Friday that Russia would not re-open the natural gas pipeline to Europe killed the rally. Or at least that’s what all the news said; I don’t personally know why sellers suddenly emerged Friday afternoon.
Oil moved back near its recent lows but the selloff in commodities was broad with copper actually leading the way, down over 7%. And no, I don’t put any stock in that Dr. Copper nonsense. The drop in commodities is about rising real rates not any signal about future growth. If you doubt that, go back and take a look at the late 90s. Copper peaked in early 1995 at around $1.40 and fell all the way to $0.61 in 1999. Maybe Dr. Copper was still working on his degree back then.
Value outperformed last week and is well ahead on a YTD and YOY basis as well.

Best performing sectors last week were defensive with utilities and healthcare leading the way.

History may not repeat but markets are made up of people and they do. Investors do the same things over and over, only the details differ. The magazine cover indicator has worked for a long time but it works best with general interest publications like Life and Newsweek (this is from the same week as the Life cover):

That is true because if a market or economic event ends up on the cover of a general interest magazine, it is already widely known and factored into current prices. We don’t have many magazines like that anymore (or many magazines for that matter) so the indicator is harder to use these days. There are other ways to discern market sentiment though and right now it is overwhelmingly negative, about the economy, about the stock market, about politics and about the global geo-political situation. Maybe things will get worse from here but if they do it would it really surprise anyone? More importantly, would it surprise markets?
Know history and know yourself.
Joe Calhoun
recession unemployment bankruptcy pandemic economic growth bonds yield curve sp 500 stocks fed treasury rates recession gdp interest rates unemployment commodities oil europe russiaGovernment
Gen Z, The Most Pessimistic Generation In History, May Decide The Election
Gen Z, The Most Pessimistic Generation In History, May Decide The Election
Authored by Mike Shedlock via MishTalk.com,
Young adults are more…
Share this:

Authored by Mike Shedlock via MishTalk.com,
Young adults are more skeptical of government and pessimistic about the future than any living generation before them.
This is with reason, and it’s likely to decide the election.
Rough Years and the Most Pessimism Ever
The Wall Street Journal has an interesting article on The Rough Years That Turned Gen Z Into America’s Most Disillusioned Voters.
Young adults in Generation Z—those born in 1997 or after—have emerged from the pandemic feeling more disillusioned than any living generation before them, according to long-running surveys and interviews with dozens of young people around the country. They worry they’ll never make enough money to attain the security previous generations have achieved, citing their delayed launch into adulthood, an impenetrable housing market and loads of student debt.
And they’re fed up with policymakers from both parties.
Washington is moving closer to passing legislation that would ban or force the sale of TikTok, a platform beloved by millions of young people in the U.S. Several young people interviewed by The Wall Street Journal said they spend hours each day on the app and use it as their main source of news.
“It’s funny how they quickly pass this bill about this TikTok situation. What about schools that are getting shot up? We’re not going to pass a bill about that?” Gaddie asked. “No, we’re going to worry about TikTok and that just shows you where their head is…. I feel like they don’t really care about what’s going on with humanity.”
Gen Z’s widespread gloominess is manifesting in unparalleled skepticism of Washington and a feeling of despair that leaders of either party can help. Young Americans’ entire political memories are subsumed by intense partisanship and warnings about the looming end of everything from U.S. democracy to the planet. When the darkest days of the pandemic started to end, inflation reached 40-year highs. The right to an abortion was overturned. Wars in Ukraine and the Middle East raged.
Dissatisfaction is pushing some young voters to third-party candidates in this year’s presidential race and causing others to consider staying home on Election Day or leaving the top of the ticket blank. While young people typically vote at lower rates, a small number of Gen Z voters could make the difference in the election, which four years ago was decided by tens of thousands of votes in several swing states.
Roughly 41 million Gen Z Americans—ages 18 to 27—will be eligible to vote this year, according to Tufts University.
Gen Z is among the most liberal segments of the electorate, according to surveys, but recent polling shows them favoring Biden by only a slim margin. Some are unmoved by those who warn that a vote against Biden is effectively a vote for Trump, arguing that isn’t enough to earn their support.
Confidence
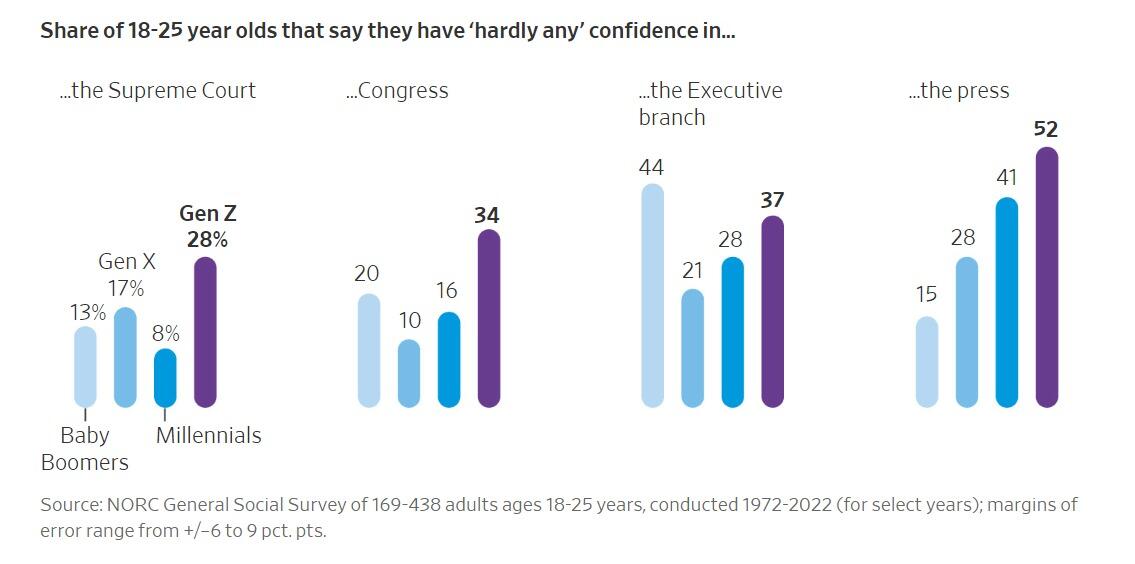
When asked if they had confidence in a range of public institutions, Gen Z’s faith in them was generally below that of the older cohorts at the same point in their lives.
One-third of Gen Z Americans described themselves as conservative, according to NORC’s 2022 General Social Survey. That is a larger share identifying as conservative than when millennials, Gen X and baby boomers took the survey when they were the same age, though some of the differences were small and within the survey’s margin of error.
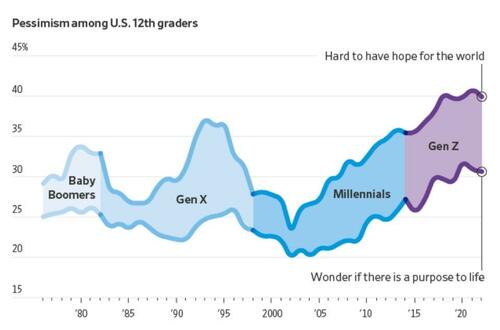
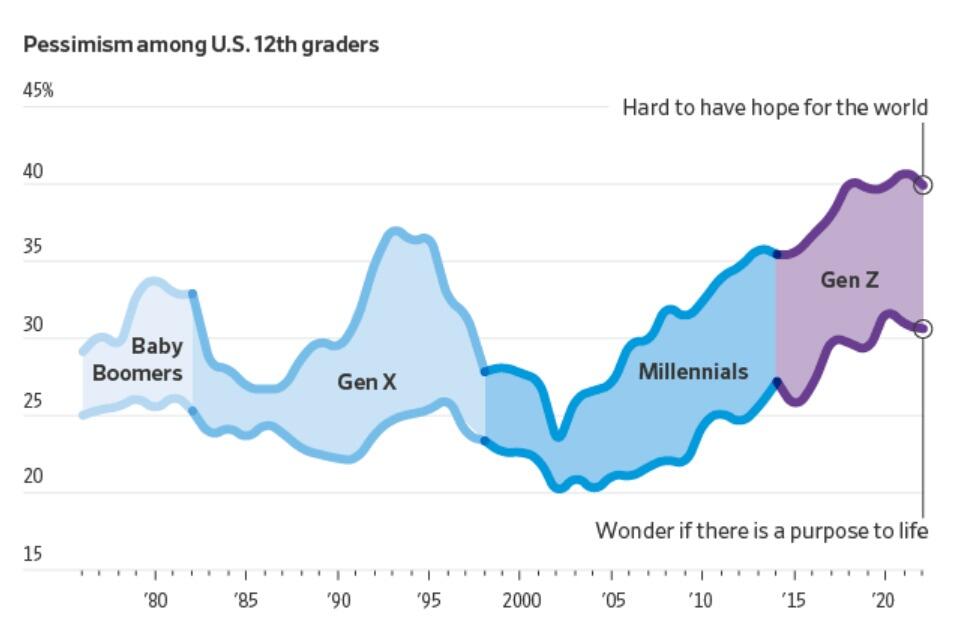
More young people now say they find it hard to have hope for the world than at any time since at least 1976, according to a University of Michigan survey that has tracked public sentiment among 12th-graders for nearly five decades. Young people today are less optimistic than any generation in decades that they’ll get a professional job or surpass the success of their parents, the long-running survey has found. They increasingly believe the system is stacked against them and support major changes to the way the country operates.
Gen Z future Outcome
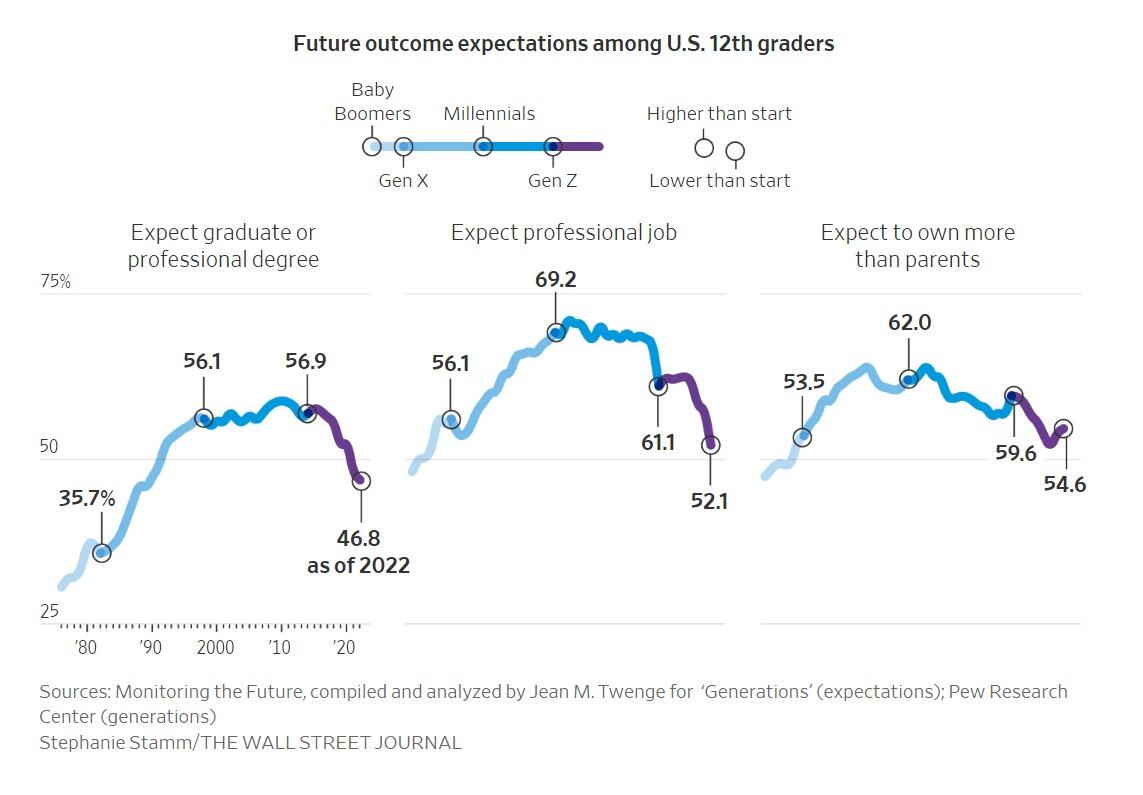
“It’s the starkest difference I’ve documented in 20 years of doing this research,” said Twenge, the author of the book “Generations.” The pandemic, she said, amplified trends among Gen Z that have existed for years: chronic isolation, a lack of social interaction and a propensity to spend large amounts of time online.
A 2020 study found past epidemics have left a lasting impression on young people around the world, creating a lack of confidence in political institutions and their leaders. The study, which analyzed decades of Gallup World polling from dozens of countries, found the decline in trust among young people typically persists for two decades.
Young people are more likely than older voters to have a pessimistic view of the economy and disapprove of Biden’s handling of inflation, according to the recent Journal poll. Among people under 30, Biden leads Trump by 3 percentage points, 35% to 32%, with 14% undecided and the remaining shares going to third-party candidates, including 10% to independent Robert F. Kennedy Jr.
Economic Reality
Gen Z may be the first generation in US history that is not better off than their parents.
Many have given up on the idea they will ever be able to afford a home.
The economy is allegedly booming (I disagree). Regardless, stress over debt is high with younger millennials and zoomers.
This has been a constant theme of mine for many months.
Credit Card and Auto Delinquencies Soar
Credit card debt surged to a record high in the fourth quarter. Even more troubling is a steep climb in 90 day or longer delinquencies.
![]()
Record High Credit Card Debt
Credit card debt rose to a new record high of $1.13 trillion, up $50 billion in the quarter. Even more troubling is the surge in serious delinquencies, defined as 90 days or more past due.
For nearly all age groups, serious delinquencies are the highest since 2011.
Auto Loan Delinquencies
![]()
Serious delinquencies on auto loans have jumped from under 3 percent in mid-2021 to to 5 percent at the end of 2023 for age group 18-29.Age group 30-39 is also troubling. Serious delinquencies for age groups 18-29 and 30-39 are at the highest levels since 2010.
For further discussion please see Credit Card and Auto Delinquencies Soar, Especially Age Group 18 to 39
Generational Homeownership Rates
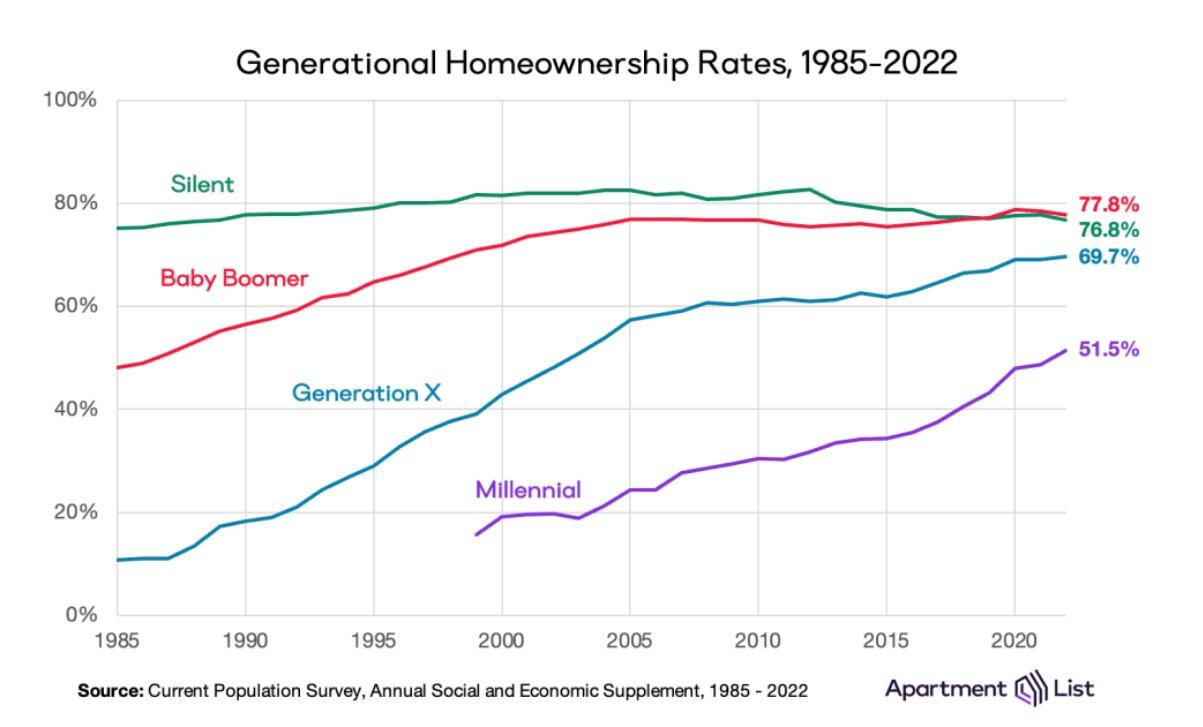
Home ownership rates courtesy of Apartment List
The above chart is from the Apartment List’s 2023 Millennial Homeownership Report
Those struggling with rent are more likely to be Millennials and Zoomers than Generation X, Baby Boomers, or members of the Silent Generation.
The same age groups struggling with credit card and auto delinquencies.
On Average Everything is Great
Average it up, and things look pretty good. This is why we have seen countless stories attempting to explain why people should be happy.
Krugman Blames Partisanship
With the recent rise in consumer sentiment, time to revisit this excellent Briefing Book paper. On reflection, I'd do it a bit differently; same basic conclusion, but I think partisan asymmetry explains even more of the remaining low numbers 1/ https://t.co/4lqm7X4472
— Paul Krugman (@paulkrugman) February 17, 2024
OK, there is a fair amount of partisanship in the polls.
However, Biden isn’t struggling from partisanship alone. If that was the reason, Biden would not be polling so miserably with Democrats in general, blacks, and younger voters.
OK, there is a fair amount of partisanship in the polls.
However, Biden isn’t struggling from partisanship alone. If that was the reason, Biden would not be polling so miserably with Democrats in general, blacks, and younger voters.
This allegedly booming economy left behind the renters and everyone under the age of 40 struggling to make ends meet.
Many Are Addicted to “Buy Now, Pay Later” Plans
Buy Now Pay Later, BNPL, plans are increasingly popular. It’s another sign of consumer credit stress.
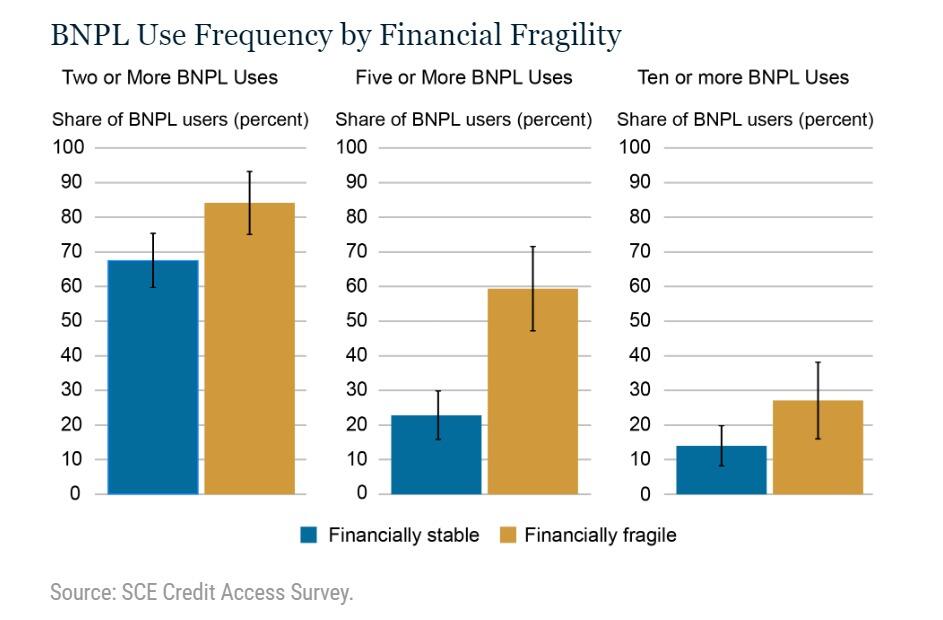
For discussion, please see Many Are Addicted to “Buy Now, Pay Later” Plans, It’s a Big Trap
The study did not break things down by home owners vs renters, but I strongly suspect most of the BNPL use is by renters.
What About Jobs?
Another seemingly strong jobs headline falls apart on closer scrutiny. The massive divergence between jobs and employment continued into February.
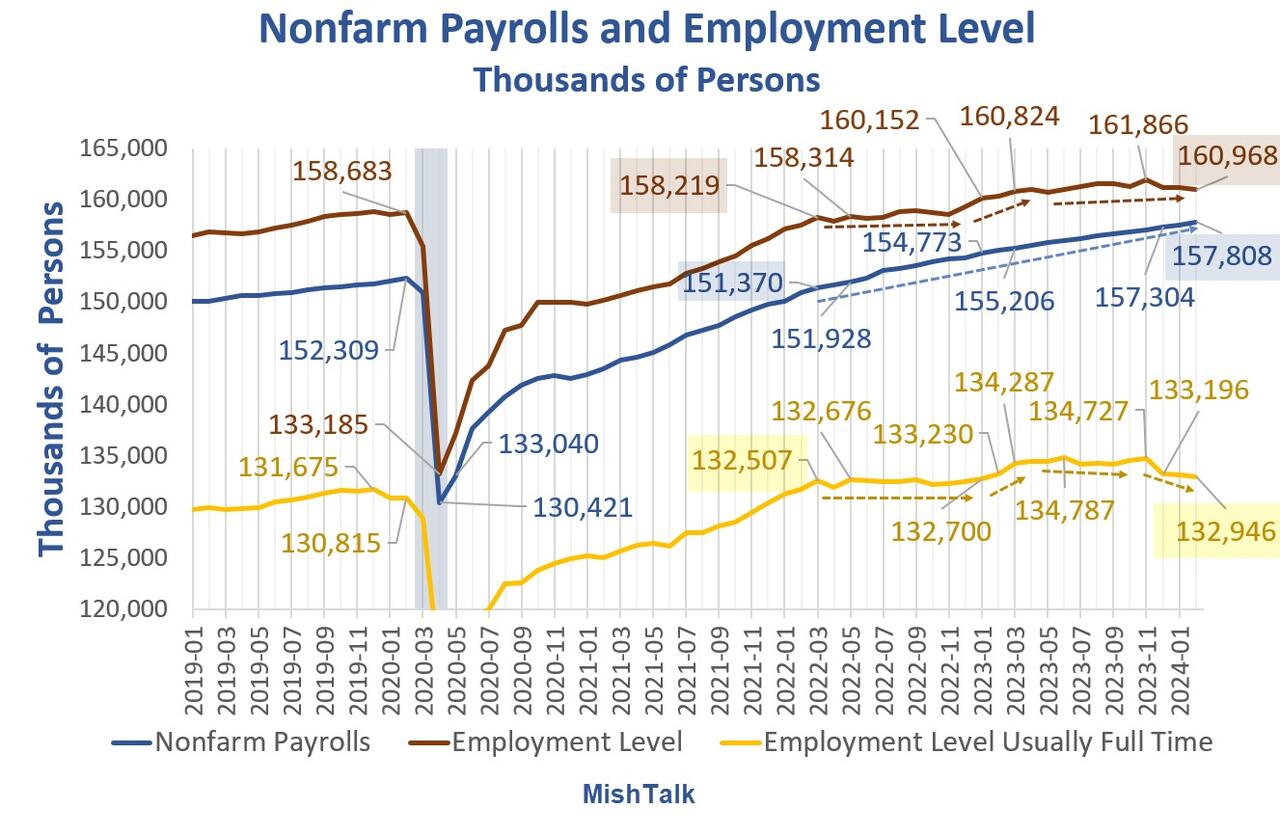
Nonfarm payrolls and employment levels from the BLS, chart by Mish.
Payrolls vs Employment Gains Since March 2023
-
Nonfarm Payrolls: 2,602,000
-
Employment Level: +144,000
-
Full Time Employment: -284,000
For more details of the weakening labor markets, please see Jobs Up 275,000 Employment Down 184,000
CPI Hot Again
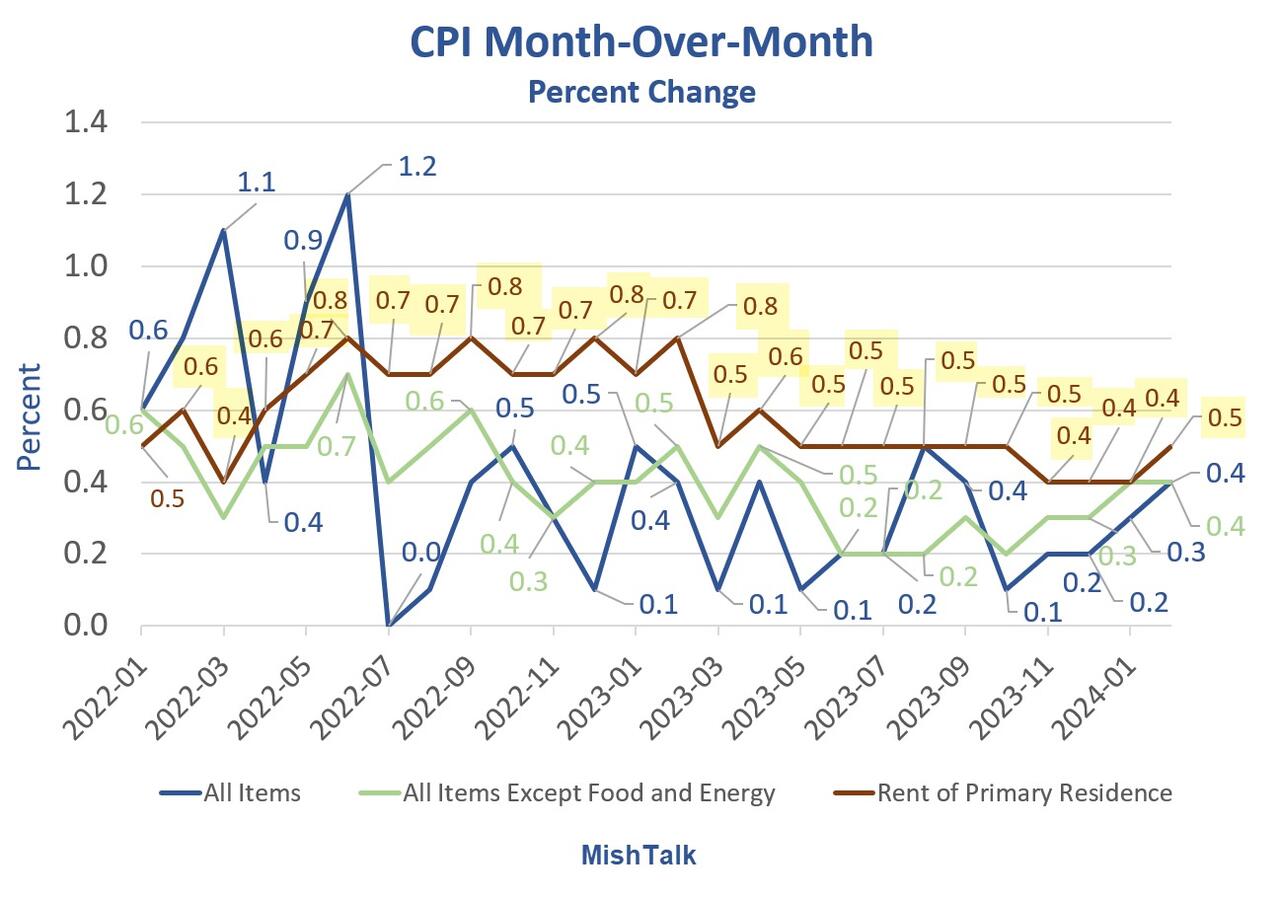
CPI Data from the BLS, chart by Mish.
For discussion of the CPI inflation data for February, please see CPI Hot Again, Rent Up at Least 0.4 Percent for 30 Straight Months
Also note the Producer Price Index (PPI) Much Hotter Than Expected in February
Major Economic Cracks
There are economic cracks in spending, cracks in employment, and cracks in delinquencies.
But there are no cracks in the CPI. It’s coming down much slower than expected. And the PPI appears to have bottomed.
Add it up: Inflation + Recession = Stagflation.
Election Impact
In 2020, younger voters turned out in the biggest wave in history. And they voted for Biden.
Younger voters are not as likely to vote in 2024, and they are less likely to vote for Biden.
Millions of voters will not vote for either Trump or Biden. Net, this will impact Biden more. The base will not decide the election, but the Trump base is far more energized than the Biden base.
If Biden signs a TikTok ban, that alone could tip the election.
If No Labels ever gets its act together, I suspect it will siphon more votes from Biden than Trump. But many will just sit it out.
“We’re just kind of over it,” Noemi Peña, 20, a Tucson, Ariz., resident who works in a juice bar, said of her generation’s attitude toward politics. “We don’t even want to hear about it anymore.” Peña said she might not vote because she thinks it won’t change anything and “there’s just gonna be more fighting.” Biden won Arizona in 2020 by just over 10,000 votes.
The Journal noted nearly one-third of voters under 30 have an unfavorable view of both Biden and Trump, a higher number than all older voters. Sixty-three percent of young voters think neither party adequately represents them.
Young voters in 2020 were energized to vote against Trump. Now they have thrown in the towel.
And Biden telling everyone how great the economy is only rubs salt in the wound.
International
Copper Soars, Iron Ore Tumbles As Goldman Says “Copper’s Time Is Now”
Copper Soars, Iron Ore Tumbles As Goldman Says "Copper’s Time Is Now"
After languishing for the past two years in a tight range despite recurring…
Share this:

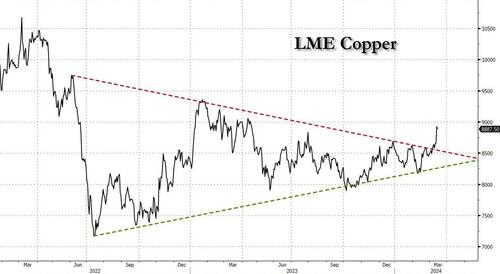
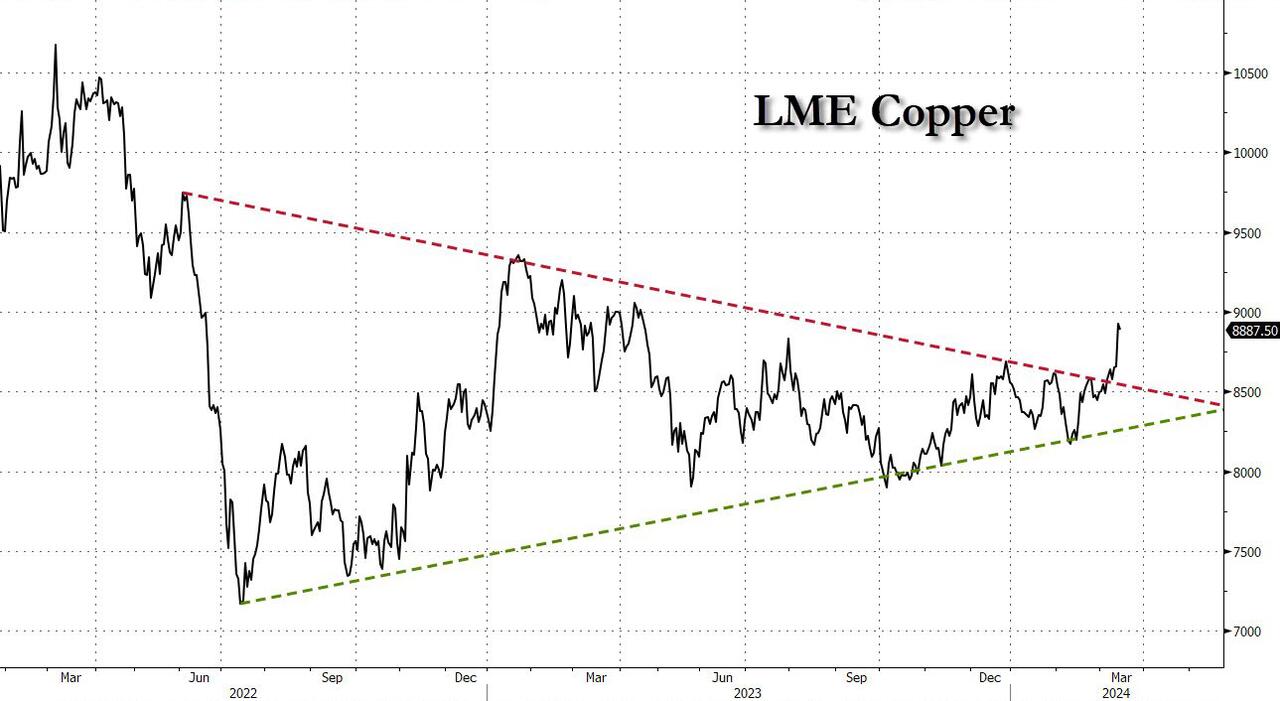
After languishing for the past two years in a tight range despite recurring speculation about declining global supply, copper has finally broken out, surging to the highest price in the past year, just shy of $9,000 a ton as supply cuts hit the market; At the same time the price of the world's "other" most important mined commodity has diverged, as iron ore has tumbled amid growing demand headwinds out of China's comatose housing sector where not even ghost cities are being built any more.
Copper surged almost 5% this week, ending a months-long spell of inertia, as investors focused on risks to supply at various global mines and smelters. As Bloomberg adds, traders also warmed to the idea that the worst of a global downturn is in the past, particularly for metals like copper that are increasingly used in electric vehicles and renewables.
Yet the commodity crash of recent years is hardly over, as signs of the headwinds in traditional industrial sectors are still all too obvious in the iron ore market, where futures fell below $100 a ton for the first time in seven months on Friday as investors bet that China’s years-long property crisis will run through 2024, keeping a lid on demand.
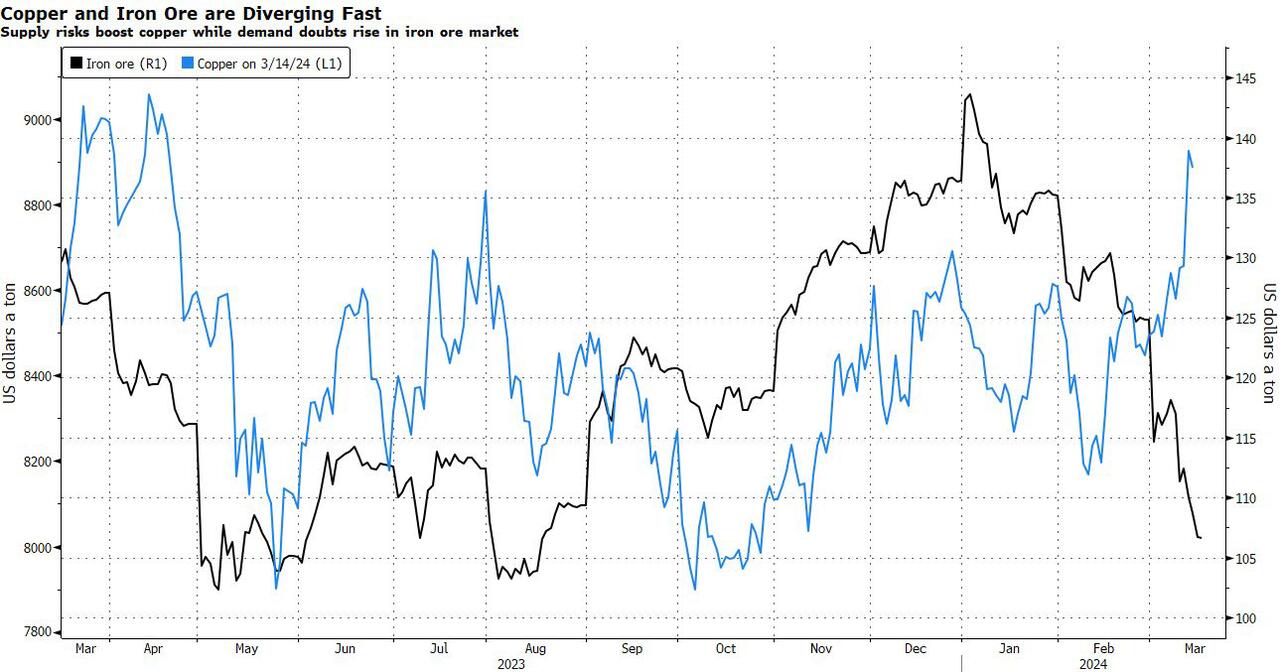
Indeed, while the mood surrounding copper has turned almost euphoric, sentiment on iron ore has soured since the conclusion of the latest National People’s Congress in Beijing, where the CCP set a 5% goal for economic growth, but offered few new measures that would boost infrastructure or other construction-intensive sectors.
As a result, the main steelmaking ingredient has shed more than 30% since early January as hopes of a meaningful revival in construction activity faded. Loss-making steel mills are buying less ore, and stockpiles are piling up at Chinese ports. The latest drop will embolden those who believe that the effects of President Xi Jinping’s property crackdown still have significant room to run, and that last year’s rally in iron ore may have been a false dawn.
Meanwhile, as Bloomberg notes, on Friday there were fresh signs that weakness in China’s industrial economy is hitting the copper market too, with stockpiles tracked by the Shanghai Futures Exchange surging to the highest level since the early days of the pandemic. The hope is that headwinds in traditional industrial areas will be offset by an ongoing surge in usage in electric vehicles and renewables.
And while industrial conditions in Europe and the US also look soft, there’s growing optimism about copper usage in India, where rising investment has helped fuel blowout growth rates of more than 8% — making it the fastest-growing major economy.
In any case, with the demand side of the equation still questionable, the main catalyst behind copper’s powerful rally is an unexpected tightening in global mine supplies, driven mainly by last year’s closure of a giant mine in Panama (discussed here), but there are also growing worries about output in Zambia, which is facing an El Niño-induced power crisis.
On Wednesday, copper prices jumped on huge volumes after smelters in China held a crisis meeting on how to cope with a sharp drop in processing fees following disruptions to supplies of mined ore. The group stopped short of coordinated production cuts, but pledged to re-arrange maintenance work, reduce runs and delay the startup of new projects. In the coming weeks investors will be watching Shanghai exchange inventories closely to gauge both the strength of demand and the extent of any capacity curtailments.
“The increase in SHFE stockpiles has been bigger than we’d anticipated, but we expect to see them coming down over the next few weeks,” Colin Hamilton, managing director for commodities research at BMO Capital Markets, said by phone. “If the pace of the inventory builds doesn’t start to slow, investors will start to question whether smelters are actually cutting and whether the impact of weak construction activity is starting to weigh more heavily on the market.”
* * *
Few have been as happy with the recent surge in copper prices as Goldman's commodity team, where copper has long been a preferred trade (even if it may have cost the former team head Jeff Currie his job due to his unbridled enthusiasm for copper in the past two years which saw many hedge fund clients suffer major losses).
As Goldman's Nicholas Snowdon writes in a note titled "Copper's time is now" (available to pro subscribers in the usual place)...

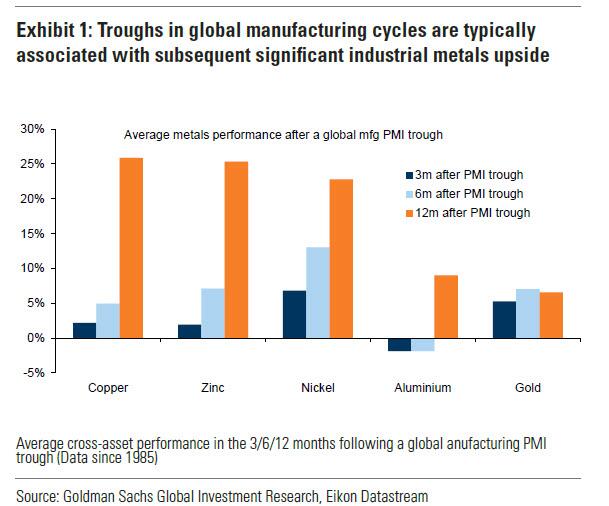
... there has been a "turn in the industrial cycle." Specifically according to the Goldman analyst, after a prolonged downturn, "incremental evidence now points to a bottoming out in the industrial cycle, with the global manufacturing PMI in expansion for the first time since September 2022." As a result, Goldman now expects copper to rise to $10,000/t by year-end and then $12,000/t by end of Q1-25.’
Here are the details:
Previous inflexions in global manufacturing cycles have been associated with subsequent sustained industrial metals upside, with copper and aluminium rising on average 25% and 9% over the next 12 months. Whilst seasonal surpluses have so far limited a tightening alignment at a micro level, we expect deficit inflexions to play out from quarter end, particularly for metals with severe supply binds. Supplemented by the influence of anticipated Fed easing ahead in a non-recessionary growth setting, another historically positive performance factor for metals, this should support further upside ahead with copper the headline act in this regard.
Goldman then turns to what it calls China's "green policy put":
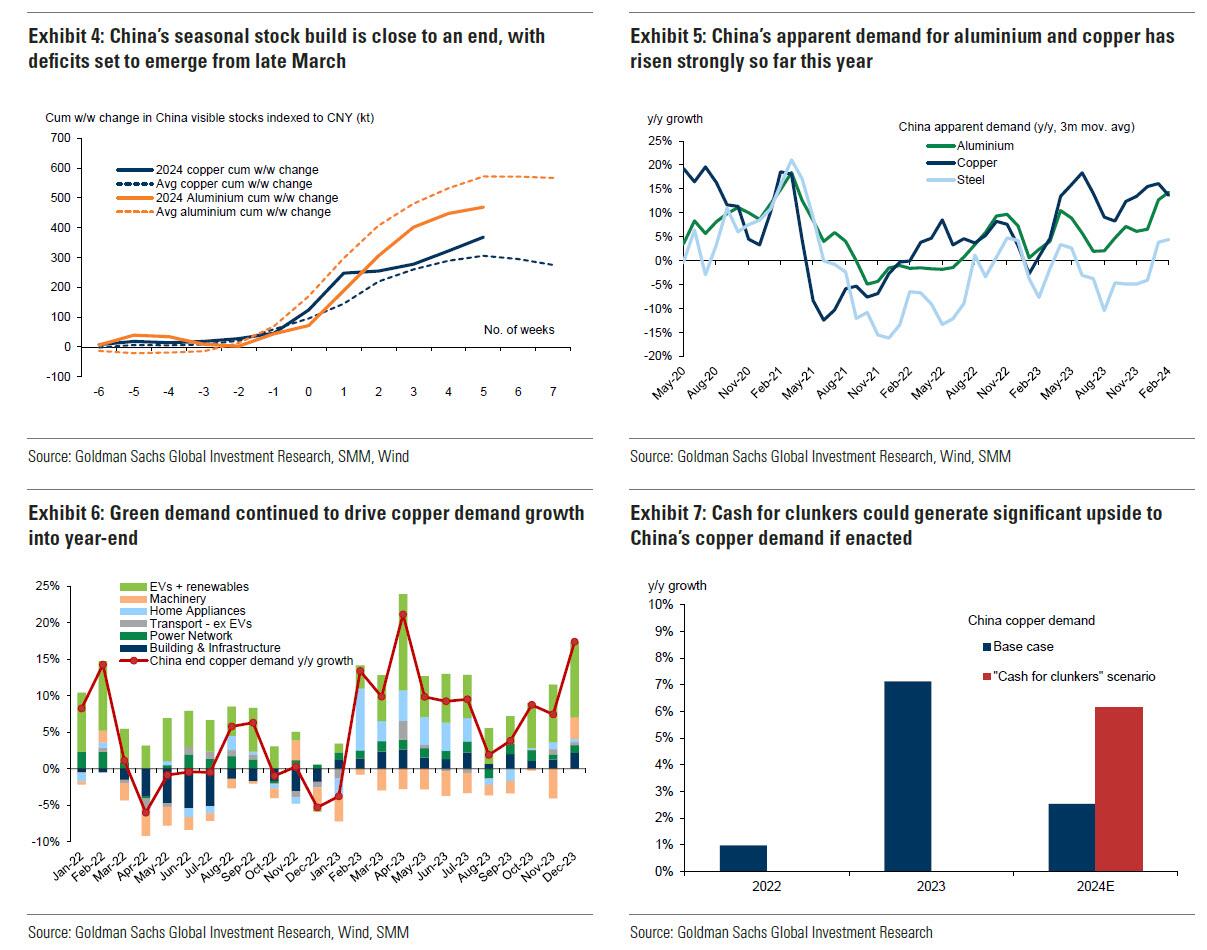
Much of the recent focus on the “Two Sessions” event centred on the lack of significant broad stimulus, and in particular the limited property support. In our view it would be wrong – just as in 2022 and 2023 – to assume that this will result in weak onshore metals demand. Beijing’s emphasis on rapid growth in the metals intensive green economy, as an offset to property declines, continues to act as a policy put for green metals demand. After last year’s strong trends, evidence year-to-date is again supportive with aluminium and copper apparent demand rising 17% and 12% y/y respectively. Moreover, the potential for a ‘cash for clunkers’ initiative could provide meaningful right tail risk to that healthy demand base case. Yet there are also clear metal losers in this divergent policy setting, with ongoing pressure on property related steel demand generating recent sharp iron ore downside.
Meanwhile, Snowdon believes that the driver behind Goldman's long-running bullish view on copper - a global supply shock - continues:
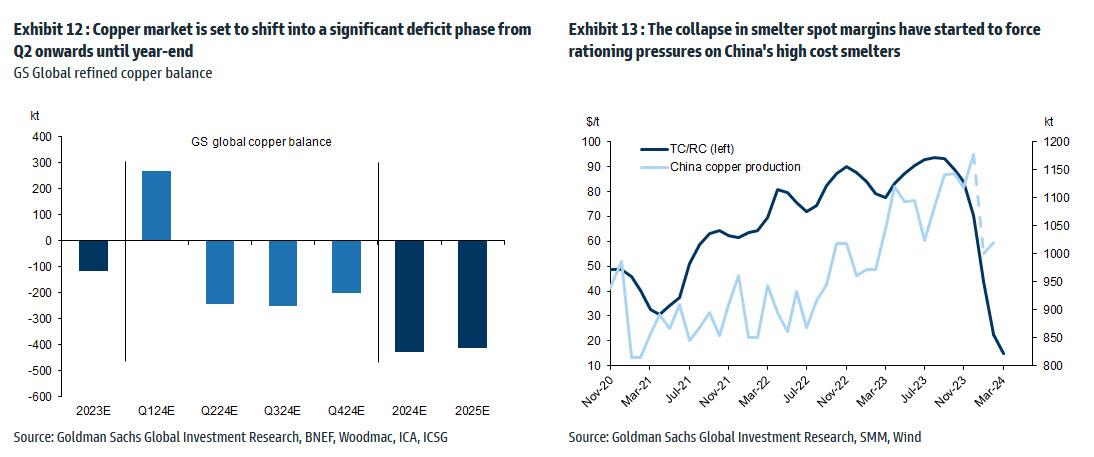
Copper’s supply shock progresses. The metal with most significant upside potential is copper, in our view. The supply shock which began with aggressive concentrate destocking and then sharp mine supply downgrades last year, has now advanced to an increasing bind on metal production, as reflected in this week's China smelter supply rationing signal. With continued positive momentum in China's copper demand, a healthy refined import trend should generate a substantial ex-China refined deficit this year. With LME stocks having halved from Q4 peak, China’s imminent seasonal demand inflection should accelerate a path into extreme tightness by H2. Structural supply underinvestment, best reflected in peak mine supply we expect next year, implies that demand destruction will need to be the persistent solver on scarcity, an effect requiring substantially higher pricing than current, in our view. In this context, we maintain our view that the copper price will surge into next year (GSe 2025 $15,000/t average), expecting copper to rise to $10,000/t by year-end and then $12,000/t by end of Q1-25’
Another reason why Goldman is doubling down on its bullish copper outlook: gold.
The sharp rally in gold price since the beginning of March has ended the period of consolidation that had been present since late December. Whilst the initial catalyst for the break higher came from a (gold) supportive turn in US data and real rates, the move has been significantly amplified by short term systematic buying, which suggests less sticky upside. In this context, we expect gold to consolidate for now, with our economists near term view on rates and the dollar suggesting limited near-term catalysts for further upside momentum. Yet, a substantive retracement lower will also likely be limited by resilience in physical buying channels. Nonetheless, in the midterm we continue to hold a constructive view on gold underpinned by persistent strength in EM demand as well as eventual Fed easing, which should crucially reactivate the largely for now dormant ETF buying channel. In this context, we increase our average gold price forecast for 2024 from $2,090/toz to $2,180/toz, targeting a move to $2,300/toz by year-end.
Much more in the full Goldman note available to pro subs.
International
The millions of people not looking for work in the UK may be prioritising education, health and freedom
Economic inactivity is not always the worst option.
Share this:


Around one in five British people of working age (16-64) are now outside the labour market. Neither in work nor looking for work, they are officially labelled as “economically inactive”.
Some of those 9.2 million people are in education, with many students not active in the labour market because they are studying full-time. Others are older workers who have chosen to take early retirement.
But that still leaves a large number who are not part of the labour market because they are unable to work. And one key driver of economic inactivity in recent years has been illness.
This increase in economic inactivity – which has grown since before the pandemic – is not just harming the economy, but also indicative of a deeper health crisis.
For those suffering ill health, there are real constraints on access to work. People with health-limiting conditions cannot just slot into jobs that are available. They need help to address the illnesses they have, and to re-engage with work through organisations offering supportive and healthy work environments.
And for other groups, such as stay-at-home parents, businesses need to offer flexible work arrangements and subsidised childcare to support the transition from economic inactivity into work.
The government has a role to play too. Most obviously, it could increase investment in the NHS. Rising levels of poor health are linked to years of under-investment in the health sector and economic inactivity will not be tackled without more funding.
Carrots and sticks
For the time being though, the UK government appears to prefer an approach which mixes carrots and sticks. In the March 2024 budget, for example, the chancellor cut national insurance by 2p as a way of “making work pay”.
But it is unclear whether small tax changes like this will have any effect on attracting the economically inactive back into work.
Jeremy Hunt also extended free childcare. But again, questions remain over whether this is sufficient to remove barriers to work for those with parental responsibilities. The high cost and lack of availability of childcare remain key weaknesses in the UK economy.
The benefit system meanwhile has been designed to push people into work. Benefits in the UK remain relatively ungenerous and hard to access compared with other rich countries. But labour shortages won’t be solved by simply forcing the economically inactive into work, because not all of them are ready or able to comply.
It is also worth noting that work itself may be a cause of bad health. The notion of “bad work” – work that does not pay enough and is unrewarding in other ways – can lead to economic inactivity.
There is also evidence that as work has become more intensive over recent decades, for some people, work itself has become a health risk.
The pandemic showed us how certain groups of workers (including so-called “essential workers”) suffered more ill health due to their greater exposure to COVID. But there are broader trends towards lower quality work that predate the pandemic, and these trends suggest improving job quality is an important step towards tackling the underlying causes of economic inactivity.
Freedom
Another big section of the economically active population who cannot be ignored are those who have retired early and deliberately left the labour market behind. These are people who want and value – and crucially, can afford – a life without work.
Here, the effects of the pandemic can be seen again. During those years of lockdowns, furlough and remote working, many of us reassessed our relationship with our jobs. Changed attitudes towards work among some (mostly older) workers can explain why they are no longer in the labour market and why they may be unresponsive to job offers of any kind.

And maybe it is from this viewpoint that we should ultimately be looking at economic inactivity – that it is actually a sign of progress. That it represents a move towards freedom from the drudgery of work and the ability of some people to live as they wish.
There are utopian visions of the future, for example, which suggest that individual and collective freedom could be dramatically increased by paying people a universal basic income.
In the meantime, for plenty of working age people, economic inactivity is a direct result of ill health and sickness. So it may be that the levels of economic inactivity right now merely show how far we are from being a society which actually supports its citizens’ wellbeing.
David Spencer has received funding from the ESRC.
uk pandemic

Problems After COVID-19 Vaccination More Prevalent Among Naturally Immune: Study


Illegal Immigrants Leave US Hospitals With Billions In Unpaid Bills


Looking Back At COVID’s Authoritarian Regimes


‘Excess Mortality Skyrocketed’: Tucker Carlson and Dr. Pierre Kory Unpack ‘Criminal’ COVID Response


Copper Soars, Iron Ore Tumbles As Goldman Says “Copper’s Time Is Now”


Gen Z, The Most Pessimistic Generation In History, May Decide The Election


The millions of people not looking for work in the UK may be prioritising education, health and freedom


Fuel poverty in England is probably 2.5 times higher than government statistics show
-

 Uncategorized3 weeks ago
All Of The Elements Are In Place For An Economic Crisis Of Staggering Proportions
-

 International1 week ago
EyePoint poaches medical chief from Apellis; Sandoz CFO, longtime BioNTech exec to retire
-

 Uncategorized4 weeks ago
California Counties Could Be Forced To Pay $300 Million To Cover COVID-Era Program
-

 Uncategorized3 weeks ago
Apparel Retailer Express Moving Toward Bankruptcy
-

 Uncategorized1 month ago
Industrial Production Decreased 0.1% in January
-

 Spread & Containment3 days ago
IFM’s Hat Trick and Reflections On Option-To-Buy M&A
-

 International1 week ago
Walmart launches clever answer to Target’s new membership program
-

 Uncategorized4 weeks ago
RFK Jr: The Wuhan Cover-Up & The Rise Of The Biowarfare-Industrial Complex