Reinsurance Market Report by Technavio predicts USD 328.62 Bn growth — Driven by increasing awareness of insurance products in emerging markets
Reinsurance Market Report by Technavio predicts USD 328.62 Bn growth — Driven by increasing awareness of insurance products in emerging markets
PR Newswire
NEW YORK, Sept. 5, 2022
NEW YORK, Sept. 5, 2022 /PRNewswire/ — The reinsurance market has …
Share this:

Reinsurance Market Report by Technavio predicts USD 328.62 Bn growth -- Driven by increasing awareness of insurance products in emerging markets
PR Newswire
NEW YORK, Sept. 5, 2022
NEW YORK, Sept. 5, 2022 /PRNewswire/ -- The reinsurance market has grown substantially over the years. To estimate the size of the market, Technavio has tracked the recent trends and developments in the reinsurance market. The analysts at Technavio have considered various aspects such as the consumer base, adoption rate, average selling price, revenue generated by vendors, and various other factors to estimate the market size. Download Sample PDF Report Here to get an idea of the overall scope of the full report.
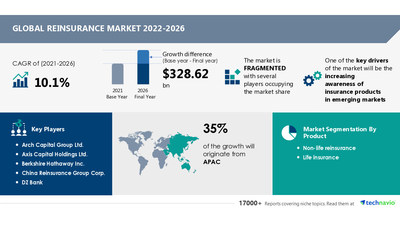
The report on the reinsurance market by Technavio expects the market size to increase at a CAGR of 10.1% and register an incremental growth of USD 328.62 billion between 2021 and 2026. However, the growth forecast could be missed with the market growing slower than expected if the following factors come into play: vulnerability to cybercrimes and lower interest rates due to market softening.
According to Technavio, the growth of the market is primarily driven by increasing awareness of insurance products in emerging markets.
The insurance market in developing countries is growing rapidly. People have been proactively buying insurance for life and health, property, and casualty. The rising awareness of the importance of insurance among people and the presence of stricter government regulations are leading to an increase in the sale of insurance products. All these factors are driving the growth of the global reinsurance market.
"Increasing geriatric population and the emergence of new products in the market will further accelerate the growth of the market", says an analyst at Technavio.
The global reinsurance market is fragmented in nature. The vendors are from all over the world, mainly from the US, the UK, and some Asian countries. Key players operating in the global reinsurance market include Swiss Re, Munich Re, Berkshire Hathaway, and Lloyds. The global reinsurance market is in its growth phase. Large vendors are acquiring smaller vendors to expand their product portfolios and expand their market shares. There are other prominent vendors as well, which hold a significant position in the market. The market demands innovation and better service.
To survive in this intensely competitive environment, it becomes imperative for vendors to distinguish their product and service offerings through clear and unique value propositions. Intense competition, rapid advances in technology, and frequent changes in end-user preferences constitute significant risks for vendors.
The report breaks down the market into the following segments:
- Product: non-life reinsurance and life insurance
- Geography: North America, APAC, Europe, South America, and MEA
Based on the product, the non-life insurance segment is expected to create more revenue in the market. The segment is driven by growth in property insurance and specialty insurance policies such as energy, marine, and aviation.
In terms of region, APAC will emerge as the dominant region, occupying 35% of the global market share. The regional market is driven by increasing purchasing power and rising awareness among people.
The complete report on the global reinsurance market offers detailed insights on the potential business segments and regions to invest in over the forecast period. Before making the purchase, we recommend reading our Sample PDF Report.
The reinsurance market report answers questions such as:
- Is the market structure fragmented or concentrated?
- What was the market size in 2021 and the forecast for the reinsurance market through 2026?
- Which are the best product segment areas to invest in over the forecast period?
- What is the market share of dominant and strong vendors in the reinsurance market?
- What are the inhibiting factors and the impact of COVID-19 on the reinsurance market growth?
- What are the latest trends and regulatory frameworks in the reinsurance market?
Got more queries? Speak to our analyst now
Users who bought this report also purchased,
- Life Annuity Insurance Market in Czech Republic Growth, Size, Trends, Analysis Report by Type, Application, Region and Segment Forecast 2022-2026
- Marine Insurance Market Growth, Size, Trends, Analysis Report by Type, Application, Region and Segment Forecast 2020-2024
Reinsurance Market Scope | |
Report Coverage | Details |
Page number | 120 |
Base year | 2021 |
Forecast period | 2022-2026 |
Growth momentum & CAGR | Accelerate at a CAGR of 10.1% |
Market growth 2022-2026 | USD 328.62 billion |
Market structure | Fragmented |
YoY growth (%) | 9.3 |
Regional analysis | Europe, APAC, North America, Middle East and Africa, and South America |
Performing market contribution | APAC at 35% |
Key consumer countries | US, China, Japan, Germany, and UK |
Competitive landscape | Leading companies, competitive strategies, consumer engagement scope |
Companies profiled | Arch Capital Group Ltd., Axis Capital Holdings Ltd., Berkshire Hathaway Inc., China Reinsurance Group Corp., DZ Bank, Everest Re Group Ltd., General Insurance Corporation of India, Great West Lifeco Inc., Hannover Re, Korean Reinsurance Co., Lloyds and Corp., Mitsui Sumitomo Insurance Group Holdings Inc., MS and AD Insurance Group Holdings Inc., Munich Reinsurance Co., Odyssey Group Holdings Inc., PartnerRe Ltd., QBE Insurance Group Ltd., RenaissanceRe holdings, SCOR SE, Swiss Re Ltd., and The Toa Reinsurance Co.A Ltd. |
Market Dynamics | Parent market analysis, Market growth inducers and obstacles, Fast-growing and slow-growing segment analysis, COVID-19 impact and future consumer dynamics, and market condition analysis for the forecast period. |
Customization purview | If our report has not included the data you are looking for, you can reach out to our analysts and get customized segments. |
1 Executive Summary
- 1.1 Market Overview
- Exhibit 01: Executive Summary – Chart on Market Overview
- Exhibit 02: Executive Summary – Data Table on Market Overview
- Exhibit 03: Executive Summary – Chart on Global Market Characteristics
- Exhibit 04: Executive Summary – Chart on Market by Geography
- Exhibit 05: Executive Summary – Chart on Market Segmentation by Product
- Exhibit 06: Executive Summary – Chart on Incremental Growth
- Exhibit 07: Executive Summary – Data Table on Incremental Growth
- Exhibit 08: Executive Summary – Chart on Vendor Market Positioning
2 Market Landscape
- 2.1 Market ecosystem
- Exhibit 09: Parent market
- Exhibit 10: Market Characteristics
3 Market Sizing
- 3.1 Market definition
- Exhibit 11: Offerings of vendors included in the market definition
- 3.2 Market segment analysis
- Exhibit 12: Market segments
- 3.3 Market size 2021
- 3.4 Market outlook: Forecast for 2021-2026
- Exhibit 13: Chart on Global - Market size and forecast 2021-2026 ($ billion)
- Exhibit 14: Data Table on Global - Market size and forecast 2021-2026 ($ billion)
- Exhibit 15: Chart on Global Market: Year-over-year growth 2021-2026 (%)
- Exhibit 16: Data Table on Global Market: Year-over-year growth 2021-2026 (%)
4 Five Forces Analysis
- 4.1 Five forces summary
- Exhibit 17: Five forces analysis - Comparison between2021 and 2026
- 4.2 Bargaining power of buyers
- Exhibit 18: Chart on Bargaining power of buyers – Impact of key factors 2021 and 2026
- 4.3 Bargaining power of suppliers
- Exhibit 19: Bargaining power of suppliers – Impact of key factors in 2021 and 2026
- 4.4 Threat of new entrants
- Exhibit 20: Threat of new entrants – Impact of key factors in 2021 and 2026
- 4.5 Threat of substitutes
- Exhibit 21: Threat of substitutes – Impact of key factors in 2021 and 2026
- 4.6 Threat of rivalry
- Exhibit 22: Threat of rivalry – Impact of key factors in 2021 and 2026
- 4.7 Market condition
- Exhibit 23: Chart on Market condition - Five forces 2021 and 2026
5 Market Segmentation by Product
- 5.1 Market segments
- Exhibit 24: Chart on Product - Market share 2021-2026 (%)
- Exhibit 25: Data Table on Product - Market share 2021-2026 (%)
- 5.2 Comparison by Product
- Exhibit 26: Chart on Comparison by Product
- Exhibit 27: Data Table on Comparison by Product
- 5.3 Non-life reinsurance - Market size and forecast 2021-2026
- Exhibit 28: Chart on Non-life reinsurance - Market size and forecast 2021-2026 ($ billion)
- Exhibit 29: Data Table on Non-life reinsurance - Market size and forecast 2021-2026 ($ billion)
- Exhibit 30: Chart on Non-life reinsurance - Year-over-year growth 2021-2026 (%)
- Exhibit 31: Data Table on Non-life reinsurance - Year-over-year growth 2021-2026 (%)
- 5.4 Life reinsurance - Market size and forecast 2021-2026
- Exhibit 32: Chart on Life reinsurance - Market size and forecast 2021-2026 ($ billion)
- Exhibit 33: Data Table on Life reinsurance - Market size and forecast 2021-2026 ($ billion)
- Exhibit 34: Chart on Life reinsurance - Year-over-year growth 2021-2026 (%)
- Exhibit 35: Data Table on Life reinsurance - Year-over-year growth 2021-2026 (%)
- 5.5 Market opportunity by Product
- Exhibit 36: Market opportunity by Product ($ billion)
6 Customer Landscape
- 6.1 Customer landscape overview
- Exhibit 37: Analysis of price sensitivity, lifecycle, customer purchase basket, adoption rates, and purchase criteria
7 Geographic Landscape
- 7.1 Geographic segmentation
- Exhibit 38: Chart on Market share by geography 2021-2026 (%)
- Exhibit 39: Data Table on Market share by geography 2021-2026 (%)
- 7.2 Geographic comparison
- Exhibit 40: Chart on Geographic comparison
- Exhibit 41: Data Table on Geographic comparison
- 7.3 Europe - Market size and forecast 2021-2026
- Exhibit 42: Chart on Europe - Market size and forecast 2021-2026 ($ billion)
- Exhibit 43: Data Table on Europe - Market size and forecast 2021-2026 ($ billion)
- Exhibit 44: Chart on Europe - Year-over-year growth 2021-2026 (%)
- Exhibit 45: Data Table on Europe - Year-over-year growth 2021-2026 (%)
- 7.4 APAC - Market size and forecast 2021-2026
- Exhibit 46: Chart on APAC - Market size and forecast 2021-2026 ($ billion)
- Exhibit 47: Data Table on APAC - Market size and forecast 2021-2026 ($ billion)
- Exhibit 48: Chart on APAC - Year-over-year growth 2021-2026 (%)
- Exhibit 49: Data Table on APAC - Year-over-year growth 2021-2026 (%)
- 7.5 North America - Market size and forecast 2021-2026
- Exhibit 50: Chart on North America - Market size and forecast 2021-2026 ($ billion)
- Exhibit 51: Data Table on North America - Market size and forecast 2021-2026 ($ billion)
- Exhibit 52: Chart on North America - Year-over-year growth 2021-2026 (%)
- Exhibit 53: Data Table on North America - Year-over-year growth 2021-2026 (%)
- 7.6 Middle East and Africa - Market size and forecast 2021-2026
- Exhibit 54: Chart on Middle East and Africa - Market size and forecast 2021-2026 ($ billion)
- Exhibit 55: Data Table on Middle East and Africa - Market size and forecast 2021-2026 ($ billion)
- Exhibit 56: Chart on Middle East and Africa - Year-over-year growth 2021-2026 (%)
- Exhibit 57: Data Table on Middle East and Africa - Year-over-year growth 2021-2026 (%)
- 7.7 South America - Market size and forecast 2021-2026
- Exhibit 58: Chart on South America - Market size and forecast 2021-2026 ($ billion)
- Exhibit 59: Data Table on South America - Market size and forecast 2021-2026 ($ billion)
- Exhibit 60: Chart on South America - Year-over-year growth 2021-2026 (%)
- Exhibit 61: Data Table on South America - Year-over-year growth 2021-2026 (%)
- 7.8 US - Market size and forecast 2021-2026
- Exhibit 62: Chart on US - Market size and forecast 2021-2026 ($ billion)
- Exhibit 63: Data Table on US - Market size and forecast 2021-2026 ($ billion)
- Exhibit 64: Chart on US - Year-over-year growth 2021-2026 (%)
- Exhibit 65: Data Table on US - Year-over-year growth 2021-2026 (%)
- 7.9 Germany - Market size and forecast 2021-2026
- Exhibit 66: Chart on Germany - Market size and forecast 2021-2026 ($ billion)
- Exhibit 67: Data Table on Germany - Market size and forecast 2021-2026 ($ billion)
- Exhibit 68: Chart on Germany - Year-over-year growth 2021-2026 (%)
- Exhibit 69: Data Table on Germany - Year-over-year growth 2021-2026 (%)
- 7.10 China - Market size and forecast 2021-2026
- Exhibit 70: Chart on China - Market size and forecast 2021-2026 ($ billion)
- Exhibit 71: Data Table on China - Market size and forecast 2021-2026 ($ billion)
- Exhibit 72: Chart on China - Year-over-year growth 2021-2026 (%)
- Exhibit 73: Data Table on China - Year-over-year growth 2021-2026 (%)
- 7.11 Japan - Market size and forecast 2021-2026
- Exhibit 74: Chart on Japan - Market size and forecast 2021-2026 ($ billion)
- Exhibit 75: Data Table on Japan - Market size and forecast 2021-2026 ($ billion)
- Exhibit 76: Chart on Japan - Year-over-year growth 2021-2026 (%)
- Exhibit 77: Data Table on Japan - Year-over-year growth 2021-2026 (%)
- 7.12 UK - Market size and forecast 2021-2026
- Exhibit 78: Chart on UK - Market size and forecast 2021-2026 ($ billion)
- Exhibit 79: Data Table on UK - Market size and forecast 2021-2026 ($ billion)
- Exhibit 80: Chart on UK - Year-over-year growth 2021-2026 (%)
- Exhibit 81: Data Table on UK - Year-over-year growth 2021-2026 (%)
- 7.13 Market opportunity by geography
- Exhibit 82: Market opportunity by geography ($ billion)
8 Drivers, Challenges, and Trends
- 8.1 Market drivers
- 8.2 Market challenges
- 8.3 Impact of drivers and challenges
- Exhibit 83: Impact of drivers and challenges in 2021 and 2026
- 8.4 Market trends
9 Vendor Landscape
- 9.1 Overview
- 9.2 Vendor landscape
- Exhibit 84: Overview on Criticality of inputs and Factors of differentiation
- 9.3 Landscape disruption
- Exhibit 85: Overview on factors of disruption
- 9.4 Industry risks
- Exhibit 86: Impact of key risks on business
10 Vendor Analysis
- 10.1 Vendors covered
- Exhibit 87: Vendors covered
- 10.2 Market positioning of vendors
- Exhibit 88: Matrix on vendor position and classification
- 10.3 Arch Capital Group Ltd.
- Exhibit 89: Arch Capital Group Ltd. - Overview
- Exhibit 90: Arch Capital Group Ltd. - Business segments
- Exhibit 91: Arch Capital Group Ltd. - Key offerings
- Exhibit 92: Arch Capital Group Ltd. - Segment focus
- 10.4 Axis Capital Holdings Ltd.
- Exhibit 93: Axis Capital Holdings Ltd. - Overview
- Exhibit 94: Axis Capital Holdings Ltd. - Business segments
- Exhibit 95: Axis Capital Holdings Ltd. - Key offerings
- Exhibit 96: Axis Capital Holdings Ltd. - Segment focus
- 10.5 Berkshire Hathaway Inc.
- Exhibit 97: Berkshire Hathaway Inc. - Overview
- Exhibit 98: Berkshire Hathaway Inc. - Business segments
- Exhibit 99: Berkshire Hathaway Inc. - Key offerings
- Exhibit 100: Berkshire Hathaway Inc. - Segment focus
- 10.6 China Reinsurance Group Corp.
- Exhibit 101: China Reinsurance Group Corp. - Overview
- Exhibit 102: China Reinsurance Group Corp. - Business segments
- Exhibit 103: China Reinsurance Group Corp. - Key offerings
- Exhibit 104: China Reinsurance Group Corp. - Segment focus
- 10.7 Everest Re Group Ltd.
- Exhibit 105: Everest Re Group Ltd. - Overview
- Exhibit 106: Everest Re Group Ltd. - Business segments
- Exhibit 107: Everest Re Group Ltd. - Key offerings
- Exhibit 108: Everest Re Group Ltd. - Segment focus
- 10.8 General Insurance Corporation of India
- Exhibit 109: General Insurance Corporation of India - Overview
- Exhibit 110: General Insurance Corporation of India - Product / Service
- Exhibit 111: General Insurance Corporation of India - Key offerings
- 10.9 Hannover Re
- Exhibit 112: Hannover Re - Overview
- Exhibit 113: Hannover Re - Product / Service
- Exhibit 114: Hannover Re - Key offerings
- 10.10 Lloyds and Corp.
- Exhibit 115: Lloyds and Corp. - Overview
- Exhibit 116: Lloyds and Corp. - Product / Service
- Exhibit 117: Lloyds and Corp. - Key offerings
- 10.11 Munich Reinsurance Co.
- Exhibit 118: Munich Reinsurance Co. - Overview
- Exhibit 119: Munich Reinsurance Co. - Business segments
- Exhibit 120: Munich Reinsurance Co. - Key offerings
- Exhibit 121: Munich Reinsurance Co. - Segment focus
- 10.12 Swiss Re Ltd.
- Exhibit 122: Swiss Re Ltd. - Overview
- Exhibit 123: Swiss Re Ltd. - Business segments
- Exhibit 124: Swiss Re Ltd. - Key news
- Exhibit 125: Swiss Re Ltd. - Key offerings
- Exhibit 126: Swiss Re Ltd. - Segment focus
11 Appendix
- 11.1 Scope of the report
- 11.2 Inclusions and exclusions checklist
- Exhibit 127: Inclusions checklist
- Exhibit 128: Exclusions checklist
- 11.3 Currency conversion rates for US$
- Exhibit 129: Currency conversion rates for US$
- 11.4 Research methodology
- Exhibit 130: Research methodology
- Exhibit 131: Validation techniques employed for market sizing
- Exhibit 132: Information sources
- 11.5 List of abbreviations
- Exhibit 133: List of abbreviations
Technavio is a leading global technology research and advisory company. Their research and analysis focus on emerging market trends and provide actionable insights to help businesses identify market opportunities and develop effective strategies to optimize their market positions.
With over 500 specialized analysts, Technavio's report library consists of more than 17,000 reports and counting, covering 800 technologies, spanning across 50 countries. Their client base consists of enterprises of all sizes, including more than 100 Fortune 500 companies. This growing client base relies on Technavio's comprehensive coverage, extensive research, and actionable market insights to identify opportunities in existing and potential markets and assess their competitive positions within changing market scenarios.
Contact
Technavio Research
Jesse Maida
Media & Marketing Executive
US: +1 844 364 1100
UK: +44 203 893 3200
Email:media@technavio.com
Website: www.technavio.com/
")
View original content to download multimedia:https://www.prnewswire.com/news-releases/reinsurance-market-report-by-technavio-predicts-usd-328-62-bn-growth--driven-by-increasing-awareness-of-insurance-products-in-emerging-markets-301617400.html
SOURCE Technavio
International
United Airlines adds new flights to faraway destinations
The airline said that it has been working hard to "find hidden gem destinations."
Share this:


Since countries started opening up after the pandemic in 2021 and 2022, airlines have been seeing demand soar not just for major global cities and popular routes but also for farther-away destinations.
Numerous reports, including a recent TripAdvisor survey of trending destinations, showed that there has been a rise in U.S. traveler interest in Asian countries such as Japan, South Korea and Vietnam as well as growing tourism traction in off-the-beaten-path European countries such as Slovenia, Estonia and Montenegro.
Related: 'No more flying for you': Travel agency sounds alarm over risk of 'carbon passports'
As a result, airlines have been looking at their networks to include more faraway destinations as well as smaller cities that are growing increasingly popular with tourists and may not be served by their competitors.
Shutterstock
United brings back more routes, says it is committed to 'finding hidden gems'
This week, United Airlines (UAL) announced that it will be launching a new route from Newark Liberty International Airport (EWR) to Morocco's Marrakesh. While it is only the country's fourth-largest city, Marrakesh is a particularly popular place for tourists to seek out the sights and experiences that many associate with the country — colorful souks, gardens with ornate architecture and mosques from the Moorish period.
More Travel:
- A new travel term is taking over the internet (and reaching airlines and hotels)
- The 10 best airline stocks to buy now
- Airlines see a new kind of traveler at the front of the plane
"We have consistently been ahead of the curve in finding hidden gem destinations for our customers to explore and remain committed to providing the most unique slate of travel options for their adventures abroad," United's SVP of Global Network Planning Patrick Quayle, said in a press statement.
The new route will launch on Oct. 24 and take place three times a week on a Boeing 767-300ER (BA) plane that is equipped with 46 Polaris business class and 22 Premium Plus seats. The plane choice was a way to reach a luxury customer customer looking to start their holiday in Marrakesh in the plane.
Along with the new Morocco route, United is also launching a flight between Houston (IAH) and Colombia's Medellín on Oct. 27 as well as a route between Tokyo and Cebu in the Philippines on July 31 — the latter is known as a "fifth freedom" flight in which the airline flies to the larger hub from the mainland U.S. and then goes on to smaller Asian city popular with tourists after some travelers get off (and others get on) in Tokyo.
United's network expansion includes new 'fifth freedom' flight
In the fall of 2023, United became the first U.S. airline to fly to the Philippines with a new Manila-San Francisco flight. It has expanded its service to Asia from different U.S. cities earlier last year. Cebu has been on its radar amid growing tourist interest in the region known for marine parks, rainforests and Spanish-style architecture.
With the summer coming up, United also announced that it plans to run its current flights to Hong Kong, Seoul, and Portugal's Porto more frequently at different points of the week and reach four weekly flights between Los Angeles and Shanghai by August 29.
"This is your normal, exciting network planning team back in action," Quayle told travel website The Points Guy of the airline's plans for the new routes.
stocks pandemic south korea japan hong kong europeanInternational
Walmart launches clever answer to Target’s new membership program
The retail superstore is adding a new feature to its Walmart+ plan — and customers will be happy.
Share this:


It's just been a few days since Target (TGT) launched its new Target Circle 360 paid membership plan.
The plan offers free and fast shipping on many products to customers, initially for $49 a year and then $99 after the initial promotional signup period. It promises to be a success, since many Target customers are loyal to the brand and will go out of their way to shop at one instead of at its two larger peers, Walmart and Amazon.
Related: Walmart makes a major price cut that will delight customers
And stop us if this sounds familiar: Target will rely on its more than 2,000 stores to act as fulfillment hubs.
This model is a proven winner; Walmart also uses its more than 4,600 stores as fulfillment and shipping locations to get orders to customers as soon as possible.
Sometimes, this means shipping goods from the nearest warehouse. But if a desired product is in-store and closer to a customer, it reduces miles on the road and delivery time. It's a kind of logistical magic that makes any efficiency lover's (or retail nerd's) heart go pitter patter.
Walmart rolls out answer to Target's new membership tier
Walmart has certainly had more time than Target to develop and work out the kinks in Walmart+. It first launched the paid membership in 2020 during the height of the pandemic, when many shoppers sheltered at home but still required many staples they might ordinarily pick up at a Walmart, like cleaning supplies, personal-care products, pantry goods and, of course, toilet paper.
It also undercut Amazon (AMZN) Prime, which costs customers $139 a year for free and fast shipping (plus several other benefits including access to its streaming service, Amazon Prime Video).
Walmart+ costs $98 a year, which also gets you free and speedy delivery, plus access to a Paramount+ streaming subscription, fuel savings, and more.
If that's not enough to tempt you, however, Walmart+ just added a new benefit to its membership program, ostensibly to compete directly with something Target now has: ultrafast delivery.
Target Circle 360 particularly attracts customers with free same-day delivery for select orders over $35 and as little as one-hour delivery on select items. Target executes this through its Shipt subsidiary.
We've seen this lightning-fast delivery speed only in snippets from Amazon, the king of delivery efficiency. Who better to take on Target, though, than Walmart, which is using a similar store-as-fulfillment-center model?
"Walmart is stepping up to save our customers even more time with our latest delivery offering: Express On-Demand Early Morning Delivery," Walmart said in a statement, just a day after Target Circle 360 launched. "Starting at 6 a.m., earlier than ever before, customers can enjoy the convenience of On-Demand delivery."
Walmart (WMT) clearly sees consumers' desire for near-instant delivery, which obviously saves time and trips to the store. Rather than waiting a day for your order to show up, it might be on your doorstep when you wake up.
Consumers also tend to spend more money when they shop online, and they remain stickier as paying annual members. So, to a growing number of retail giants, almost instant gratification like this seems like something worth striving for.
Related: Veteran fund manager picks favorite stocks for 2024
stocks pandemic mexicoUncategorized
Comments on February Employment Report
The headline jobs number in the February employment report was above expectations; however, December and January payrolls were revised down by 167,000 combined. The participation rate was unchanged, the employment population ratio decreased, and the …
Share this:


Prime (25 to 54 Years Old) Participation
Since the overall participation rate is impacted by both cyclical (recession) and demographic (aging population, younger people staying in school) reasons, here is the employment-population ratio for the key working age group: 25 to 54 years old.
The 25 to 54 years old participation rate increased in February to 83.5% from 83.3% in January, and the 25 to 54 employment population ratio increased to 80.7% from 80.6% the previous month.
Average Hourly Wages
 The graph shows the nominal year-over-year change in "Average Hourly Earnings" for all private employees from the Current Employment Statistics (CES).
 Wage growth has trended down after peaking at 5.9% YoY in March 2022 and was at 4.3% YoY in February.
Part Time for Economic Reasons
 From the BLS report:
"The number of people employed part time for economic reasons, at 4.4 million, changed little in February. These individuals, who would have preferred full-time employment, were working part time because their hours had been reduced or they were unable to find full-time jobs."The number of persons working part time for economic reasons decreased in February to 4.36 million from 4.42 million in February. This is slightly above pre-pandemic levels.
These workers are included in the alternate measure of labor underutilization (U-6) that increased to 7.3% from 7.2% in the previous month. This is down from the record high in April 2020 of 23.0% and up from the lowest level on record (seasonally adjusted) in December 2022 (6.5%). (This series started in 1994). This measure is above the 7.0% level in February 2020 (pre-pandemic).
Unemployed over 26 Weeks
 This graph shows the number of workers unemployed for 27 weeks or more.
 According to the BLS, there are 1.203 million workers who have been unemployed for more than 26 weeks and still want a job, down from 1.277 million the previous month.
This is close to pre-pandemic levels.
Job Streak
| Headline Jobs, Top 10 Streaks | ||
|---|---|---|
| Year Ended | Streak, Months | |
| 1 | 2019 | 100 |
| 2 | 1990 | 48 |
| 3 | 2007 | 46 |
| 4 | 1979 | 45 |
| 5 | 20241 | 38 |
| 6 tie | 1943 | 33 |
| 6 tie | 1986 | 33 |
| 6 tie | 2000 | 33 |
| 9 | 1967 | 29 |
| 10 | 1995 | 25 |
| 1Currrent Streak | ||
Summary:
The headline monthly jobs number was above consensus expectations; however, December and January payrolls were revised down by 167,000 combined. The participation rate was unchanged, the employment population ratio decreased, and the unemployment rate was increased to 3.9%. Another solid report.


Walmart launches clever answer to Target’s new membership program


EyePoint poaches medical chief from Apellis; Sandoz CFO, longtime BioNTech exec to retire


Watch Live: President Biden Reminds Americans Just How Good They’ve Got It Thanks To Him


Catastrophic Risk: Investing and Business Implications


Redefining Poverty: Towards a Transpartisan Approach


Watch: President Biden Delivers The “Darkest, Most Un-American Speech Given By A President”


Is the biotech market rally real? Data suggest comeback in private, public markets


The Digest #187


People Who Received Ivermectin Were Better Off, Study Finds


Interest rates, the best it gets. It’s time to deploy cash
-

 Uncategorized2 weeks ago
All Of The Elements Are In Place For An Economic Crisis Of Staggering Proportions
-

 Uncategorized1 month ago
Cathie Wood sells a major tech stock (again)
-

 Uncategorized3 weeks ago
California Counties Could Be Forced To Pay $300 Million To Cover COVID-Era Program
-

 Uncategorized2 weeks ago
Apparel Retailer Express Moving Toward Bankruptcy
-

 Uncategorized3 weeks ago
Industrial Production Decreased 0.1% in January
-

 International1 month ago
War Delirium
-

 Uncategorized3 weeks ago
RFK Jr: The Wuhan Cover-Up & The Rise Of The Biowarfare-Industrial Complex
-

 Uncategorized3 weeks ago
GOP Efforts To Shore Up Election Security In Swing States Face Challenges