Uncategorized
Traffic levels hit a record high for a third consecutive quarter
Traffic levels hit a record high for a third consecutive quarter
Canada NewsWire
VICTORIA, BC, Feb. 17, 2023
VICTORIA, BC, Feb. 17, 2023 /CNW/ – Ferries released its results today for the three months ending December 31, 2022 and vehicle traffic le…
Share this:

Traffic levels hit a record high for a third consecutive quarter
Canada NewsWire
VICTORIA, BC, Feb. 17, 2023
VICTORIA, BC, Feb. 17, 2023 /CNW/ - Ferries released its results today for the three months ending December 31, 2022 and vehicle traffic levels hit a record high again as customers revert to pre-pandemic travel patterns.
During the third quarter ending December 31, 2022, 4.5 million passengers and 2.0 million vehicles travelled on the ferry system, an increase of 10 per cent and 3 per cent, respectively, compared to the same period in the prior year. Year-to-date, 17.4 million passengers and 7.5 million vehicles were carried, an increase of 23 per cent and 12 per cent, respectively, compared to the same period in the prior year.
Revenue for the third quarter ending December 31, 2022, inclusive of Safe Restart Funding, was $234.8 million, an increase of $12.6 million compared to the same period in the prior year. This increase is primarily a result of higher traffic volumes, net retail sales and fuel surcharges.
Quarterly results are affected by the seasonality of leisure travel patterns and the third quarter results reflect a seasonal reduction in traffic. This time is used by BC Ferries to perform upgrades and major maintenance and refits, as well as mandatory inspections on the majority of vessels.
Net loss for the third quarter ending December 31, 2022 was $22.7 million compared to a net loss of $1.6 million in the same quarter the previous year, primarily as a result of less Safe Restart Funding being applied in the quarter and higher operating costs.
During the nine months ending December 31, 2022, net earnings were $65.6 million compared to $83.0 million in the same period in the prior year, primarily as a result of higher traffic volumes and net retail sales, partially offset by less Safe Restart Funding being applied in the current year and higher operating expenses.
Third quarter operating expenses were $245.2 million compared to $209.5 million the same period last year. This increase is mainly due to an increased number of sailings, with corresponding higher labour costs, as well as higher fuel prices and maintenance expenses.
"While expenditures are up, it's important we continue to support our employees, who are the heart of our organization," said Jill Sharland, BC Ferries' interim President and CEO. "We're proud of their exceptional efforts to move record amounts of traffic and keep sailing cancellations to a minimum."
Continuous investment in infrastructure is critical to the operation of a safe, reliable and sustainable ferry system. Capital expenditures in the three and nine months ending December 31, 2022 totalled $37.3 million and $86.2 million, respectively, and included investments in existing ships, hardware upgrades and various other projects.
In December 2020, BC Ferries received $308.0 million from the Province as part of the provincial and federal governments' Safe Restart Funding program. All of the direct operating relief funding has now been applied with the remaining funding intended to offset the costs of discretionary sailings and to limit fare increases. In the three months ending December 31, 2022, BC Ferries recognized $2.1 million ($7.7 million year-to-date) of Safe Restart Funding compared to $19.2 million ($82.0 million year-to-date) in the same period in the prior year.
BC Ferries' full financial statements, including notes, and Management's Discussion and Analysis are filed on SEDAR and will be available at www.sedar.com.
Media Contact: BC Ferries, Media Relations Victoria: (250) 978-1267 | Customer Contact: Victoria: (250) 410-1465 Toll-free: 1-888-BCFERRY (1-888-223-3779) |
BC Ferries is one of the largest ferry operators in the world based on passengers transported annually and transportation infrastructure, and carried 17.9 million passengers and 8.5 million vehicles during the fiscal year ended March 31, 2022. BC Ferries provides frequent year-round ferry transportation services to the west coast of Canada on 25 routes, currently supported by 39 vessels and 47 terminals, and also manages other remote routes through contracts with independent operators.
FORWARD LOOKING STATEMENTS
This news release contains certain "forward looking statements". These statements relate to future events or future performance and reflect management's expectations regarding our growth, results of operations, performance, business prospects and opportunities, and industry performance and trends. They reflect management's current internal projections, expectations or beliefs, and are based on information currently available to management. Some of the factors that have been considered in formulating the assumptions upon which forward looking statements may be based include: traffic levels, the value of the Canadian Dollar, fuel costs, construction costs and timelines, the state of the economy, financial markets, demographics, tax changes, and our regulatory and contractual requirements.
Examples of forward looking statements included in this news release include statements with respect to: the impact and allocation of Safe Restart Funding, employee recruitment initiatives, and seasonal traffic patterns. In some cases, forward looking statements can be identified by terminology such as "may", "will", "should", "expect", "plan", "anticipate", "believe", "estimate", "predict", "potential", "continue" or the negative of these terms or other comparable terminology.
A number of factors could cause actual events or results to differ materially from the results discussed in the forward looking statements. In evaluating these statements, prospective investors should specifically consider the risks and uncertainties associated with, among other things: vendor performance, capital market access, interest rates, foreign currency, fuel prices, traffic volume, timelines for major capital projects, security, safety, environmental incidents, cyber security, legislative and regulatory changes, vessel repair facility limitations, tax changes, and Indigenous consultations.
Actual results may differ materially from any forward looking statement. Although management believes that the forward looking statements contained in this release are based upon reasonable assumptions, investors cannot be assured that actual results will be consistent with these forward looking statements. These forward looking statements are made as of the date of this release, and British Columbia Ferry Services Inc. assumes no obligation to update or revise them to reflect new events or circumstances except as may be required by applicable law.
NON-IFRS MEASURES
In addition to providing measures prepared in accordance with International Financial Reporting Standards (IFRS), we present certain financial measures that do not have any standardized meanings prescribed by IFRS and therefore are unlikely to be comparable to similar measures presented by other companies. These supplemental financial measures are provided to assist readers in determining our ability to generate cash from operations and improve the comparability of our results from one period to another. We believe these measures are useful in assessing operating performance of our ongoing business on an overall basis.
Significant events during and subsequent to the Third Quarter of Fiscal 2023 include the following:
General
- On October 4, 2022, BC Ferries announced that its Performance Term Six submission had been provided to the British Columbia Ferries Commissioner (the "Commissioner"). This begins the process of price cap setting by the Commissioner and negotiations with the Province regarding changes in core service levels and related ferry transportation fees for the four year period from April 1, 2024 through March 31, 2028 ("PT6"). The Commissioner establishes price caps for designated ferry route groups for the purpose of regulating fares. The Commissioner will make a preliminary determination on the PT6 price caps by March 31, 2023, and a final price caps determination by September 30, 2023. The Commissioner welcomes public input throughout this process. The submission document can be found at: www.bcferrycommission.ca.
- On November 1, 2022, due to sustained high fuel prices, fuel surcharges increased by 1.5 per cent on fares for all routes, bringing the fuel surcharge to 4 per cent on all routes. A fuel surcharge of 2.5 per cent had been in place on all routes since June 1, 2022.
- On November 21, 2022, S&P Global Ratings affirmed the company's long-term issuer credit and senior secured debt ratings of "AA-" with a stable trend.
- On December 9, 2022, BC Ferries and W̱JOȽEȽP (Tsartlip First Nation) entered into a relationship protocol agreement to establish a framework for collaborating on areas of mutual interest. Currently, BC Ferries operates eleven terminals within W̱JOȽEȽP (Tsartlip)'s traditional territory. The agreement outlines shared goals, is grounded in mutual respect and recognition, establishes lines of communication, and identifies topics for ongoing collaboration.
- On January 17, 2023, the company's board of directors appointed Nicolas Jimenez as President and Chief Executive Officer of BC Ferries, effective March 6, 2023. Over the last 20 years, Mr. Jimenez has held a number of senior roles at the Insurance Corporation of B.C., including as President and CEO for the last five years. Jill Sharland, who has been serving as Interim President and Chief Executive Officer, remains as Vice President and Chief Financial Officer of BC Ferries.
- On February 9, 2023, DBRS Morningstar confirmed BC Ferries' credit rating at A (high) with Stable trend.
Capital Assets
- On October 14, 2022, the Commissioner issued Order 22-02A, approving an application for a major capital project to redevelop the Fleet Maintenance Unit site, which is BC Ferries primary vessel maintenance and refit facility located at Deas Basin in Richmond, BC near the George Massey Tunnel.
- On January 18, 2023, the Island Nagalis and Island K'ulut'a began service on the Campbell River – Quadra Island route enabling round trip service to grow from up to 18 trips per day, to up to 29 trips per day, delivering more service at peak times and providing more capacity overall. These two hybrid-electric Island Class vessels replaced and allowed for the retirement of the 58-year old Powell River Queen.
SOURCE British Columbia Ferry Services Inc.
Uncategorized
Rising insurance costs, ample inventory create a unique market in Southwest Florida
Despite a slower housing market, agents are optimistic about what the spring and summer will bring
Share this:

Unlike many other metropolitan areas across the country, the housing market in Southwest Florida is comparably flush with for-sale inventory.
“I think one of the major trends we are seeing is that our overall inventory is up 60% year over year compared to 2023,” said PJ Smith, president of the Naples Area Board of Realtors and the broker-owner of Naples Golf to Gulf Real Estate. “We are seeing a healthy increase in inventory, which we really needed.”
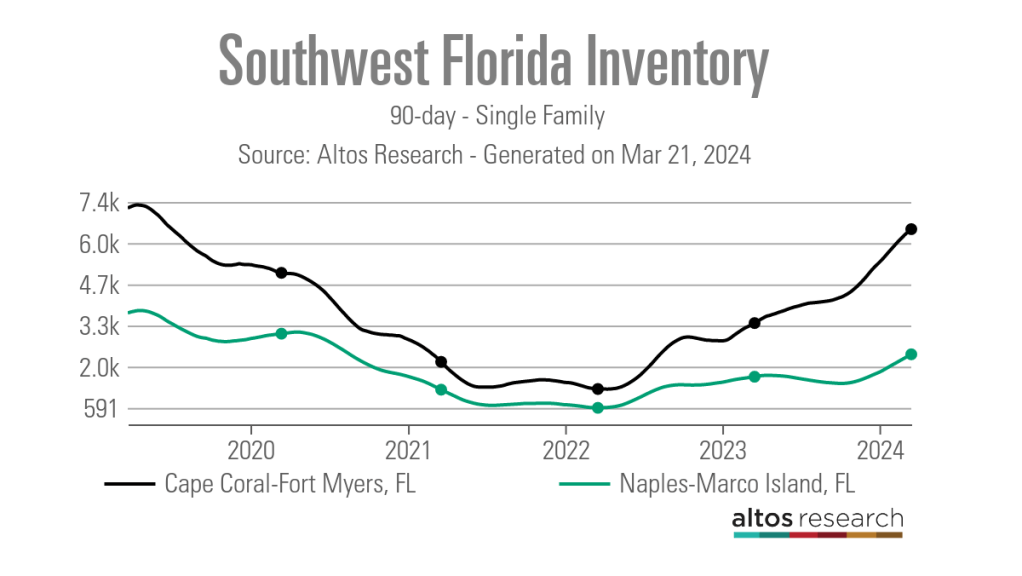
According to data from Altos Research as of March 15, the 90-day average number of single-family active listings in the Naples-Marco Island metro area was 2,362, up from 1,605 one year earlier but down from the 3,760 listings recorded in late March 2019 prior to the COVID-19 pandemic.
In the nearby metro area of Cape Coral-Fort Myers, active single-family inventory over the previous 90 days averaged 6,500 listings as of March 15, above its March 2020 level of 5,044 listings and approaching its March 2019 level of 7,243 listings.
Smith attributes the uptick in inventory to a bump in new listings. The 90-day average number of new listings as of mid-March 2024 was 170 in Naples-Marco Island, and 432 in Cape Coral-Fort Myers). There is also some pent-up desire to sell being released by a steadier interest rate environment and an overall slower market.

“Last year we were still adjusting from the effects of the pandemic market, but now the trends seem to be getting back to our baseline, which is more like our 2019 market,” Smith said. “Days on market is also trending back to what is more normal for our market as well.”
Data from Altos Research shows that the 90-day average median number of days on market in the Naples-Marco Island metro area was 70 days as of mid-March, up from a record low of 21 days in mid-May 2022.

While some properties are sitting on the market longer, Smith noted that those in good condition, priced well and in a desirable location are still selling quickly.
“I just sold a property after two days on the market,” Smith said. “We are still seeing properties go pending quickly and some with multiple offers.”
Local real estate professionals attribute the slower market to a variety of factors including higher home prices, which have remained steady despite the slowdown, higher interest rates, and rising costs for homeowners and flood insurance.
“Florida, like many places, is seeing the insurance piece of the component impacting people’s payments in a way that is making it hard to them to navigate the market,” said Cyndee Haydon, a Seminole-based agent for Future Home Realty agent.
According to an analysis by S&P Global, between 2018 and 2023, homeowners insurance rates in Florida have jumped by 43.2%. From 2022 to 2023 alone, rates rose 15%. And data from the Insurance Information Institute shows that Floridian homeowners are paying an average of nearly $6,000 a year in insurance, which is nearly three times what they paid in 2019. In comparison, the average U.S. homeowners insurance policy was roughly $1,700 in 2023.
Compounding the rising insurance costs is the fact that many insurers and reinsurers have made the decision to leave the state. These companies have cited the recent uptick in the number and severity of hurricanes and other weather-related disasters impacting the Sunshine State.
“Florida is seeing notably more hurricanes, so continuous years of poor experience, meaning losses for the insurance carriers, they have no choice but to increase those premiums,” said Sean Kent, the senior vice president of insurance at FirstService Financial.
“Additionally, there are just a few carriers that are willing to participate and insure some of those units, so accessibility to coverage has been reduced significantly.”
These rising costs are understandably impacting the ability or willingness of some buyers to purchase specific properties.
“Insurance is an expense that is expected — but nothing as substantial as we are seeing today,” said Sheryl Houck, a Tampa-based eXp Realty agent. “We are seeing contracts fall through during the due-diligence period because of the sticker shock on insurance costs, so that is definitely a problem.”
Due to this, real estate professionals are bringing insurance partners into their transactions much earlier than before.
“It is definitely a significant concern and issue,” Smith said. “What we recommend is that before you put a property under contract, you consult and get a quote so that you know what your potential insurance costs will be.”
In addition to navigating rising insurance costs with buyers, agents said they have also had to field questions from past clients about the rising premiums, who often need help in finding ways to lower their costs.
“We have instances where clients reach out and ask why they are seeing a 62% jump in their insurance, but we have been able to help them, whether that’s raising their deductible or putting them in touch with some of our other insurance contacts,” Houck said.
Despite rising insurance costs that make homeownership in these markets more costly, local real estate professionals don’t feel that this is behind the recent uptick in new listings.
“We’ve seen a lot of people move out of state to more affordable markets,” Houck said, ”but it is all relative because we are also seeing a lot of people moving in, because our market is more affordable than New York or California.”
Still, if premiums continue to rise, agents feel like this could become a bigger issue, especially for the area’s large population of retirees.
“When we look at people that are getting closer to retirement or have a fixed income, it becomes more and more of a concern,” Haydon said. “People are really being pinched with affordability.”
But while rising insurance costs are certainly a challenge for owners and buyers in Southwest Florida, Haydon said the slower housing market is good news for a lot of buyers.
“I have negotiated some of the most incredible deals for my buyers that are in the market right now that I have seen since the 2008 housing market crash,” Haydon said. “I had a buyer last month and the property was listed as $475,000, but with the necessary repairs, its value was $410,000 and we were able to negotiate an offer for $410,000.
“Normally, I would tell buyers that if they are 10% off the list price, they are dealing in different realities than the seller.”
Haydon said she has also recently had offers accepted with sale contingencies, closing cost coverages and a variety of other seller concessions.
Although things have slowed from the height of the frenzied post-pandemic market, local agents are optimistic about where the market is headed this spring and summer.
“It is very busy. Literally since Jan. 1, the spigot has turned on,” said Dyan Pithers, co-founder of The Pithers Group, a Tampa-based and Coldwell Banker Realty-brokered firm. “There are a lot of buyers in the market, and we are really focusing on showing value to sellers to get those listings out there so there are homes for buyers to purchase. It is going to be a really strong spring and summer.”
real estate housing market pandemic covid-19 interest ratesUncategorized
NBC says fans will have an enhanced viewing experience for the Summer Olympics
NBC says sports fans will have an enhanced viewing experience for the 2024 Summer Olympics.
Share this:


It's March Madness season — which alongside the Super Bowl — is one of the biggest sporting events in the U.S. But we're also just a few months away from the biggest sporting event in the entire world as the 2024 Summer Olympics Games in Paris start on July 26.
Olympics viewership has seen a pretty substantial dip in recent iterations, especially during the recent Tokyo Olympics that were delayed from 2020 to 2021 and marred by the Covid-19 pandemic.
NBC is paying a whopping $7.65 billion to broadcast the Olympics until 2032 — and while the game still has viewership in the tens of millions, it's clear that the network needs to find a way to bring back its audience to justify its investment.
Related: How you can attend the 2024 Paris Olympics in person
Over the last few days, the network has announced a few changes that could enhance the viewing experience in an effort to bring in more fans or have them watch the games for longer.
On Wednesday, Mar. 20, NBCUniversal (CMCSA) announced that it would be taking the "RedZone" style of programming made popular with the NFL and bring it to the Olympics. NBCUniversal's Peacock streaming service will offer the "Gold Zone," bringing a format that will move around the different events of Olympics during the most important times of an event.
The show will be hosted by Scott Hanson, Andrew Siciliano, Matt Iseman, and Akbar Gbajabiamila. Hanson and Siciliano are mainstays in the NFL Network's coverage of the football league, with the latter hosting the "RedZone Channel" on DirecTV for nearly two decades.
"Gold Zone" will be available on Peacock from 7 a.m. to 5 p.m. ET from July 26 to Aug. 10. NBCUniversal began streaming some events exclusively on Peacock during the last Summer Olympics — and it has continued to push its streaming platform for other live sporting events like a 2024 Wild Card NFL playoff game — so this move further shows the company's commitment to the service.
Shutterstock
Moreover, NBC also announced that it is going to have the Olympics Opening Ceremony on Friday, July 26 available for viewership at IMAX locations around the country.
This is the first time that the event will be presented on IMAX screens and will be available at 150 IMAX locations, according to the press release.
These two moves further showcase that NBC is looking to throw anything at the wall to maximize and unlock the value of the Olympics broadcasting rights.
Related: Caitlin Clark may already make the WNBA a lot more money before even going pro
gold pandemic covid-19Uncategorized
The New York Fed DSGE Model Forecast—March 2024
This post presents an update of the economic forecasts generated by the Federal Reserve Bank of New York’s dynamic stochastic general equilibrium (DSGE)…
Share this:


This post presents an update of the economic forecasts generated by the Federal Reserve Bank of New York’s dynamic stochastic general equilibrium (DSGE) model. We describe very briefly our forecast and its change since December 2023. As usual, we wish to remind our readers that the DSGE model forecast is not an official New York Fed forecast, but only an input to the Research staff’s overall forecasting process. For more information about the model and variables discussed here, see our DSGE model Q & A.
The New York Fed model forecasts use data released through 2023:Q4, augmented for 2024:Q1 with the median forecasts for real GDP growth and core PCE inflation from the January release of the Philadelphia Fed Survey of Professional Forecasters (SPF), as well as the yields on ten-year Treasury securities and Baa corporate bonds based on 2024:Q1 averages up to February 27. Starting in 2021:Q4, the expected federal funds rate (FFR) between one and six quarters into the future is restricted to equal the corresponding median point forecast from the latest available Survey of Primary Dealers (SPD) in the corresponding quarter. For the current projection, this is the January SPD.
Once again, the model was surprised by the strength of the economy. The model attributes this forecast error in part to higher-than-expected productivity, and in part to stimulative financial conditions. This positive surprise leads to a sizable upward revision of the output growth projections for 2024 relative to the December forecast (1.9 versus 1.2 percent). Growth projections for the remainder of the forecast horizon are not very different from what they were in December (0.7, 0.5, and 1.0 percent in 2025, 2026, and 2027 versus 0.7, 0.9, and 1.5 percent in December, respectively). Inflation projections are slightly lower in 2024 than they were in December (2.0 versus 2.2 percent), mostly because 2023:Q4 inflation surprised the model on the downside (although we should note that the model did not take into account the January core PCE readings, as they were not yet incorporated in the February SPF nowcast). The expected path for inflation is otherwise essentially the same as in December (2.0, 2.1, and 2.2 percent in 2025, 2026, and 2027 versus 2.0, 2.0, and 2.1 percent in December, respectively).
The short-run real natural rate of interest is expected to remain at roughly the same elevated level as projected in December for 2024 (2.1 percent versus 2.2 percent in December), declining to 1.9 percent in 2025, 1.6 percent in 2026, and 1.4 percent in 2027. The expected path of the policy rate is essentially unchanged relative to December. The model continues to see policy as being restrictive through the end of 2024, with the real federal funds rate remaining above the short-term natural rate of interest.
Forecast Comparison
| Forecast Period | 2024 | 2025 | 2026 | 2027 | ||||
|---|---|---|---|---|---|---|---|---|
| Date of Forecast | Mar 24 | Dec 23 | Mar 24 | Dec 23 | Mar 24 | Dec 23 | Mar 24 | Dec 23 |
| GDP growth (Q4/Q4) | 1.9 (-2.2, 6.1) | 1.2 (-3.8, 6.2) | 0.7 (-4.3, 5.6) | 0.7 (-4.3, 5.7) | 0.5 (-4.7, 5.8) | 0.9 (-4.5, 6.3) | 1.0 (-4.6, 6.5) | 1.5 (-4.1, 7.1) |
| Core PCE inflation (Q4/Q4) | 2.0 (1.5, 2.6) | 2.2 (1.5, 2.9) | 2.0 (1.1, 2.8) | 2.0 (1.1, 2.9) | 2.1 (1.1, 3.0) | 2.0 (1.0, 3.0) | 2.2 (1.1, 3.3) | 2.1 (1.0, 3.1) |
| Real natural rate of interest (Q4) | 2.1 (0.8, 3.4) | 2.2 (0.8, 3.6) | 1.9 (0.4, 3.3) | 1.8 (0.3, 3.3) | 1.6 (0.0, 3.2) | 1.6 (0.0, 3.2) | 1.4 (-0.3, 3.1) | 1.4 (-0.3, 3.1) |
Notes: This table lists the forecasts of output growth, core PCE inflation, and the real natural rate of interest from the March 2024 and December 2023 forecasts. The numbers outside parentheses are the mean forecasts, and the numbers in parentheses are the 68 percent bands.
Forecasts of Output Growth

Source: Authors’ calculations.
Notes: These two panels depict output growth. In the top panel, the black line indicates actual data and the red line shows the model forecasts. The shaded areas mark the uncertainty associated with our forecasts at 50, 60, 70, 80, and 90 percent probability intervals. In the bottom panel, the blue line shows the current forecast (quarter-to-quarter, annualized), and the gray line shows the December 2023 forecast.
Forecasts of Inflation

Source: Authors’ calculations.
Notes: These two panels depict core personal consumption expenditures (PCE) inflation. In the top panel, the black line indicates actual data and the red line shows the model forecasts. The shaded areas mark the uncertainty associated with our forecasts at 50, 60, 70, 80, and 90 percent probability intervals. In the bottom panel, the blue line shows the current forecast (quarter-to-quarter, annualized), and the gray line shows the December 2023 forecast.
Real Natural Rate of Interest

Source: Authors’ calculations.
Notes: The black line shows the model’s mean estimate of the real natural rate of interest; the red line shows the model forecast of the real natural rate. The shaded area marks the uncertainty associated with the forecasts at 50, 60, 70, 80, and 90 percent probability intervals.
Marco Del Negro is an economic research advisor in Macroeconomic and Monetary Studies in the Federal Reserve Bank of New York’s Research and Statistics Group.

Pranay Gundam is a research analyst in the Bank’s Research and Statistics Group.
Donggyu Lee is a research economist in Macroeconomic and Monetary Studies in the Federal Reserve Bank of New York’s Research and Statistics Group.

Ramya Nallamotu is a research analyst in the Bank’s Research and Statistics Group.

Brian Pacula is a research analyst in the Bank’s Research and Statistics Group.
How to cite this post:
Marco Del Negro, Pranay Gundam, Donggyu Lee, Ramya Nallamotu, and Brian Pacula, “The New York Fed DSGE Model Forecast—March 2024,” Federal Reserve Bank of New York Liberty Street Economics, March 22, 2024, https://libertystreeteconomics.newyorkfed.org/2024/03/the-new-york-fed-dsge-model-forecast-march-2024/.


Disclaimer
The views expressed in this post are those of the author(s) and do not necessarily reflect the position of the Federal Reserve Bank of New York or the Federal Reserve System. Any errors or omissions are the responsibility of the author(s).


After 625 Days, The Longest Yield Curve Inversion In History


NBC says fans will have an enhanced viewing experience for the Summer Olympics


Rising insurance costs, ample inventory create a unique market in Southwest Florida


The New York Fed DSGE Model Forecast—March 2024


Analyst revamps MicroStrategy stock price target after Bitcoin buy


The positive streak of news from initial and continuing jobless claims continues


Futures, Global Stocks Soar After Dovish Powell Greenlights Meltup


Signs of a thaw in the frozen existing homes market, but a very long way to go


Retirement Crisis Faces Government And Corporate Pensions


Did You Spot The Gorilla In The Fed’s Meeting Room?
-

 Spread & Containment1 week ago
IFM’s Hat Trick and Reflections On Option-To-Buy M&A
-

 Uncategorized4 weeks ago
All Of The Elements Are In Place For An Economic Crisis Of Staggering Proportions
-

 International2 weeks ago
EyePoint poaches medical chief from Apellis; Sandoz CFO, longtime BioNTech exec to retire
-

 Uncategorized1 month ago
California Counties Could Be Forced To Pay $300 Million To Cover COVID-Era Program
-

 Uncategorized4 weeks ago
Apparel Retailer Express Moving Toward Bankruptcy
-

 International2 weeks ago
Walmart launches clever answer to Target’s new membership program
-

 Uncategorized1 month ago
RFK Jr: The Wuhan Cover-Up & The Rise Of The Biowarfare-Industrial Complex
-

 Uncategorized1 month ago
GOP Efforts To Shore Up Election Security In Swing States Face Challenges