Uncategorized
The Unbearable Tightness of Peaking
Sandwichman came across a fascinating and disconcerting new dissertation, titled “Carbon Purgatory: The Dysfunctional Political Economy of Oil During the Renewable Energy Transition” by Gabe Eckhouse. An adaptation of one of the chapters, dealing with …
Share this:

Sandwichman came across a fascinating and disconcerting new dissertation, titled "Carbon Purgatory: The Dysfunctional Political Economy of Oil During the Renewable Energy Transition" by Gabe Eckhouse. An adaptation of one of the chapters, dealing with fracking, was published in Geoforum in 2021
As some of you may know, the specter of Peak Oil was allegedly "vanquished" by the invention of methods for extracting "unconventional oil" from shale formations (or "tight oil"), bitumen sands, and deep ocean drilling. A large part of that story was artificially low interest rates in response to the stock market crash of 2008 and subsequent recession.
What Eckhouse's dissertation and article explain is the flexibility advantage that fracking provides because the investment required for a well is two orders of magnitude less than for exploiting a conventional field and the payback time is much shorter. The downside is that the cost per barrel of the oil is much higher. Until now loose monetary policy has buffered that cost differential.
The strategic advantage of fracking, combined with the volatility of oil prices over the past two decades and uncertainty about possible future government decarbonization policies (what oil industry figures are ironically calling "peak oil demand") are making large, long-term investments in conventional oil extraction -- investments of the order of, say, $20 trillion over the next quarter century -- less attractive.
Although the latter might sound like a good thing, what it implies is a full-blown energy crisis occurring much earlier than any purported transition to renewable non-carbon energy sources. I wouldn't be surprised to see reactionary politicians and media agitate a "populist" movement to scapegoat "climate-woke" activists and scientists as saboteurs responsible for "cancelling" long-term investment in a cheap oil economy.
I had forgotten the oil price rise of 2007-08 when a barrel of West Texas Intermediate crude rose from $85 in January 2007 to $125 in November to $156 in April 2008 to $190 in June. Now I remember my sense of awe at the time and dread that something really, really bad was soon going to happen to "the economy." But then nothing happened. Nothing, that is, but the collapse of Bear Stearns and Lehman Brothers, a stock market crash, emergency bank bailouts, and subsequent central bank monetary policy of low, low interest rates. But "the fundamentals were sound."
It scrambles my brain trying to distinguish cause from effect. Did the ultra-low post 2008 crash low interest rates incidentally drive the subsequent fracking boom? Or was specifically a fracking boom one of the core objectives of the low interest rate regime?
Whither "peak oil"? According to Laherrère, Hall, and Bentley in How much oil remains for the world to produce? (2022) "the end of cheap oil" did not go away when the oil can was kicked down the road:
Our results suggest that global production of conventional oil, which has been at a resource-limited plateau since 2005, is now in decline, or will decline soon. This switch from production plateau to decline is expected to place increasing strains on the global economy, exacerbated by the generally lower energy returns of the non-conventional oils and other liquids on which the global economy is increasingly dependent.
If we add to conventional oil production that of light-tight (‘fracked’) oil, our analysis suggests that the corresponding resource-limited production peak will occur soon, between perhaps 2022 to 2025.
Including "all liquids" pushes that horizon out to 2040. In short, we overshot peak oil by a couple decades with the aid of loose money and tight oil, with a little additional help from the Covid pandemic. Those of us with a memory longer than the news cycle may recall that the current round of interest rate hikes by the Fed was initiated in response to inflation, which reached a 40-year high in June of last year due to record gasoline prices. Lower demand for gasoline brings down gas prices while higher interest rates may discourage new investment in fracking posing the specter of an oil supply crunch a couple of years down the road.
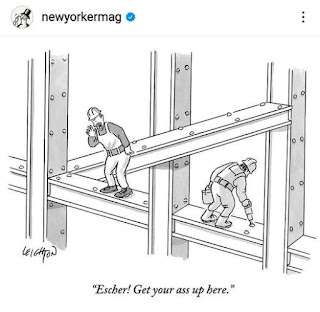
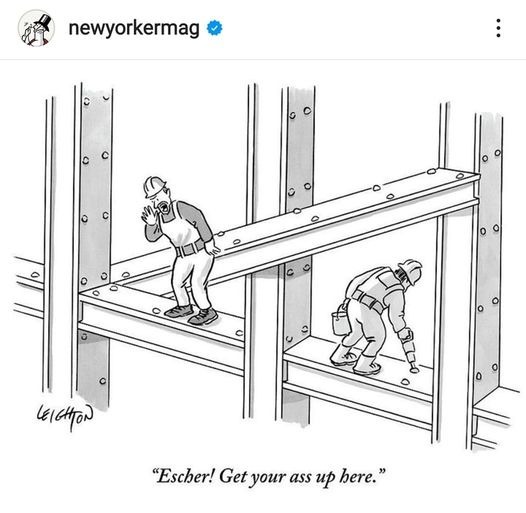
The cartoon below illustrates the loose money/tight oil -- tight money/peak oil dilemma:Uncategorized
One city held a mass passport-getting event
A New Orleans congressman organized a way for people to apply for their passports en masse.
Share this:


While the number of Americans who do not have a passport has dropped steadily from more than 80% in 1990 to just over 50% now, a lack of knowledge around passport requirements still keeps a significant portion of the population away from international travel.
Over the four years that passed since the start of covid-19, passport offices have also been dealing with significant backlog due to the high numbers of people who were looking to get a passport post-pandemic.
Related: Here is why it is (still) taking forever to get a passport
To deal with these concurrent issues, the U.S. State Department recently held a mass passport-getting event in the city of New Orleans. Called the "Passport Acceptance Event," the gathering was held at a local auditorium and invited residents of Louisiana’s 2nd Congressional District to complete a passport application on-site with the help of staff and government workers.
'Come apply for your passport, no appointment is required'
"Hey #LA02," Rep. Troy A. Carter Sr. (D-LA), whose office co-hosted the event alongside the city of New Orleans, wrote to his followers on Instagram (META) . "My office is providing passport services at our #PassportAcceptance event. Come apply for your passport, no appointment is required."
More Travel:
- A new travel term is taking over the internet (and reaching airlines and hotels)
- The 10 best airline stocks to buy now
- Airlines see a new kind of traveler at the front of the plane
The event was held on March 14 from 10 a.m. to 1 p.m. While it was designed for those who are already eligible for U.S. citizenship rather than as a way to help non-citizens with immigration questions, it helped those completing the application for the first time fill out forms and make sure they have the photographs and identity documents they need. The passport offices in New Orleans where one would normally have to bring already-completed forms have also been dealing with lines and would require one to book spots weeks in advance.
These are the countries with the highest-ranking passports in 2024
According to Carter Sr.'s communications team, those who submitted their passport application at the event also received expedited processing of two to three weeks (according to the State Department's website, times for regular processing are currently six to eight weeks).
While Carter Sr.'s office has not released the numbers of people who applied for a passport on March 14, photos from the event show that many took advantage of the opportunity to apply for a passport in a group setting and get expedited processing.
Every couple of months, a new ranking agency puts together a list of the most and least powerful passports in the world based on factors such as visa-free travel and opportunities for cross-border business.
In January, global citizenship and financial advisory firm Arton Capital identified United Arab Emirates as having the most powerful passport in 2024. While the United States topped the list of one such ranking in 2014, worsening relations with a number of countries as well as stricter immigration rules even as other countries have taken strides to create opportunities for investors and digital nomads caused the American passport to slip in recent years.
A UAE passport grants holders visa-free or visa-on-arrival access to 180 of the world’s 198 countries (this calculation includes disputed territories such as Kosovo and Western Sahara) while Americans currently have the same access to 151 countries.
stocks pandemic covid-19 grantsUncategorized
Fast-food chain closes restaurants after Chapter 11 bankruptcy
Several major fast-food chains recently have struggled to keep restaurants open.
Share this:


Competition in the fast-food space has been brutal as operators deal with inflation, consumers who are worried about the economy and their jobs and, in recent months, the falling cost of eating at home.
Add in that many fast-food chains took on more debt during the covid pandemic and that labor costs are rising, and you have a perfect storm of problems.
It's a situation where Restaurant Brands International (QSR) has suffered as much as any company.
Related: Wendy's menu drops a fan favorite item, adds something new
Three major Burger King franchise operators filed for bankruptcy in 2023, and the chain saw hundreds of stores close. It also saw multiple Popeyes franchisees move into bankruptcy, with dozens of locations closing.
RBI also stepped in and purchased one of its key franchisees.
"Carrols is the largest Burger King franchisee in the United States today, operating 1,022 Burger King restaurants in 23 states that generated approximately $1.8 billion of system sales during the 12 months ended Sept. 30, 2023," RBI said in a news release. Carrols also owns and operates 60 Popeyes restaurants in six states."
The multichain company made the move after two of its large franchisees, Premier Kings and Meridian, saw multiple locations not purchased when they reached auction after Chapter 11 bankruptcy filings. In that case, RBI bought select locations but allowed others to close.
Image source: Chen Jianli/Xinhua via Getty
Another fast-food chain faces bankruptcy problems
Bojangles may not be as big a name as Burger King or Popeye's, but it's a popular chain with more than 800 restaurants in eight states.
"Bojangles is a Carolina-born restaurant chain specializing in craveable Southern chicken, biscuits and tea made fresh daily from real recipes, and with a friendly smile," the chain says on its website. "Founded in 1977 as a single location in Charlotte, our beloved brand continues to grow nationwide."
Like RBI, Bojangles uses a franchise model, which makes it dependent on the financial health of its operators. The company ultimately saw all its Maryland locations close due to the financial situation of one of its franchisees.
Unlike. RBI, Bojangles is not public — it was taken private by Durational Capital Management LP and Jordan Co. in 2018 — which means the company does not disclose its financial information to the public.
That makes it hard to know whether overall softness for the brand contributed to the chain seeing its five Maryland locations after a Chapter 11 bankruptcy filing.
Bojangles has a messy bankruptcy situation
Even though the locations still appear on the Bojangles website, they have been shuttered since late 2023. The locations were operated by Salim Kakakhail and Yavir Akbar Durranni. The partners operated under a variety of LLCs, including ABS Network, according to local news channel WUSA9.
The station reported that the owners face a state investigation over complaints of wage theft and fraudulent W2s. In November Durranni and ABS Network filed for bankruptcy in New Jersey, WUSA9 reported.
"Not only do former employees say these men owe them money, WUSA9 learned the former owners owe the state, too, and have over $69,000 in back property taxes."
Former employees also say that the restaurant would regularly purchase fried chicken from Popeyes and Safeway when it ran out in their stores, the station reported.
Bojangles sent the station a comment on the situation.
"The franchisee is no longer in the Bojangles system," the company said. "However, it is important to note in your coverage that franchisees are independent business owners who are licensed to operate a brand but have autonomy over many aspects of their business, including hiring employees and payroll responsibilities."
Kakakhail and Durranni did not respond to multiple requests for comment from WUSA9.
bankruptcy pandemicUncategorized
Industrial Production Increased 0.1% in February
From the Fed: Industrial Production and Capacity Utilization
Industrial production edged up 0.1 percent in February after declining 0.5 percent in January. In February, the output of manufacturing rose 0.8 percent and the index for mining climbed 2.2 p…
Share this:


Industrial production edged up 0.1 percent in February after declining 0.5 percent in January. In February, the output of manufacturing rose 0.8 percent and the index for mining climbed 2.2 percent. Both gains partly reflected recoveries from weather-related declines in January. The index for utilities fell 7.5 percent in February because of warmer-than-typical temperatures. At 102.3 percent of its 2017 average, total industrial production in February was 0.2 percent below its year-earlier level. Capacity utilization for the industrial sector remained at 78.3 percent in February, a rate that is 1.3 percentage points below its long-run (1972–2023) average.Click on graph for larger image.
emphasis added
This graph shows Capacity Utilization. This series is up from the record low set in April 2020, and above the level in February 2020 (pre-pandemic).
Capacity utilization at 78.3% is 1.3% below the average from 1972 to 2022. This was below consensus expectations.
Note: y-axis doesn't start at zero to better show the change.
 The second graph shows industrial production since 1967.
Industrial production increased to 102.3. This is above the pre-pandemic level.
Industrial production was above consensus expectations.


Key shipping company files for Chapter 11 bankruptcy


These Cities Have The Highest (And Lowest) Share Of Unaffordable Neighborhoods In 2024


The Question You Should Ask Whenever You’re Wrong


Tight inventory and frustrated buyers challenge agents in Virginia


Futures Rise To New Record High Ahead Of Data Deluge


Walmart and Target make key self-checkout changes to fight theft


Industrial Production Increased 0.1% in February


Your financial plan may be riskier without bitcoin
Key shipping company files Chapter 11 bankruptcy


One city held a mass passport-getting event
-

 Uncategorized3 weeks ago
All Of The Elements Are In Place For An Economic Crisis Of Staggering Proportions
-

 International1 week ago
EyePoint poaches medical chief from Apellis; Sandoz CFO, longtime BioNTech exec to retire
-

 Uncategorized4 weeks ago
California Counties Could Be Forced To Pay $300 Million To Cover COVID-Era Program
-

 Uncategorized3 weeks ago
Apparel Retailer Express Moving Toward Bankruptcy
-

 Uncategorized4 weeks ago
Industrial Production Decreased 0.1% in January
-

 International1 week ago
Walmart launches clever answer to Target’s new membership program
-

 Spread & Containment3 days ago
IFM’s Hat Trick and Reflections On Option-To-Buy M&A
-

 Uncategorized4 weeks ago
RFK Jr: The Wuhan Cover-Up & The Rise Of The Biowarfare-Industrial Complex