Uncategorized
US Job Openings Far Lower Than Reported By Department Of Labor, UBS Finds
US Job Openings Far Lower Than Reported By Department Of Labor, UBS Finds
When it comes to labor market data (or rather "data"), Biden’s labor…
Share this:

When it comes to labor market data (or rather "data"), Biden's labor department is a study in contrasts (and pats on shoulders). One day we get a contraction in PMI employment (both manufacturing and services), the other we get a major beat in employment. Then, one day the Household survey shows a plunge in employment (in fact, there has almost been no employment gain in the past 9 months) and a record in multiple jobholders and part-time workers, and the same day the Establishment Survey signals a spike in payrolls (mostly among waiters and bartenders). Or the day the JOLTS report shows an unexpected jump in job openings even as actual hiring slides to a two year low. Or the straw the breaks the latest trend in the labor market's back, is when the jobs report finally cracks and shows the fewest jobs added in over a year, and yet initial jobless claims tumble and reverse all recent increases despite daily news of mass layoffs across all tech companies, as the relentless barrage of conflicting data out of the Bureau of Labor Statistics (which is the principal "fact-finding" agency for the Biden Administration and a core pillar of the Dept of Labor) just won't stop, almost as if to make a very political point.
But while one can certainly appreciate Biden's desire to paint the glass of US jobs as always half full, reality is starting to make a mockery of the president's gaslighting ambitions, as one by one core pillars of the administration's "strong jobs" fabulation collapse. First it was the Philadelphia Fed shockingly stating that contrary to the BLS "goalseeking" of 1.1 million jobs in Q2 2022, the US actually only added a paltry 10,000 jobs (just as the Fed unleashed an unprecedented spree of 75bps rate hikes).
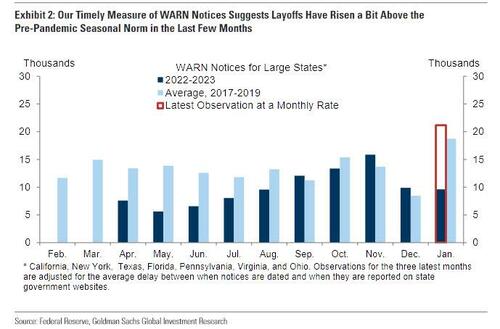
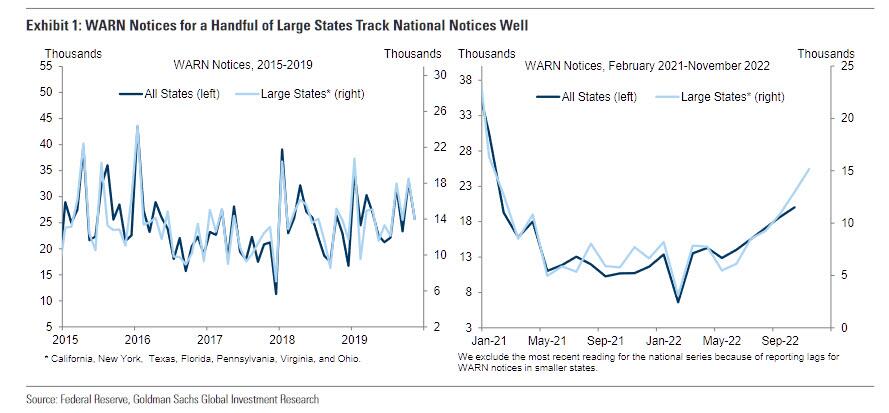
Then, it was Goldman's turn to make a mockery of the "curiously" low initial jobless claims, by comparing them to directly reported state-level WARN notices (mandatory under the Worker Adjustment and Retraining Notification (WARN) Act) which no low-level bureaucrat and Biden lackey can "seasonally adjust" because there they are: cold, hard, fact, immutable and truly representative of the underlying economic truth, and what they show is that - as the Goldman chart below confirms - layoffs are rising far faster than what the DOL's Initial Claims indicates.
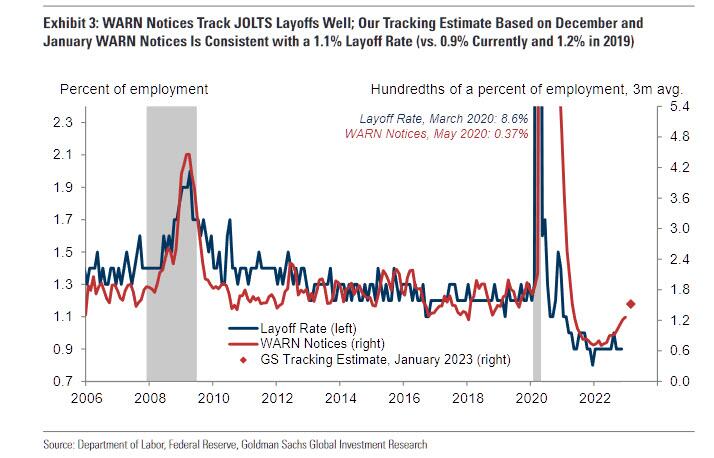
More importantly, Goldman also found that WARN notices also track the JOLTS layoff rate: WARN notice counts remained elevated in late 2020 even as the layoff rate declined, but this likely reflects unusual reporting delays during the pandemic and the exclusion of layoffs at closing establishments in the JOLTS survey, which WARN notices capture provided firms remain in business. Not surprisingly, Goldman's tracking estimate based on December and January WARN notices for the large states covered not only shows that the recent drop in initial claims is unlikely, but that it is also consistent with a layoff rate of around 1.1%, higher than the 0.9% in the November JOLTS report.
And now, another core pillar of the US labor market is being dismantled, and it has to do with the Fed's favorite labor market indicator: the JOLTS report of job openings.
As UBS economist Pablo Villaneuva writes in a recent report by the bank's Evidence Lab group, Job openings in the JOLTS survey have not declined much since the March peak. Indeed, the BLS reports that openings were only 12% below the March 2022 peak in November and remain 48% above the pre-pandemic, 2019 average. This slight move downward has, as we noted recently, led to only a small decline in the vacancies-to-unemployment ratio, from 1.99 in March to 1.74 in November, still well above the 2019 average of 1.19.

Of course, such a high level of job openings is alarming to the Fed for the simple reason that it means Powell has failed at his mission at cooling off what appears to be a red hot jobs market; no wonder the Fed Chair has frequently flagged the high level of job openings as a sign of ongoing strength in the labor market. The bottom line, as UBS notes, is that "the BLS measure, although it has declined, remains historically high."
However, as in the abovementioned case of unexpectedly low jobless claims, there may be more here than meets the eye. According to Villanueva, "a range of other measures of job openings suggest normalization in the labor market—softening much more convincingly, often to pre-pandemic levels" - translation: whether on purpose or accidentally, the BLS is fabricating data. Also, the UBS economist flags, job openings are not a great indicator of current labor market conditions—they lagged the last two downturns in the labor market.
So what's the real story?
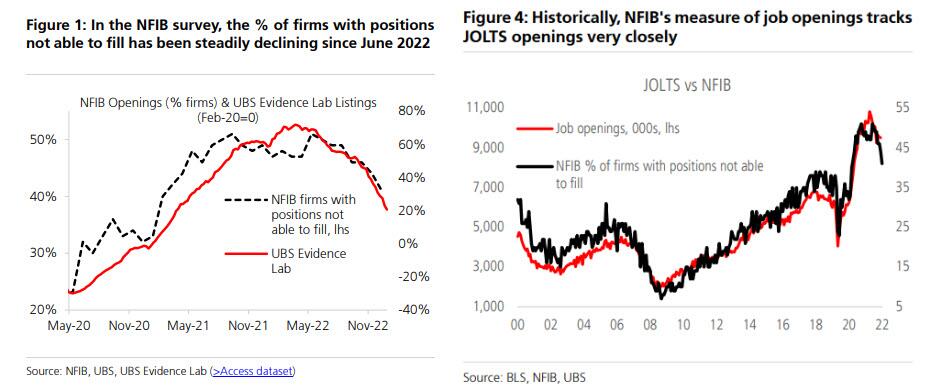
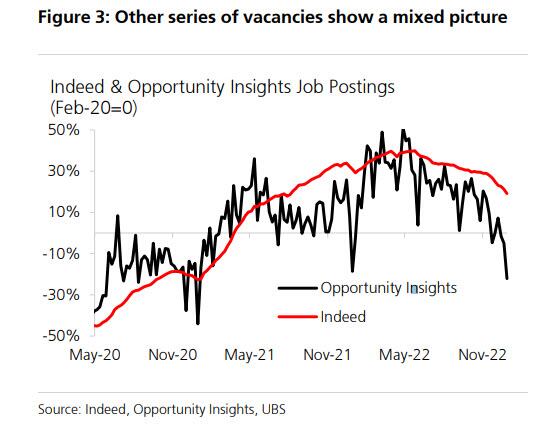
Well, as usual there is BLS "data" and everyone else... and as UBS cautions, other measures of openings tell a very different story: "Our UBS Evidence Lab data on job listings is weekly and more timely than the BLS series. The last datapoint is for the week of December 31. It shows openings down 30% from the March 2022 peak and only 25% higher than the 2019 average."

While BLS bureaucrats and Biden sycophants can argue UBS data is inaccurate, other longer dated series also indicate weaker openings. Take for example the NFIB Small Business Survey includes labor market measures that have correlated strongly with the JOLTS data over time but have weakened more sharply than the JOLTS measure in recent months. The percentage of small firms unable to fill open positions has a correlation of 0.95 with JOLTS openings since 2000. This series has declined 20% relative to the peak in May 2022 and is only 13% above the 2019 average. The NFIB series on percentage of firms with few or no qualified applicants tells a similar story.
Finally, the "Opportunity Insights" measure of openings (see here) is also below pre-pandemic levels.
So what's going on here?
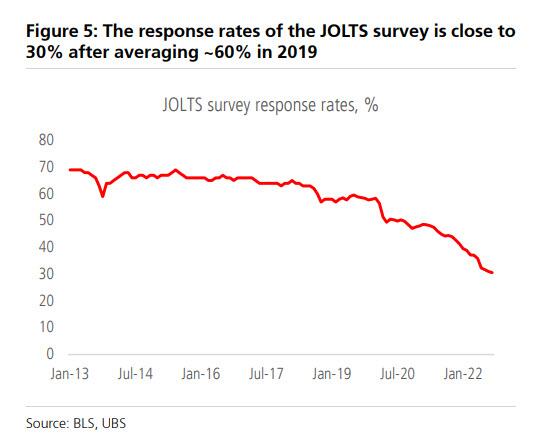
As the UBS economist puts it, "in short, other surveys of job openings generally suggest that the BLS measure may be overstating labor market tightness. One reason to think the accuracy of the JOLTS data may have declined is that the sample shrank noticeably at the start of the pandemic. In 2019, the survey response rate was 60%. In December, it was 30%."
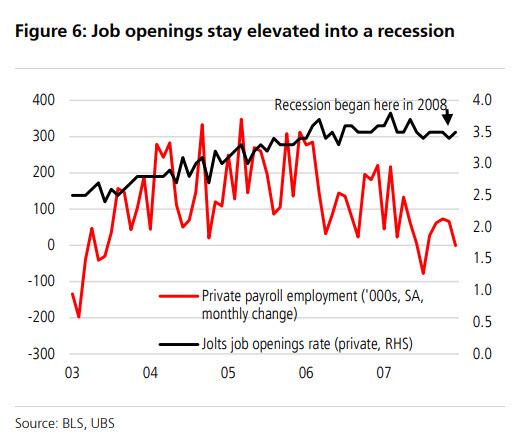
Or perhaps it's not gross BLS incompetence (or propaganda): maybe it's just a data quirk at key economic inflection points. As UBS observed in August, job openings tend to lag other labor market indicators. Ahead of the 2001 recession, the private sector job openings rate was still rising as private employment peaked and started printing negative. Again in 2007, as job openings were peaking, payroll employment in the revised data had slowed considerably, and job openings remained near their peak as employment was beginning to contract outright.
Whatever the reason for the discrepancy in this latest labor series, the bigger picture is getting troubling.
- We already knew that the employment as measured by the Household survey has been flat since March even as the Establishment survey signaled 2.7 million job gains since then. Shortly thereafter the Philadelphia Fed found that contrary to the BLS "goalseeking" of 1.1 million jobs in Q2 2022, the US actually only added a paltry 10,000 jobs in the second quarter of 2022. As such, the validity and credibility of the US nonfarm payrolls report is suspect at best.
- A few weeks ago, Goldman also put the credibility of DOL's weekly jobless claims report under question, when it found that initial claims as measured at the state level without seasonal adjustments or other "fudge factors" were running far higher than what the DOL reports every week.
- And now, we can also stick a fork in the JOLTS report, whose accuracy has just been steamrolled by UBS with its finding that job openings - a critical component of the US labor market and the Fed's preferred labor market indiator - are far lower than what the Dept of Labor suggests.
Bottom line: while it is obvious why the Biden admin would try hard to put as much lipstick as it can on US jobs data, the same data when measured with alternative measures shows a far uglier picture, one of a US labor market on the verge of cracking and hardly one meriting consistent rate hikes by the Fed.
Which, considering that in less than 24 hours the Fed will hike rates by another 25 bps, is extremely important, and we wish that we weren't the only media outlet to lay out the facts as the negative impact of continued policy error and tightening by the Fed will impact tens of millions Americans, not to mention the continued errors - whether premeditated or accidental - by the US Department of Labor. Alas, as so often happens, since nobody else in the "independent US press" is willing to touch the story of manipulated jobs data with a ten foot pole, it is again up to us to explain what is really going on.
The full UBS report available to pro subs.
Uncategorized
February Employment Situation
By Paul Gomme and Peter Rupert The establishment data from the BLS showed a 275,000 increase in payroll employment for February, outpacing the 230,000…
Share this:


By Paul Gomme and Peter Rupert
The establishment data from the BLS showed a 275,000 increase in payroll employment for February, outpacing the 230,000 average over the previous 12 months. The payroll data for January and December were revised down by a total of 167,000. The private sector added 223,000 new jobs, the largest gain since May of last year.

Temporary help services employment continues a steep decline after a sharp post-pandemic rise.


Average hours of work increased from 34.2 to 34.3. The increase, along with the 223,000 private employment increase led to a hefty increase in total hours of 5.6% at an annualized rate, also the largest increase since May of last year.

The establishment report, once again, beat “expectations;” the WSJ survey of economists was 198,000. Other than the downward revisions, mentioned above, another bit of negative news was a smallish increase in wage growth, from $34.52 to $34.57.

The household survey shows that the labor force increased 150,000, a drop in employment of 184,000 and an increase in the number of unemployed persons of 334,000. The labor force participation rate held steady at 62.5, the employment to population ratio decreased from 60.2 to 60.1 and the unemployment rate increased from 3.66 to 3.86. Remember that the unemployment rate is the number of unemployed relative to the labor force (the number employed plus the number unemployed). Consequently, the unemployment rate can go up if the number of unemployed rises holding fixed the labor force, or if the labor force shrinks holding the number unemployed unchanged. An increase in the unemployment rate is not necessarily a bad thing: it may reflect a strong labor market drawing “marginally attached” individuals from outside the labor force. Indeed, there was a 96,000 decline in those workers.


Earlier in the week, the BLS announced JOLTS (Job Openings and Labor Turnover Survey) data for January. There isn’t much to report here as the job openings changed little at 8.9 million, the number of hires and total separations were little changed at 5.7 million and 5.3 million, respectively.

As has been the case for the last couple of years, the number of job openings remains higher than the number of unemployed persons.

Also earlier in the week the BLS announced that productivity increased 3.2% in the 4th quarter with output rising 3.5% and hours of work rising 0.3%.

The bottom line is that the labor market continues its surprisingly (to some) strong performance, once again proving stronger than many had expected. This strength makes it difficult to justify any interest rate cuts soon, particularly given the recent inflation spike.
unemployment pandemic unemploymentUncategorized
Mortgage rates fall as labor market normalizes
Jobless claims show an expanding economy. We will only be in a recession once jobless claims exceed 323,000 on a four-week moving average.
Share this:


Everyone was waiting to see if this week’s jobs report would send mortgage rates higher, which is what happened last month. Instead, the 10-year yield had a muted response after the headline number beat estimates, but we have negative job revisions from previous months. The Federal Reserve’s fear of wage growth spiraling out of control hasn’t materialized for over two years now and the unemployment rate ticked up to 3.9%. For now, we can say the labor market isn’t tight anymore, but it’s also not breaking.
The key labor data line in this expansion is the weekly jobless claims report. Jobless claims show an expanding economy that has not lost jobs yet. We will only be in a recession once jobless claims exceed 323,000 on a four-week moving average.
From the Fed: In the week ended March 2, initial claims for unemployment insurance benefits were flat, at 217,000. The four-week moving average declined slightly by 750, to 212,250
Below is an explanation of how we got here with the labor market, which all started during COVID-19.
1. I wrote the COVID-19 recovery model on April 7, 2020, and retired it on Dec. 9, 2020. By that time, the upfront recovery phase was done, and I needed to model out when we would get the jobs lost back.
2. Early in the labor market recovery, when we saw weaker job reports, I doubled and tripled down on my assertion that job openings would get to 10 million in this recovery. Job openings rose as high as to 12 million and are currently over 9 million. Even with the massive miss on a job report in May 2021, I didn’t waver.
Currently, the jobs openings, quit percentage and hires data are below pre-COVID-19 levels, which means the labor market isn’t as tight as it once was, and this is why the employment cost index has been slowing data to move along the quits percentage.

3. I wrote that we should get back all the jobs lost to COVID-19 by September of 2022. At the time this would be a speedy labor market recovery, and it happened on schedule, too
Total employment data
4. This is the key one for right now: If COVID-19 hadn’t happened, we would have between 157 million and 159 million jobs today, which would have been in line with the job growth rate in February 2020. Today, we are at 157,808,000. This is important because job growth should be cooling down now. We are more in line with where the labor market should be when averaging 140K-165K monthly. So for now, the fact that we aren’t trending between 140K-165K means we still have a bit more recovery kick left before we get down to those levels.

From BLS: Total nonfarm payroll employment rose by 275,000 in February, and the unemployment rate increased to 3.9 percent, the U.S. Bureau of Labor Statistics reported today. Job gains occurred in health care, in government, in food services and drinking places, in social assistance, and in transportation and warehousing.
Here are the jobs that were created and lost in the previous month:

In this jobs report, the unemployment rate for education levels looks like this:
- Less than a high school diploma: 6.1%
- High school graduate and no college: 4.2%
- Some college or associate degree: 3.1%
- Bachelor’s degree or higher: 2.2%

Today’s report has continued the trend of the labor data beating my expectations, only because I am looking for the jobs data to slow down to a level of 140K-165K, which hasn’t happened yet. I wouldn’t categorize the labor market as being tight anymore because of the quits ratio and the hires data in the job openings report. This also shows itself in the employment cost index as well. These are key data lines for the Fed and the reason we are going to see three rate cuts this year.
recession unemployment covid-19 fed federal reserve mortgage rates recession recovery unemploymentUncategorized
Inside The Most Ridiculous Jobs Report In History: Record 1.2 Million Immigrant Jobs Added In One Month
Inside The Most Ridiculous Jobs Report In History: Record 1.2 Million Immigrant Jobs Added In One Month
Last month we though that the January…
Share this:


Last month we though that the January jobs report was the "most ridiculous in recent history" but, boy, were we wrong because this morning the Biden department of goalseeked propaganda (aka BLS) published the February jobs report, and holy crap was that something else. Even Goebbels would blush.
What happened? Let's take a closer look.
On the surface, it was (almost) another blockbuster jobs report, certainly one which nobody expected, or rather just one bank out of 76 expected. Starting at the top, the BLS reported that in February the US unexpectedly added 275K jobs, with just one research analyst (from Dai-Ichi Research) expecting a higher number.
Some context: after last month's record 4-sigma beat, today's print was "only" 3 sigma higher than estimates. Needless to say, two multiple sigma beats in a row used to only happen in the USSR... and now in the US, apparently.

Before we go any further, a quick note on what last month we said was "the most ridiculous jobs report in recent history": it appears the BLS read our comments and decided to stop beclowing itself. It did that by slashing last month's ridiculous print by over a third, and revising what was originally reported as a massive 353K beat to just 229K, a 124K revision, which was the biggest one-month negative revision in two years!

Of course, that does not mean that this month's jobs print won't be revised lower: it will be, and not just that month but every other month until the November election because that's the only tool left in the Biden admin's box: pretend the economic and jobs are strong, then revise them sharply lower the next month, something we pointed out first last summer and which has not failed to disappoint once.
In the past month the Biden department of goalseeking stuff higher before revising it lower, has revised the following data sharply lower:
— zerohedge (@zerohedge) August 30, 2023
- Jobs
- JOLTS
- New Home sales
- Housing Starts and Permits
- Industrial Production
- PCE and core PCE
To be fair, not every aspect of the jobs report was stellar (after all, the BLS had to give it some vague credibility). Take the unemployment rate, after flatlining between 3.4% and 3.8% for two years - and thus denying expectations from Sahm's Rule that a recession may have already started - in February the unemployment rate unexpectedly jumped to 3.9%, the highest since February 2022 (with Black unemployment spiking by 0.3% to 5.6%, an indicator which the Biden admin will quickly slam as widespread economic racism or something).

And then there were average hourly earnings, which after surging 0.6% MoM in January (since revised to 0.5%) and spooking markets that wage growth is so hot, the Fed will have no choice but to delay cuts, in February the number tumbled to just 0.1%, the lowest in two years...

... for one simple reason: last month's average wage surge had nothing to do with actual wages, and everything to do with the BLS estimate of hours worked (which is the denominator in the average wage calculation) which last month tumbled to just 34.1 (we were led to believe) the lowest since the covid pandemic...

... but has since been revised higher while the February print rose even more, to 34.3, hence why the latest average wage data was once again a product not of wages going up, but of how long Americans worked in any weekly period, in this case higher from 34.1 to 34.3, an increase which has a major impact on the average calculation.

While the above data points were examples of some latent weakness in the latest report, perhaps meant to give it a sheen of veracity, it was everything else in the report that was a problem starting with the BLS's latest choice of seasonal adjustments (after last month's wholesale revision), which have gone from merely laughable to full clownshow, as the following comparison between the monthly change in BLS and ADP payrolls shows. The trend is clear: the Biden admin numbers are now clearly rising even as the impartial ADP (which directly logs employment numbers at the company level and is far more accurate), shows an accelerating slowdown.

But it's more than just the Biden admin hanging its "success" on seasonal adjustments: when one digs deeper inside the jobs report, all sorts of ugly things emerge... such as the growing unprecedented divergence between the Establishment (payrolls) survey and much more accurate Household (actual employment) survey. To wit, while in January the BLS claims 275K payrolls were added, the Household survey found that the number of actually employed workers dropped for the third straight month (and 4 in the past 5), this time by 184K (from 161.152K to 160.968K).

This means that while the Payrolls series hits new all time highs every month since December 2020 (when according to the BLS the US had its last month of payrolls losses), the level of Employment has not budged in the past year. Worse, as shown in the chart below, such a gaping divergence has opened between the two series in the past 4 years, that the number of Employed workers would need to soar by 9 million (!) to catch up to what Payrolls claims is the employment situation.

There's more: shifting from a quantitative to a qualitative assessment, reveals just how ugly the composition of "new jobs" has been. Consider this: the BLS reports that in February 2024, the US had 132.9 million full-time jobs and 27.9 million part-time jobs. Well, that's great... until you look back one year and find that in February 2023 the US had 133.2 million full-time jobs, or more than it does one year later! And yes, all the job growth since then has been in part-time jobs, which have increased by 921K since February 2023 (from 27.020 million to 27.941 million).

Here is a summary of the labor composition in the past year: all the new jobs have been part-time jobs!

But wait there's even more, because now that the primary season is over and we enter the heart of election season and political talking points will be thrown around left and right, especially in the context of the immigration crisis created intentionally by the Biden administration which is hoping to import millions of new Democratic voters (maybe the US can hold the presidential election in Honduras or Guatemala, after all it is their citizens that will be illegally casting the key votes in November), what we find is that in February, the number of native-born workers tumbled again, sliding by a massive 560K to just 129.807 million. Add to this the December data, and we get a near-record 2.4 million plunge in native-born workers in just the past 3 months (only the covid crash was worse)!

The offset? A record 1.2 million foreign-born (read immigrants, both legal and illegal but mostly illegal) workers added in February!

Said otherwise, not only has all job creation in the past 6 years has been exclusively for foreign-born workers...

... but there has been zero job-creation for native born workers since June 2018!

This is a huge issue - especially at a time of an illegal alien flood at the southwest border...

... and is about to become a huge political scandal, because once the inevitable recession finally hits, there will be millions of furious unemployed Americans demanding a more accurate explanation for what happened - i.e., the illegal immigration floodgates that were opened by the Biden admin.
Which is also why Biden's handlers will do everything in their power to insure there is no official recession before November... and why after the election is over, all economic hell will finally break loose. Until then, however, expect the jobs numbers to get even more ridiculous.


Wendy’s has a new deal for daylight savings time haters


Mortgage rates fall as labor market normalizes


Racial and Ethnic Wealth Inequality in the Post‑Pandemic Era


Watch: President Biden Delivers The “Darkest, Most Un-American Speech Given By A President”


Wealth Inequality by Age in the Post‑Pandemic Era


Interest rates, the best it gets. It’s time to deploy cash


Is the biotech market rally real? Data suggest comeback in private, public markets


February Employment Situation


People Who Received Ivermectin Were Better Off, Study Finds


Shipping company files surprise Chapter 7 bankruptcy, liquidation
-

 Uncategorized2 weeks ago
All Of The Elements Are In Place For An Economic Crisis Of Staggering Proportions
-

 Uncategorized1 month ago
Cathie Wood sells a major tech stock (again)
-

 Uncategorized3 weeks ago
California Counties Could Be Forced To Pay $300 Million To Cover COVID-Era Program
-

 Uncategorized2 weeks ago
Apparel Retailer Express Moving Toward Bankruptcy
-

 Uncategorized3 weeks ago
Industrial Production Decreased 0.1% in January
-

 International1 day ago
Walmart launches clever answer to Target’s new membership program
-

 Uncategorized3 weeks ago
RFK Jr: The Wuhan Cover-Up & The Rise Of The Biowarfare-Industrial Complex
-

 International2 days ago
EyePoint poaches medical chief from Apellis; Sandoz CFO, longtime BioNTech exec to retire