The Automobile Industry
The United States has experienced a rapid acceleration of inflation recently. This article examines the automobile industry, a sector experiencing higher…
Share this:

The United States has experienced a rapid acceleration of consumer price inflation since early 2021 despite initial assurances from the Federal Reserve and politicians that price increases would be “transitory”. Official annualized inflation, as measured by the Consumer Price Index for all Urban Consumers (CPI-U) increased from 1.4% in December 2020 to 5.4% in June 2021. Far from being “transitory”, the CPI-U then soared to 7% in December 2021 and 9.1% in June 2022.
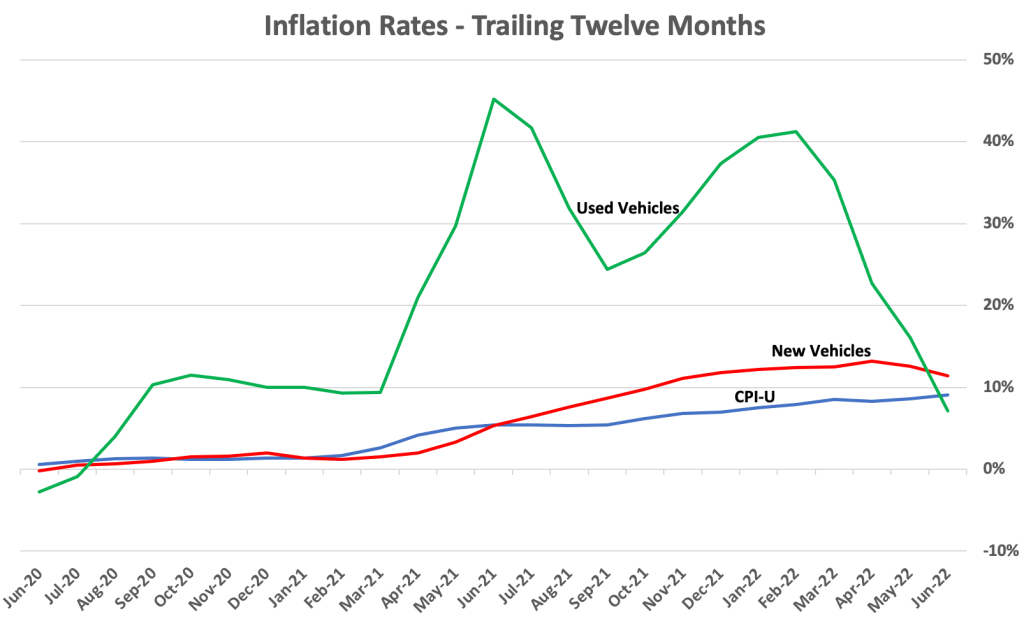
Of course, individual components of the CPI-U tend to move around much more than the overall measure. This has been most evident for components that are directly influenced by commodity prices with energy costs being the most obvious example. However, volatility has not been restricted to commodities. The price of new and used vehicles have both increased at a rapid clip over the past year.
The chart below shows the trailing twelve month rate of inflation for the CPI-U along with new and used vehicles:
My first car was a 1965 Ford Mustang that was nearly a quarter-century old by the time I was lucky enough to own it. One obvious thing about the car was its complete lack of modern technology. I could perform basic maintenance, such as oil changes, replacing spark plugs, rebuilding the carburetor, and much more without resorting to the use of any technology more advanced than a repair manual printed on paper.

Nostalgia has its place, but you cannot stop progress. The world has changed, and modern vehicles are essentially rolling computer systems heavily laden with advanced technology. Highly trained technicians are needed to perform most maintenance procedures. Supply chains for automobiles have become increasingly intricate and fragile and “just-in-time” inventory systems leave little margin for error. Assembly lines can be brought to a halt when key components suddenly become unavailable.
At the start of the pandemic, automakers closed plants in order to comply with mandates to shut down production in order to protect employees. Potential customers were unable to visit dealerships and the industry braced for a downturn of indeterminate length. The actions taken by automakers at the start of the pandemic rippled down the supply chain and caused companies supplying key components to also curtail or redirect production. These actions, while necessary at the time, turned out to not be easily reversible when the economy started to gradually open up.
Modern automobiles use hundreds of microchips. When auto production came to a halt in early 2020 and only slowly ramped back up, the industry reduced orders for microchips. However, customer demand for electronics continued through the pandemic and by the time automakers were ready to ramp up production, microchips were in short supply. Although conditions in microchip supplies have been easing recently, this has not entirely alleviated production problems for automakers.
When consumer demand increases and supplies are tight, the predictable result is a rise in prices, and this is exactly what has happened for new cars. The average price paid for a new vehicle exceeded $48,000 in June 2022 for the first time. As a point of comparison, two years ago, the average price of a new vehicle was $38,530. To make matters worse, interest rates for auto loans have been rising. The average monthly payment on a new car loan was $686 in June 2022 and 12.7% of new car buyers have signed up for monthly payments over $1,000.
With new cars in short supply, used cars began to experience rapid inflation starting in September 2020. This inflation was more extreme than for new cars. In June, I published a profile of America’s Car-Mart which included the following chart showing the average sales price of Car-Mart vehicles over time:

America’s Car-Mart offers vehicles at the low end of the used market. Most vehicles are between five and twelve years old and have between 70,000 to 150,000 miles.
CarMax is a the largest used-car dealership in the United States and offers vehicles that are generally newer and have lower mileage compared to America’s Car-Mart. The following graph shows the average sales price of CarMax vehicles over time:

The rapid rise in used car prices has resulted in strange situations such as cars actually appreciating in value. In some cases, people who purchased vehicles several years ago have been able to sell at a profit, something that is normally unheard of. Recovery rates realized by dealers who must repossess vehicles have also increased, leading to more aggressive repossessions. In normal times, dealers avoid repossession since it usually results in significant losses.
It is interesting to research sectors of the economy in turmoil and the automobile industry is no exception. In addition to the profile of America’s Car-Mart published in June, I have been researching CarMax more recently for a profile that will be published next week. Rather than include background information on the automobile industry in the CarMax write-up, I decided to put together this article to bring together some of the trends and sources that I’ve found.
The information in this article might be useful to those who are interested in further study of the auto industry. I have simply included a number of statistics that I find interesting. There is no overall theme to this article other than to highlight selected statistics and trends along with data source links for further study. I have created many of the charts based on underlying data sets while other charts are used directly. The exhibit captions contain links to the underlying source.
Interesting Statistics and Trends
The automobile market is an important component of gross domestic product. GDP figures include the value of new motor vehicles and parts. The used market is not included in GDP figures. In the second quarter of 2020, new motor vehicles and parts were running at $734.2 billion on a seasonally adjusted annualized basis. This was slightly under 3% of GDP for the second quarter. The following chart shows the share of motor vehicle output as a percentage of GDP over several decades:

According to a recent Deloitte report, the downward trend in the importance of domestic automobile production has to do with an increasing share of imports as well as higher growth in other sectors of the economy. We can see from the chart that automobile production is also highly cyclical, as we would expect. The sharp decline and subsequent rebound experienced during the pandemic was exaggerated and compressed, but not atypical compared to prior economic downturns.
The exhibit below shows the total number of motor vehicles registered in the United States since 1990. As of 2020, there were just under 276 million registered vehicles, of which 253.1 million were light duty vehicles and 8.3 million were motorcycles. The balance was comprised of heavy duty trucks and buses. We can see that total number of registered vehicles has increased slowly over the past decade.

It is important to understand that government statistics consider many ordinary passenger vehicles to be light-duty trucks. Along with pickup trucks, most minivans and sport utility vehicles are considered to be light-duty trucks, not automobiles. The automobile category is comprised of what we would identify as cars — sedans, coupes, and convertibles. There has been a multi-decade shift in consumer preferences from automobiles to light-duty trucks. The exhibit below shows the composition of registered vehicles in the United States in 2020.

How much are Americans using their vehicles? As we might expect, total vehicle miles traveled does not normally change that much from year to year. However, the pandemic caused a major reduction in travel which was reflected in a historic plunge in vehicle miles traveled in early 2020:

This plunge was quickly reversed as the economy reopened and we are now essentially back to normal in terms of vehicle usage. As an aside, public transit ridership never recovered from the pandemic. Public transit ridership in May 2022 was down 40.8% from its level in May 2019. It appears that people have returned to their cars, but not necessarily for the purpose of commuting, which is the primary use of public transit.
Over time, the durability of automobiles has increased, and this has been reflected in a rising average age of light vehicles in operation, as shown in the exhibit below:

Given the relatively slow growth in registered vehicles and miles traveled, it stands to reason that an increasing age of the light-vehicle fleet would reduce the number of new vehicles required annually. The increasing average age of vehicles also has implications for the used vehicle market. As vehicles last longer, resale value is likely to hold up somewhat better over time. The used car buyer looking at a typical seven year old car today could reasonably expect it to last another five to seven years. Two decades ago, a seven year old car was quickly approaching the end of its expected life.
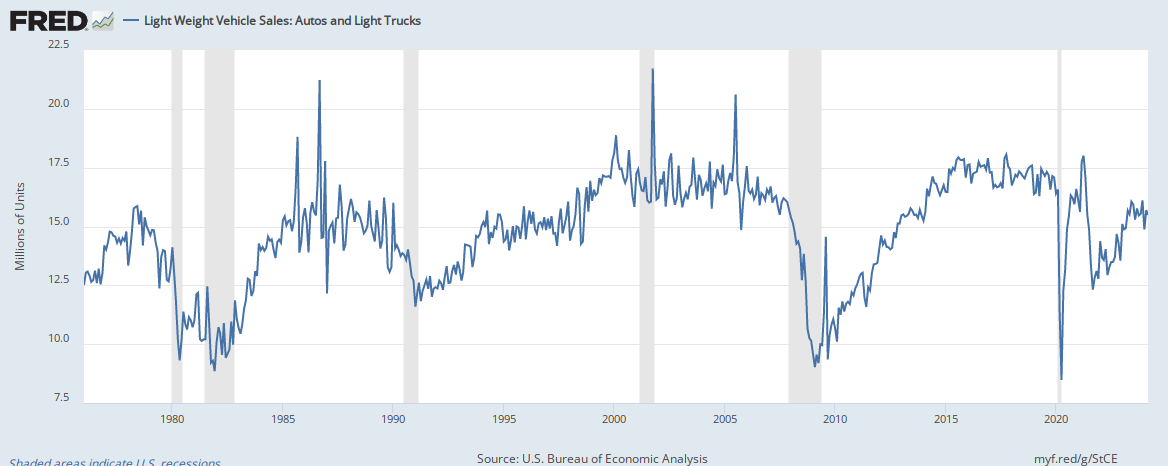
The exhibit below shows light vehicle sales in the United States since 1976. What is perhaps surprising is the amount of time that was required to recover from the decline during the financial crisis and recession of 2008-09. Aside from a brief spike that I believe was due to the “cash for clunkers” program, it took several years for auto sales to recover to the 15-18 million unit range that prevailed prior to the crisis.

As noted previously, the average age of a light vehicles in the United States has increased significantly, something we can deduce from total registered vehicles rising slowly over time even as new vehicle sales experienced a prolonged downturn during the first half of the 2010s.
As noted earlier, market preferences have shifted from passenger vehicles to light trucks in recent years. The following chart is similar to the one above except it breaks down total light vehicle sales between passenger vehicles and light trucks.1

Now that we have looked at some of the high level trends in terms of the size of the vehicle fleet and annual sales, let’s take a look at new and used auto prices. There are multiple sources of auto price data, some of which is behind paywalls. However, I have found publicly available pricing data from the Bureau of Transportation Statistics which gives us a sense of how new and used auto prices have trended in nominal dollars over long periods of time.
The following chart shows the average price of a new vehicle from 2010 to 2021. While the underlying data set includes figures prior to 2010, they are not directly comparable to more recent data due to a change in the data source.

The Bureau of Transportation Statistics dataset does not include used car prices after 2019, so it is of limited utility for our purposes. However, we do have the charts for America’s Car-Mart and CarMax presented earlier showing recent trends in used car prices at the low-end and mainstream segments of the used car market.
In nominal terms, both new and used car prices have increased significantly over the years. However, according to the Bureau of Labor Statistics, quality improvements in automobiles supposedly accounted for the entirety of the price increases until the recent post-pandemic spike. The following charts show a very long view of the CPI for new and used vehicles since the mid 1950s.
New Vehicles

Used Vehicles

If you are skeptical that quality improvements account for nearly all of the nominal increases in new and used vehicles from the mid-1990s until just prior to the pandemic, you are not alone. However, it is true that vehicles have improved a great deal over that quarter-century span. The increasing average age of vehicles on the road demonstrates that durability has increased, and it is true that current cars have more electronics and safety enhancements compared to the vehicles of the mid-1990s.
The Bureau of Labor Statistics has published a webpage explaining how it adjusts the CPI for vehicle improvements. Another document, Guidelines for Quality Adjustment of New Vehicle Prices, goes into even more detail. Ultimately, how to account for quality improvements is a judgment call.
In addition to the 1965 Ford Mustang, over the years I have owned a 1987 Plymouth, a 2001 Ford F350, a 2003 Toyota Camry, and a 2008 Ford Mustang. While the 1965 Mustang and 1987 Plymouth were very primitive by modern standards, the vehicles of the 2000s had many of the same conveniences we take for granted today, with the exception of navigation systems and integration with mobile devices.
While the extent of quality adjustments over the past quarter century is debatable, it is clear that we have seen significant inflation since the pandemic that cannot be explained by changes in quality, and the official CPI figures reflect this reality.
Conclusion
It is difficult to study individual companies within an industry without first looking at the industry as a whole. This is definitely the case when it comes to the automobile industry in the United States. We are fortunate to have a wealth of statistics that are publicly available, although it takes quite a bit of digging to uncover the desired data.
Over the past two years, the pandemic has heavily impacted the market for both new and used vehicles. As the supply of new vehicles was constrained due to persistent supply chain problems, buyers turned to the used car market. Heavy demand for used cars caused significant price inflation that far exceeded inflation for new vehicles. As supply chain conditions ease, new vehicle production should increase in the coming months. The impact on new and used car pricing remains to be seen.
Hopefully this article has been helpful to those with an interest in the automobile market. Next week, I will publish a profile of CarMax, the largest used car dealership in the United States. If you would like to receive that profile, as well as to gain access to all previous business profiles, please consider signing up for a paid subscription.
Copyright, Disclosures, and Privacy Information
Nothing in this newsletter constitutes investment advice and all content is subject to the copyright and disclaimer policy of The Rational Walk LLC.
Your privacy is taken very seriously. No email addresses or any other subscriber information is ever sold or provided to third parties. If you choose to unsubscribe at any time, you will no longer receive any further communications of any kind.
The Rational Walk is a participant in the Amazon Services LLC Associates Program, an affiliate advertising program designed to provide a means for sites to earn advertising fees by advertising and linking to Amazon.com.
- Note that the Bureau of Transportation Statistics dataset is annual while the St. Louis Fed’s dataset is monthly and shows data on an annualized basis.
Government
Are Voters Recoiling Against Disorder?
Are Voters Recoiling Against Disorder?
Authored by Michael Barone via The Epoch Times (emphasis ours),
The headlines coming out of the Super…
Share this:


Authored by Michael Barone via The Epoch Times (emphasis ours),
The headlines coming out of the Super Tuesday primaries have got it right. Barring cataclysmic changes, Donald Trump and Joe Biden will be the Republican and Democratic nominees for president in 2024.
With Nikki Haley’s withdrawal, there will be no more significantly contested primaries or caucuses—the earliest both parties’ races have been over since something like the current primary-dominated system was put in place in 1972.
The primary results have spotlighted some of both nominees’ weaknesses.
Donald Trump lost high-income, high-educated constituencies, including the entire metro area—aka the Swamp. Many but by no means all Haley votes there were cast by Biden Democrats. Mr. Trump can’t afford to lose too many of the others in target states like Pennsylvania and Michigan.
Majorities and large minorities of voters in overwhelmingly Latino counties in Texas’s Rio Grande Valley and some in Houston voted against Joe Biden, and even more against Senate nominee Rep. Colin Allred (D-Texas).
Returns from Hispanic precincts in New Hampshire and Massachusetts show the same thing. Mr. Biden can’t afford to lose too many Latino votes in target states like Arizona and Georgia.
When Mr. Trump rode down that escalator in 2015, commentators assumed he’d repel Latinos. Instead, Latino voters nationally, and especially the closest eyewitnesses of Biden’s open-border policy, have been trending heavily Republican.
High-income liberal Democrats may sport lawn signs proclaiming, “In this house, we believe ... no human is illegal.” The logical consequence of that belief is an open border. But modest-income folks in border counties know that flows of illegal immigrants result in disorder, disease, and crime.
There is plenty of impatience with increased disorder in election returns below the presidential level. Consider Los Angeles County, America’s largest county, with nearly 10 million people, more people than 40 of the 50 states. It voted 71 percent for Mr. Biden in 2020.
Current returns show county District Attorney George Gascon winning only 21 percent of the vote in the nonpartisan primary. He’ll apparently face Republican Nathan Hochman, a critic of his liberal policies, in November.
Gascon, elected after the May 2020 death of counterfeit-passing suspect George Floyd in Minneapolis, is one of many county prosecutors supported by billionaire George Soros. His policies include not charging juveniles as adults, not seeking higher penalties for gang membership or use of firearms, and bringing fewer misdemeanor cases.
The predictable result has been increased car thefts, burglaries, and personal robberies. Some 120 assistant district attorneys have left the office, and there’s a backlog of 10,000 unprosecuted cases.
More than a dozen other Soros-backed and similarly liberal prosecutors have faced strong opposition or have left office.
St. Louis prosecutor Kim Gardner resigned last May amid lawsuits seeking her removal, Milwaukee’s John Chisholm retired in January, and Baltimore’s Marilyn Mosby was defeated in July 2022 and convicted of perjury in September 2023. Last November, Loudoun County, Virginia, voters (62 percent Biden) ousted liberal Buta Biberaj, who declined to prosecute a transgender student for assault, and in June 2022 voters in San Francisco (85 percent Biden) recalled famed radical Chesa Boudin.
Similarly, this Tuesday, voters in San Francisco passed ballot measures strengthening police powers and requiring treatment of drug-addicted welfare recipients.
In retrospect, it appears the Floyd video, appearing after three months of COVID-19 confinement, sparked a frenzied, even crazed reaction, especially among the highly educated and articulate. One fatal incident was seen as proof that America’s “systemic racism” was worse than ever and that police forces should be defunded and perhaps abolished.
2020 was “the year America went crazy,” I wrote in January 2021, a year in which police funding was actually cut by Democrats in New York, Los Angeles, San Francisco, Seattle, and Denver. A year in which young New York Times (NYT) staffers claimed they were endangered by the publication of Sen. Tom Cotton’s (R-Ark.) opinion article advocating calling in military forces if necessary to stop rioting, as had been done in Detroit in 1967 and Los Angeles in 1992. A craven NYT publisher even fired the editorial page editor for running the article.
Evidence of visible and tangible discontent with increasing violence and its consequences—barren and locked shelves in Manhattan chain drugstores, skyrocketing carjackings in Washington, D.C.—is as unmistakable in polls and election results as it is in daily life in large metropolitan areas. Maybe 2024 will turn out to be the year even liberal America stopped acting crazy.
Chaos and disorder work against incumbents, as they did in 1968 when Democrats saw their party’s popular vote fall from 61 percent to 43 percent.
Views expressed in this article are opinions of the author and do not necessarily reflect the views of The Epoch Times or ZeroHedge.
Government
Veterans Affairs Kept COVID-19 Vaccine Mandate In Place Without Evidence
Veterans Affairs Kept COVID-19 Vaccine Mandate In Place Without Evidence
Authored by Zachary Stieber via The Epoch Times (emphasis ours),
The…
Share this:


Authored by Zachary Stieber via The Epoch Times (emphasis ours),
The U.S. Department of Veterans Affairs (VA) reviewed no data when deciding in 2023 to keep its COVID-19 vaccine mandate in place.
VA Secretary Denis McDonough said on May 1, 2023, that the end of many other federal mandates “will not impact current policies at the Department of Veterans Affairs.”
He said the mandate was remaining for VA health care personnel “to ensure the safety of veterans and our colleagues.”
Mr. McDonough did not cite any studies or other data. A VA spokesperson declined to provide any data that was reviewed when deciding not to rescind the mandate. The Epoch Times submitted a Freedom of Information Act for “all documents outlining which data was relied upon when establishing the mandate when deciding to keep the mandate in place.”
The agency searched for such data and did not find any.
“The VA does not even attempt to justify its policies with science, because it can’t,” Leslie Manookian, president and founder of the Health Freedom Defense Fund, told The Epoch Times.
“The VA just trusts that the process and cost of challenging its unfounded policies is so onerous, most people are dissuaded from even trying,” she added.
The VA’s mandate remains in place to this day.
The VA’s website claims that vaccines “help protect you from getting severe illness” and “offer good protection against most COVID-19 variants,” pointing in part to observational data from the U.S. Centers for Disease Control and Prevention (CDC) that estimate the vaccines provide poor protection against symptomatic infection and transient shielding against hospitalization.
There have also been increasing concerns among outside scientists about confirmed side effects like heart inflammation—the VA hid a safety signal it detected for the inflammation—and possible side effects such as tinnitus, which shift the benefit-risk calculus.
President Joe Biden imposed a slate of COVID-19 vaccine mandates in 2021. The VA was the first federal agency to implement a mandate.
President Biden rescinded the mandates in May 2023, citing a drop in COVID-19 cases and hospitalizations. His administration maintains the choice to require vaccines was the right one and saved lives.
“Our administration’s vaccination requirements helped ensure the safety of workers in critical workforces including those in the healthcare and education sectors, protecting themselves and the populations they serve, and strengthening their ability to provide services without disruptions to operations,” the White House said.
Some experts said requiring vaccination meant many younger people were forced to get a vaccine despite the risks potentially outweighing the benefits, leaving fewer doses for older adults.
“By mandating the vaccines to younger people and those with natural immunity from having had COVID, older people in the U.S. and other countries did not have access to them, and many people might have died because of that,” Martin Kulldorff, a professor of medicine on leave from Harvard Medical School, told The Epoch Times previously.
The VA was one of just a handful of agencies to keep its mandate in place following the removal of many federal mandates.
“At this time, the vaccine requirement will remain in effect for VA health care personnel, including VA psychologists, pharmacists, social workers, nursing assistants, physical therapists, respiratory therapists, peer specialists, medical support assistants, engineers, housekeepers, and other clinical, administrative, and infrastructure support employees,” Mr. McDonough wrote to VA employees at the time.
“This also includes VA volunteers and contractors. Effectively, this means that any Veterans Health Administration (VHA) employee, volunteer, or contractor who works in VHA facilities, visits VHA facilities, or provides direct care to those we serve will still be subject to the vaccine requirement at this time,” he said. “We continue to monitor and discuss this requirement, and we will provide more information about the vaccination requirements for VA health care employees soon. As always, we will process requests for vaccination exceptions in accordance with applicable laws, regulations, and policies.”
The version of the shots cleared in the fall of 2022, and available through the fall of 2023, did not have any clinical trial data supporting them.
A new version was approved in the fall of 2023 because there were indications that the shots not only offered temporary protection but also that the level of protection was lower than what was observed during earlier stages of the pandemic.
Ms. Manookian, whose group has challenged several of the federal mandates, said that the mandate “illustrates the dangers of the administrative state and how these federal agencies have become a law unto themselves.”
Spread & Containment
The Coming Of The Police State In America
The Coming Of The Police State In America
Authored by Jeffrey Tucker via The Epoch Times,
The National Guard and the State Police are now…
Share this:


Authored by Jeffrey Tucker via The Epoch Times,
The National Guard and the State Police are now patrolling the New York City subway system in an attempt to do something about the explosion of crime. As part of this, there are bag checks and new surveillance of all passengers. No legislation, no debate, just an edict from the mayor.
Many citizens who rely on this system for transportation might welcome this. It’s a city of strict gun control, and no one knows for sure if they have the right to defend themselves. Merchants have been harassed and even arrested for trying to stop looting and pillaging in their own shops.
The message has been sent: Only the police can do this job. Whether they do it or not is another matter.
Things on the subway system have gotten crazy. If you know it well, you can manage to travel safely, but visitors to the city who take the wrong train at the wrong time are taking grave risks.
In actual fact, it’s guaranteed that this will only end in confiscating knives and other things that people carry in order to protect themselves while leaving the actual criminals even more free to prey on citizens.
The law-abiding will suffer and the criminals will grow more numerous. It will not end well.
When you step back from the details, what we have is the dawning of a genuine police state in the United States. It only starts in New York City. Where is the Guard going to be deployed next? Anywhere is possible.
If the crime is bad enough, citizens will welcome it. It must have been this way in most times and places that when the police state arrives, the people cheer.
We will all have our own stories of how this came to be. Some might begin with the passage of the Patriot Act and the establishment of the Department of Homeland Security in 2001. Some will focus on gun control and the taking away of citizens’ rights to defend themselves.
My own version of events is closer in time. It began four years ago this month with lockdowns. That’s what shattered the capacity of civil society to function in the United States. Everything that has happened since follows like one domino tumbling after another.
It goes like this:
1) lockdown,
2) loss of moral compass and spreading of loneliness and nihilism,
3) rioting resulting from citizen frustration, 4) police absent because of ideological hectoring,
5) a rise in uncontrolled immigration/refugees,
6) an epidemic of ill health from substance abuse and otherwise,
7) businesses flee the city
8) cities fall into decay, and that results in
9) more surveillance and police state.
The 10th stage is the sacking of liberty and civilization itself.
It doesn’t fall out this way at every point in history, but this seems like a solid outline of what happened in this case. Four years is a very short period of time to see all of this unfold. But it is a fact that New York City was more-or-less civilized only four years ago. No one could have predicted that it would come to this so quickly.
But once the lockdowns happened, all bets were off. Here we had a policy that most directly trampled on all freedoms that we had taken for granted. Schools, businesses, and churches were slammed shut, with various levels of enforcement. The entire workforce was divided between essential and nonessential, and there was widespread confusion about who precisely was in charge of designating and enforcing this.
It felt like martial law at the time, as if all normal civilian law had been displaced by something else. That something had to do with public health, but there was clearly more going on, because suddenly our social media posts were censored and we were being asked to do things that made no sense, such as mask up for a virus that evaded mask protection and walk in only one direction in grocery aisles.
Vast amounts of the white-collar workforce stayed home—and their kids, too—until it became too much to bear. The city became a ghost town. Most U.S. cities were the same.
As the months of disaster rolled on, the captives were let out of their houses for the summer in order to protest racism but no other reason. As a way of excusing this, the same public health authorities said that racism was a virus as bad as COVID-19, so therefore it was permitted.
The protests had turned to riots in many cities, and the police were being defunded and discouraged to do anything about the problem. Citizens watched in horror as downtowns burned and drug-crazed freaks took over whole sections of cities. It was like every standard of decency had been zapped out of an entire swath of the population.
Meanwhile, large checks were arriving in people’s bank accounts, defying every normal economic expectation. How could people not be working and get their bank accounts more flush with cash than ever? There was a new law that didn’t even require that people pay rent. How weird was that? Even student loans didn’t need to be paid.
By the fall, recess from lockdown was over and everyone was told to go home again. But this time they had a job to do: They were supposed to vote. Not at the polling places, because going there would only spread germs, or so the media said. When the voting results finally came in, it was the absentee ballots that swung the election in favor of the opposition party that actually wanted more lockdowns and eventually pushed vaccine mandates on the whole population.
The new party in control took note of the large population movements out of cities and states that they controlled. This would have a large effect on voting patterns in the future. But they had a plan. They would open the borders to millions of people in the guise of caring for refugees. These new warm bodies would become voters in time and certainly count on the census when it came time to reapportion political power.
Meanwhile, the native population had begun to swim in ill health from substance abuse, widespread depression, and demoralization, plus vaccine injury. This increased dependency on the very institutions that had caused the problem in the first place: the medical/scientific establishment.
The rise of crime drove the small businesses out of the city. They had barely survived the lockdowns, but they certainly could not survive the crime epidemic. This undermined the tax base of the city and allowed the criminals to take further control.
The same cities became sanctuaries for the waves of migrants sacking the country, and partisan mayors actually used tax dollars to house these invaders in high-end hotels in the name of having compassion for the stranger. Citizens were pushed out to make way for rampaging migrant hordes, as incredible as this seems.
But with that, of course, crime rose ever further, inciting citizen anger and providing a pretext to bring in the police state in the form of the National Guard, now tasked with cracking down on crime in the transportation system.
What’s the next step? It’s probably already here: mass surveillance and censorship, plus ever-expanding police power. This will be accompanied by further population movements, as those with the means to do so flee the city and even the country and leave it for everyone else to suffer.
As I tell the story, all of this seems inevitable. It is not. It could have been stopped at any point. A wise and prudent political leadership could have admitted the error from the beginning and called on the country to rediscover freedom, decency, and the difference between right and wrong. But ego and pride stopped that from happening, and we are left with the consequences.
The government grows ever bigger and civil society ever less capable of managing itself in large urban centers. Disaster is unfolding in real time, mitigated only by a rising stock market and a financial system that has yet to fall apart completely.
Are we at the middle stages of total collapse, or at the point where the population and people in leadership positions wise up and decide to put an end to the downward slide? It’s hard to know. But this much we do know: There is a growing pocket of resistance out there that is fed up and refuses to sit by and watch this great country be sacked and taken over by everything it was set up to prevent.


Walmart launches clever answer to Target’s new membership program


EyePoint poaches medical chief from Apellis; Sandoz CFO, longtime BioNTech exec to retire


Wendy’s has a new deal for daylight savings time haters


Veterans Affairs Kept COVID-19 Vaccine Mandate In Place Without Evidence


The Coming Of The Police State In America


When Military Rule Supplants Democracy


Catastrophic Risk: Investing and Business Implications


Where Is R‑Star and the End of the Refi Boom: The Top 5 Posts of 2023


Mortgage rates fall as labor market normalizes


The Digest #187
-

 Uncategorized2 weeks ago
All Of The Elements Are In Place For An Economic Crisis Of Staggering Proportions
-

 Uncategorized1 month ago
Cathie Wood sells a major tech stock (again)
-

 Uncategorized3 weeks ago
California Counties Could Be Forced To Pay $300 Million To Cover COVID-Era Program
-

 Uncategorized2 weeks ago
Apparel Retailer Express Moving Toward Bankruptcy
-

 Uncategorized3 weeks ago
Industrial Production Decreased 0.1% in January
-
International2 days ago
Walmart launches clever answer to Target’s new membership program
-
International2 days ago
EyePoint poaches medical chief from Apellis; Sandoz CFO, longtime BioNTech exec to retire
-

 Uncategorized3 weeks ago
RFK Jr: The Wuhan Cover-Up & The Rise Of The Biowarfare-Industrial Complex